Copyright
©The Author(s) 2023.
World J Gastroenterol. Aug 21, 2023; 29(31): 4797-4808
Published online Aug 21, 2023. doi: 10.3748/wjg.v29.i31.4797
Published online Aug 21, 2023. doi: 10.3748/wjg.v29.i31.4797
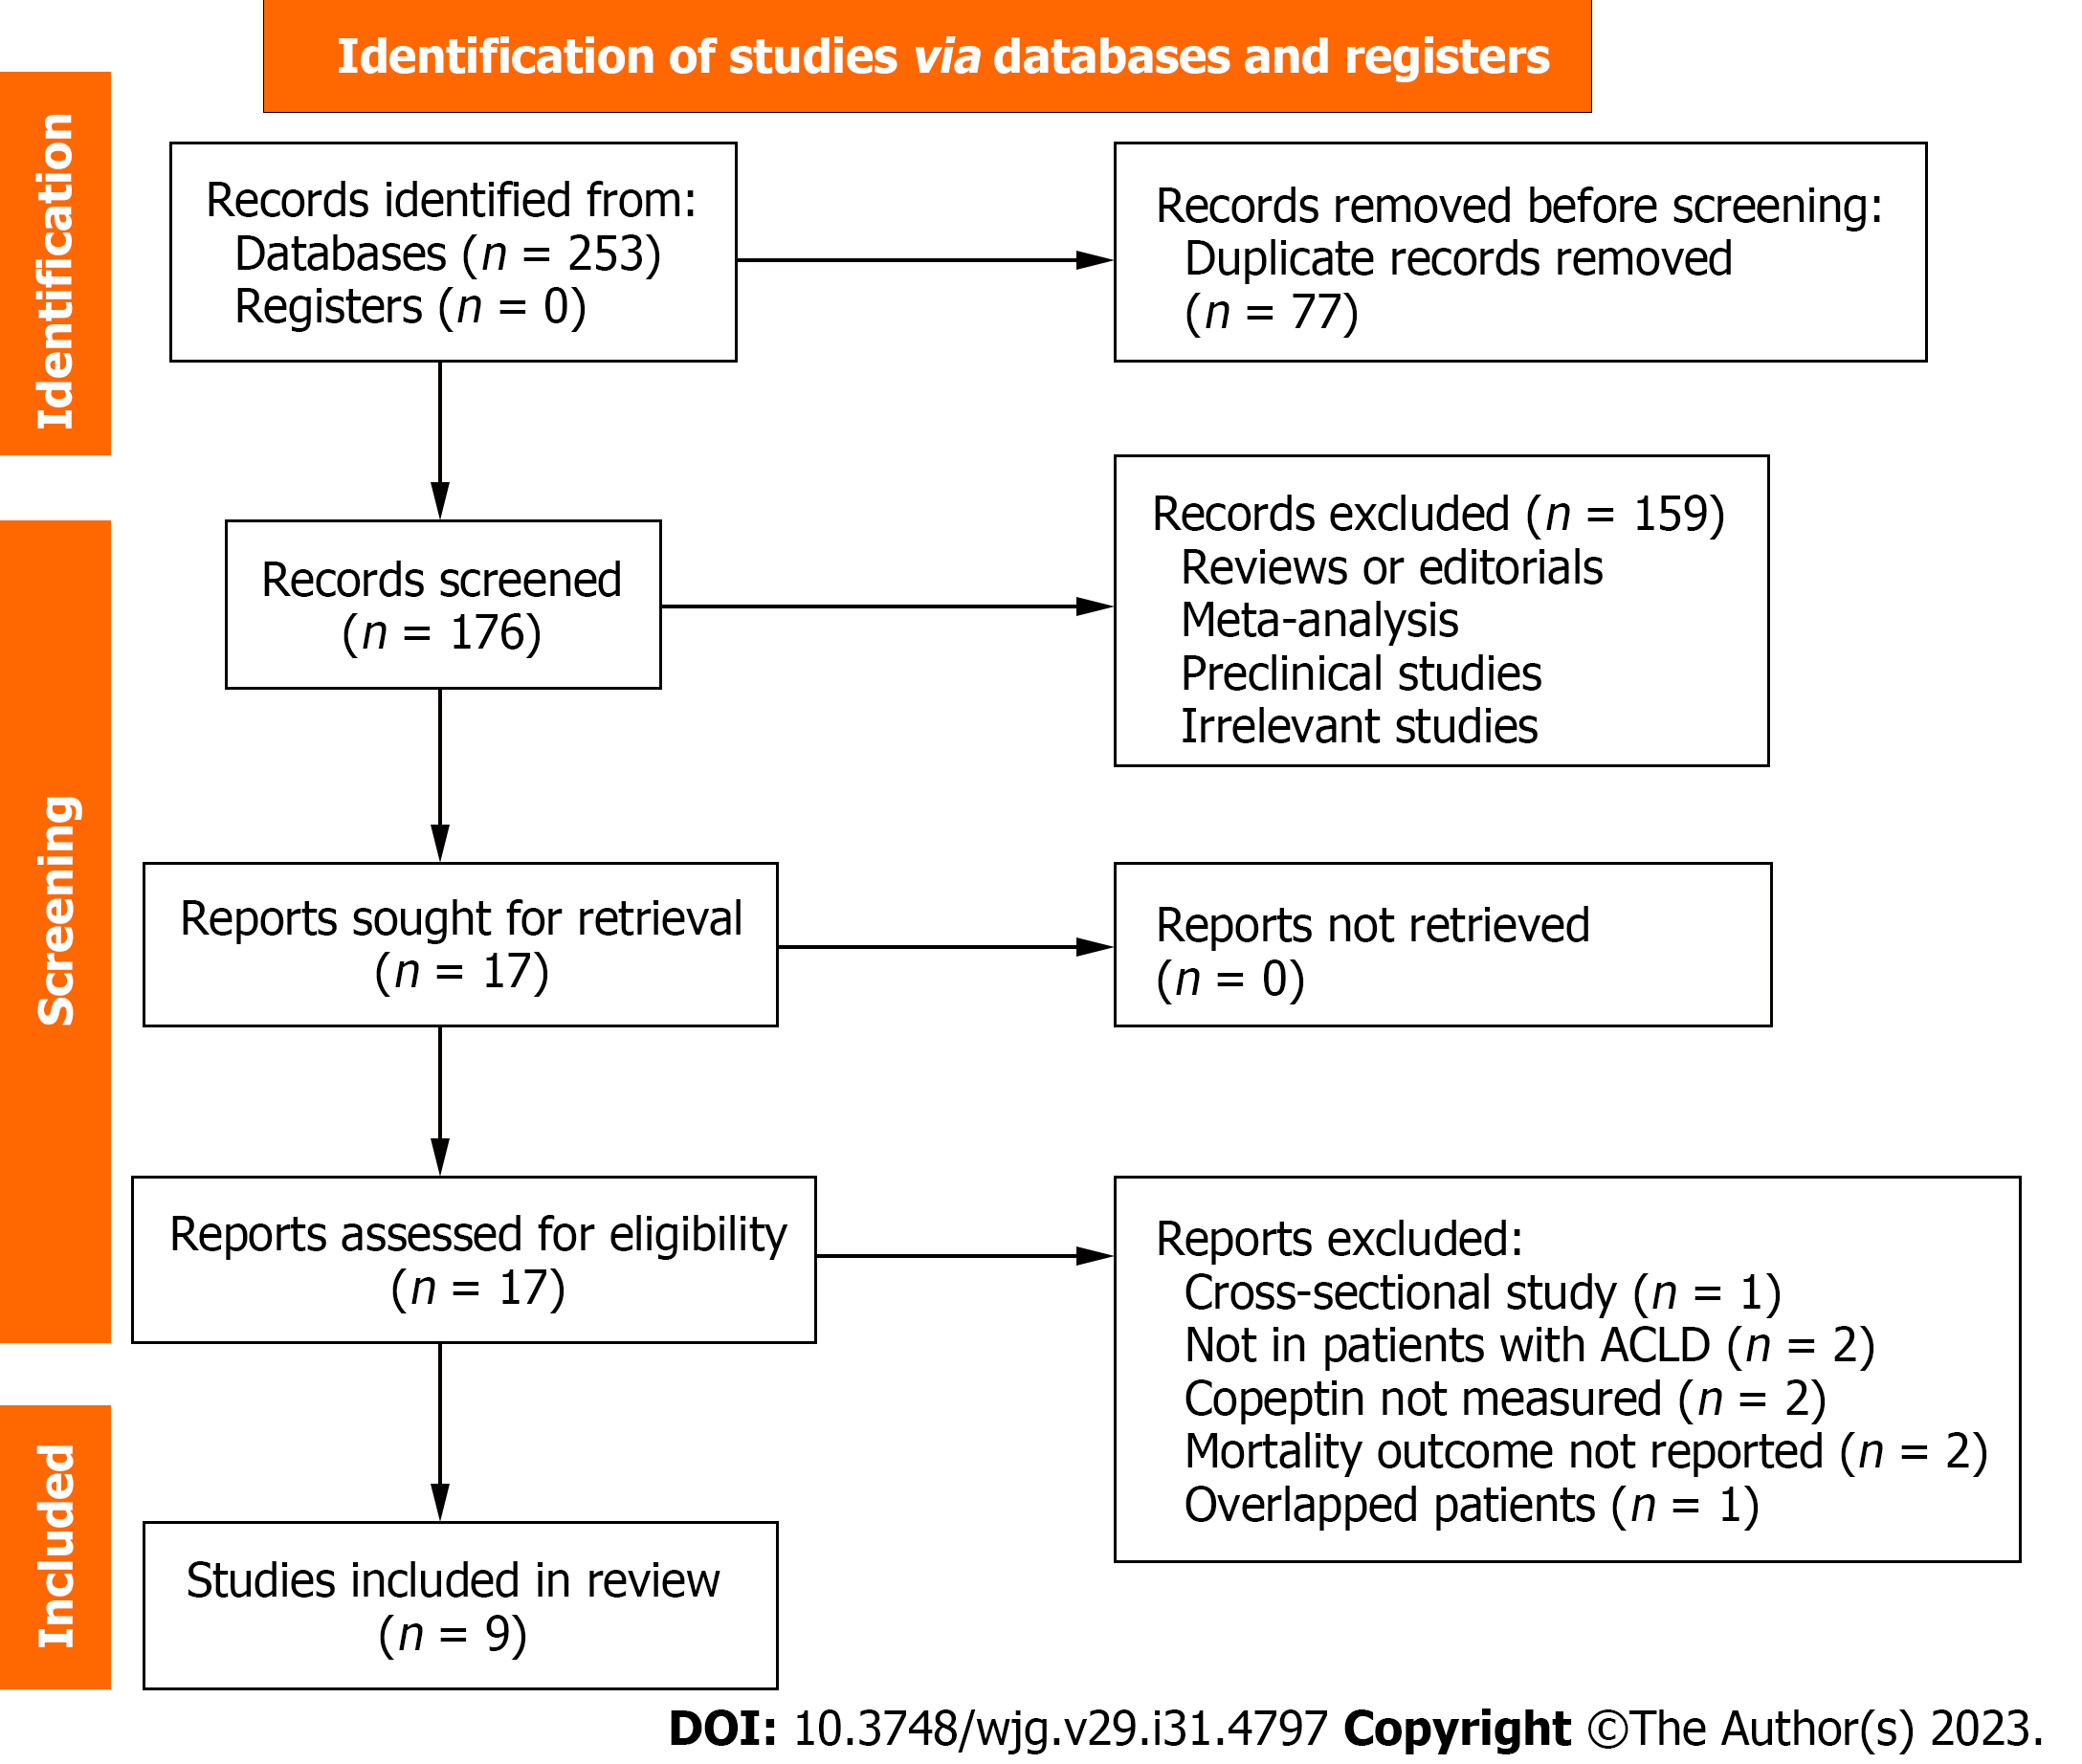
Figure 1 Flowchart of database search and study inclusion.
ACLD: Advanced chronic liver diseases.
Figure 2 Forest plots for the overall meta-analyses regarding the association between serum copeptin and transplant-free survival of patients with chronic liver diseases.
95%CI: 95% confidence interval.
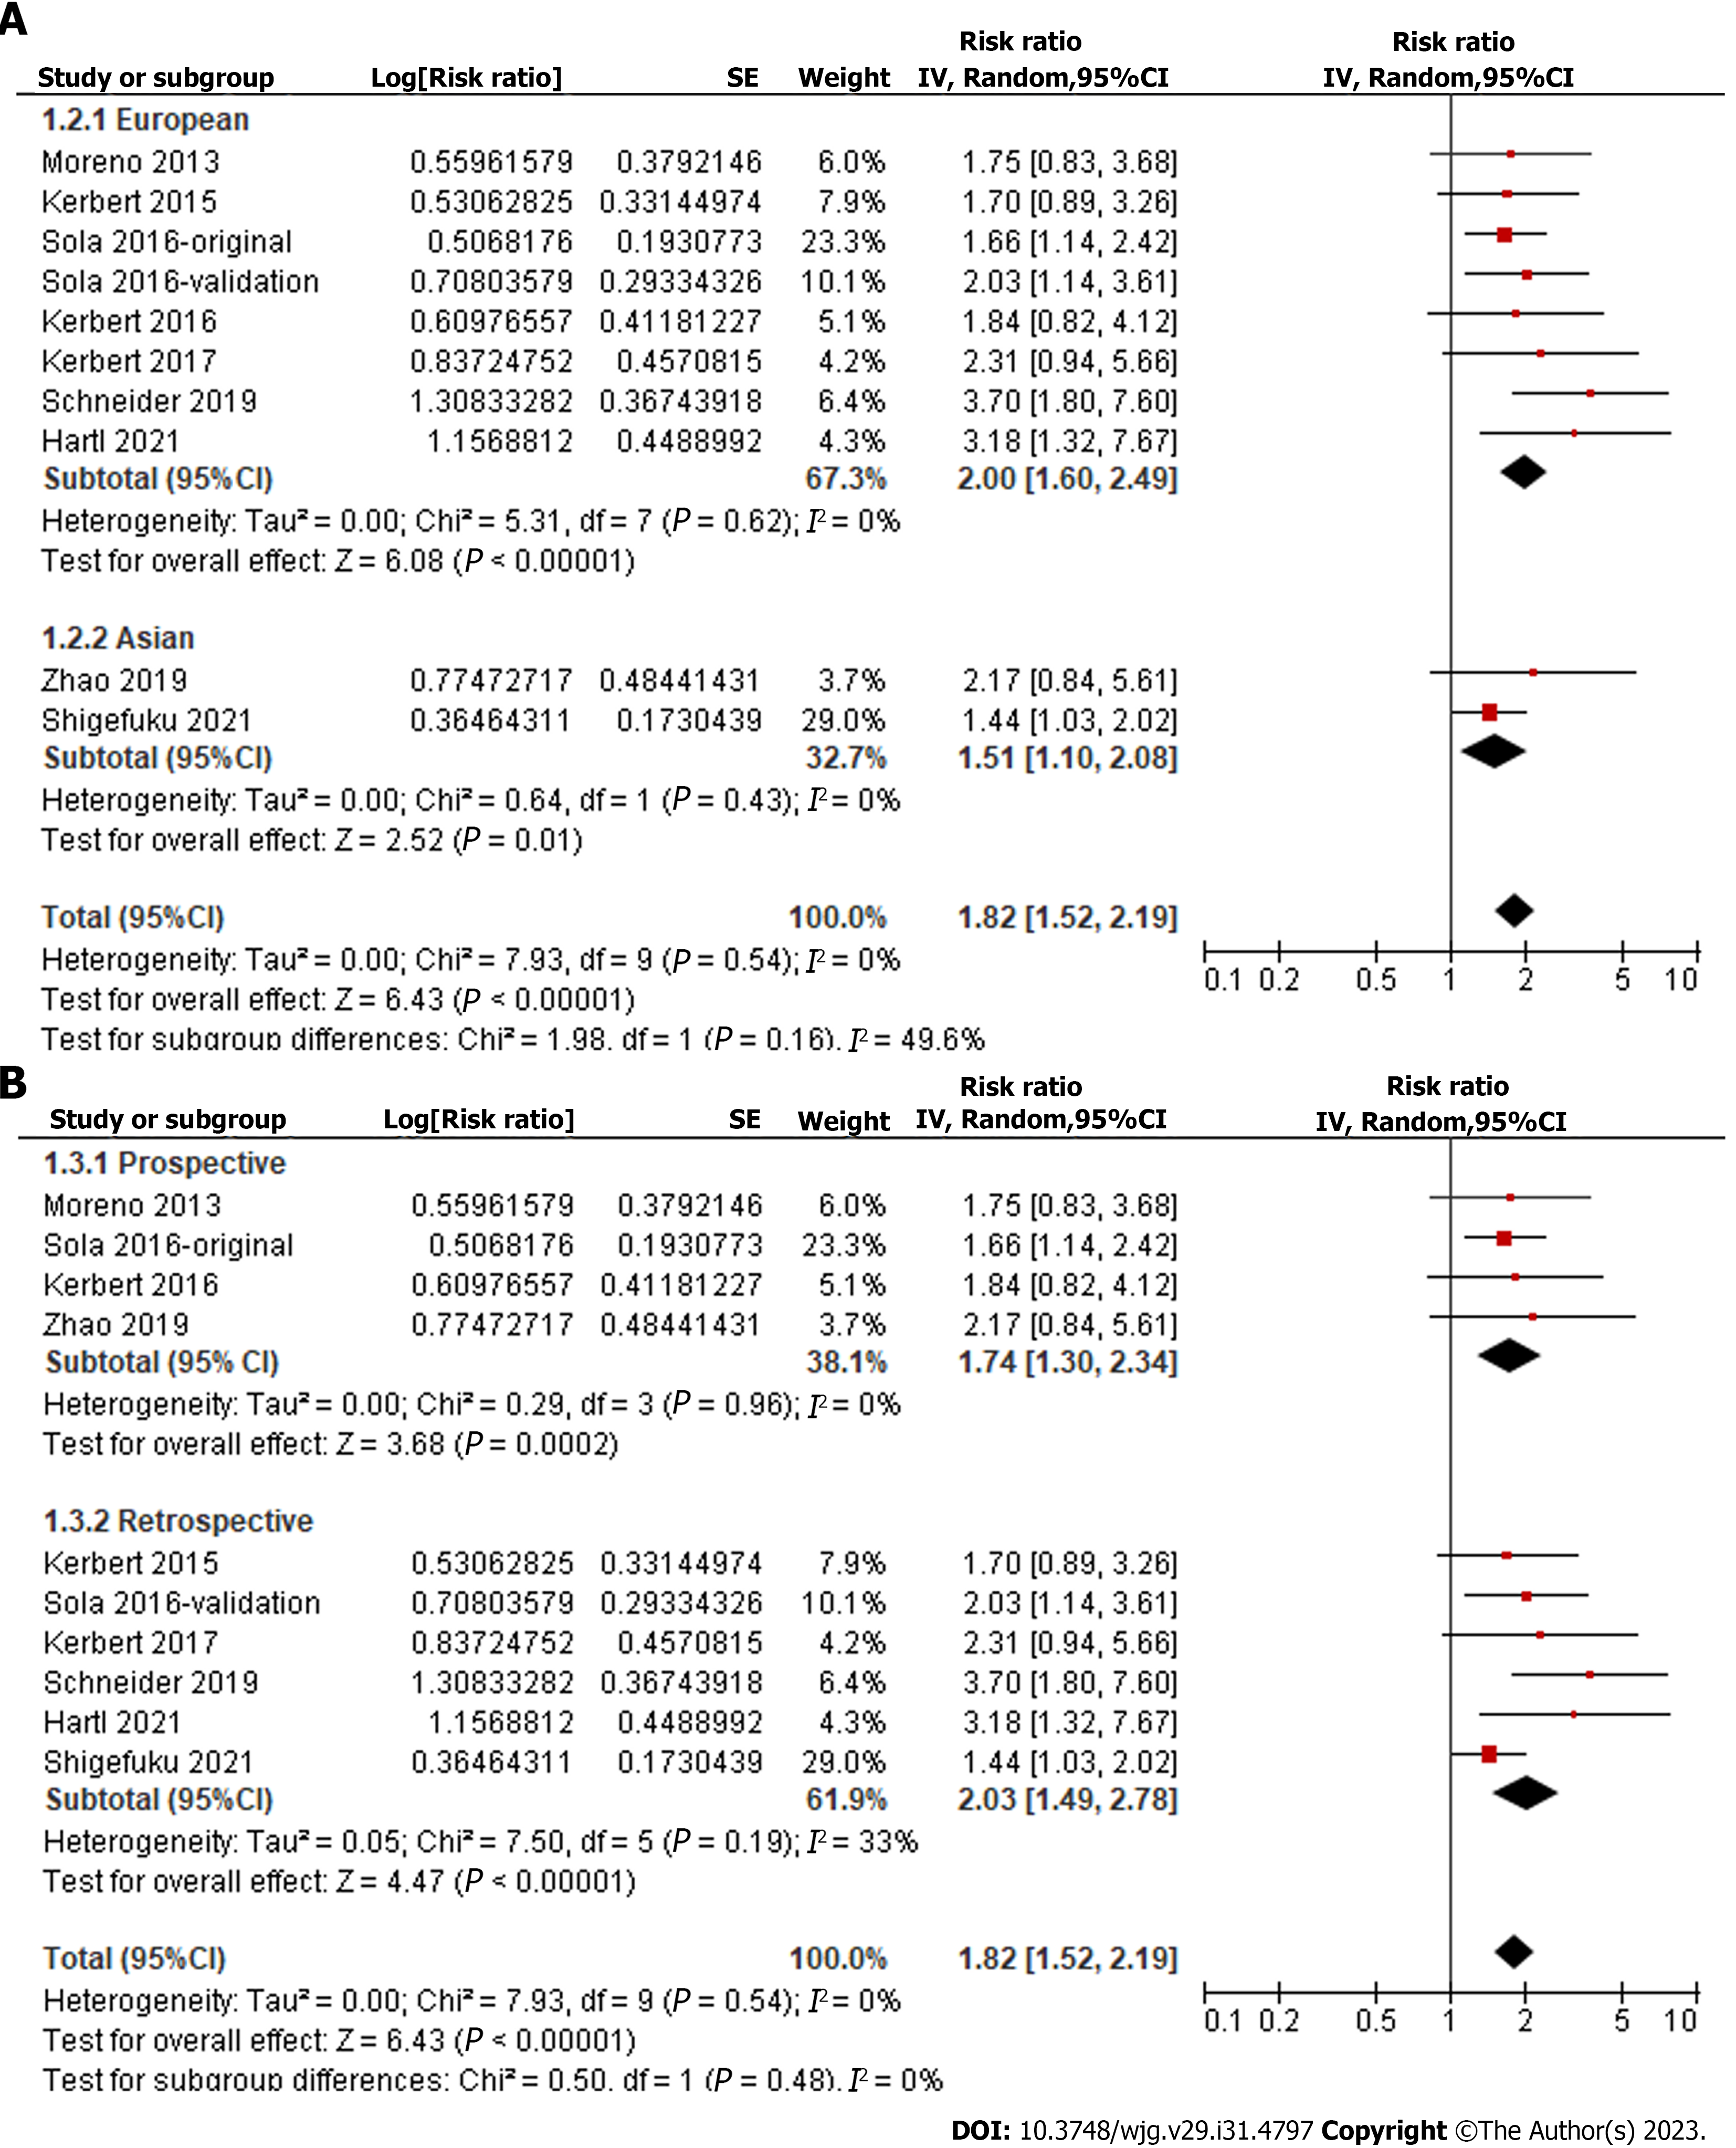
Figure 3 Forest plots for the subgroup analyses regarding the association between serum copeptin and transplant-free survival of patients with chronic liver diseases.
A: subgroup analysis according to study country; B: Subgroup analysis according to study design. 95%CI: 95% confidence interval.
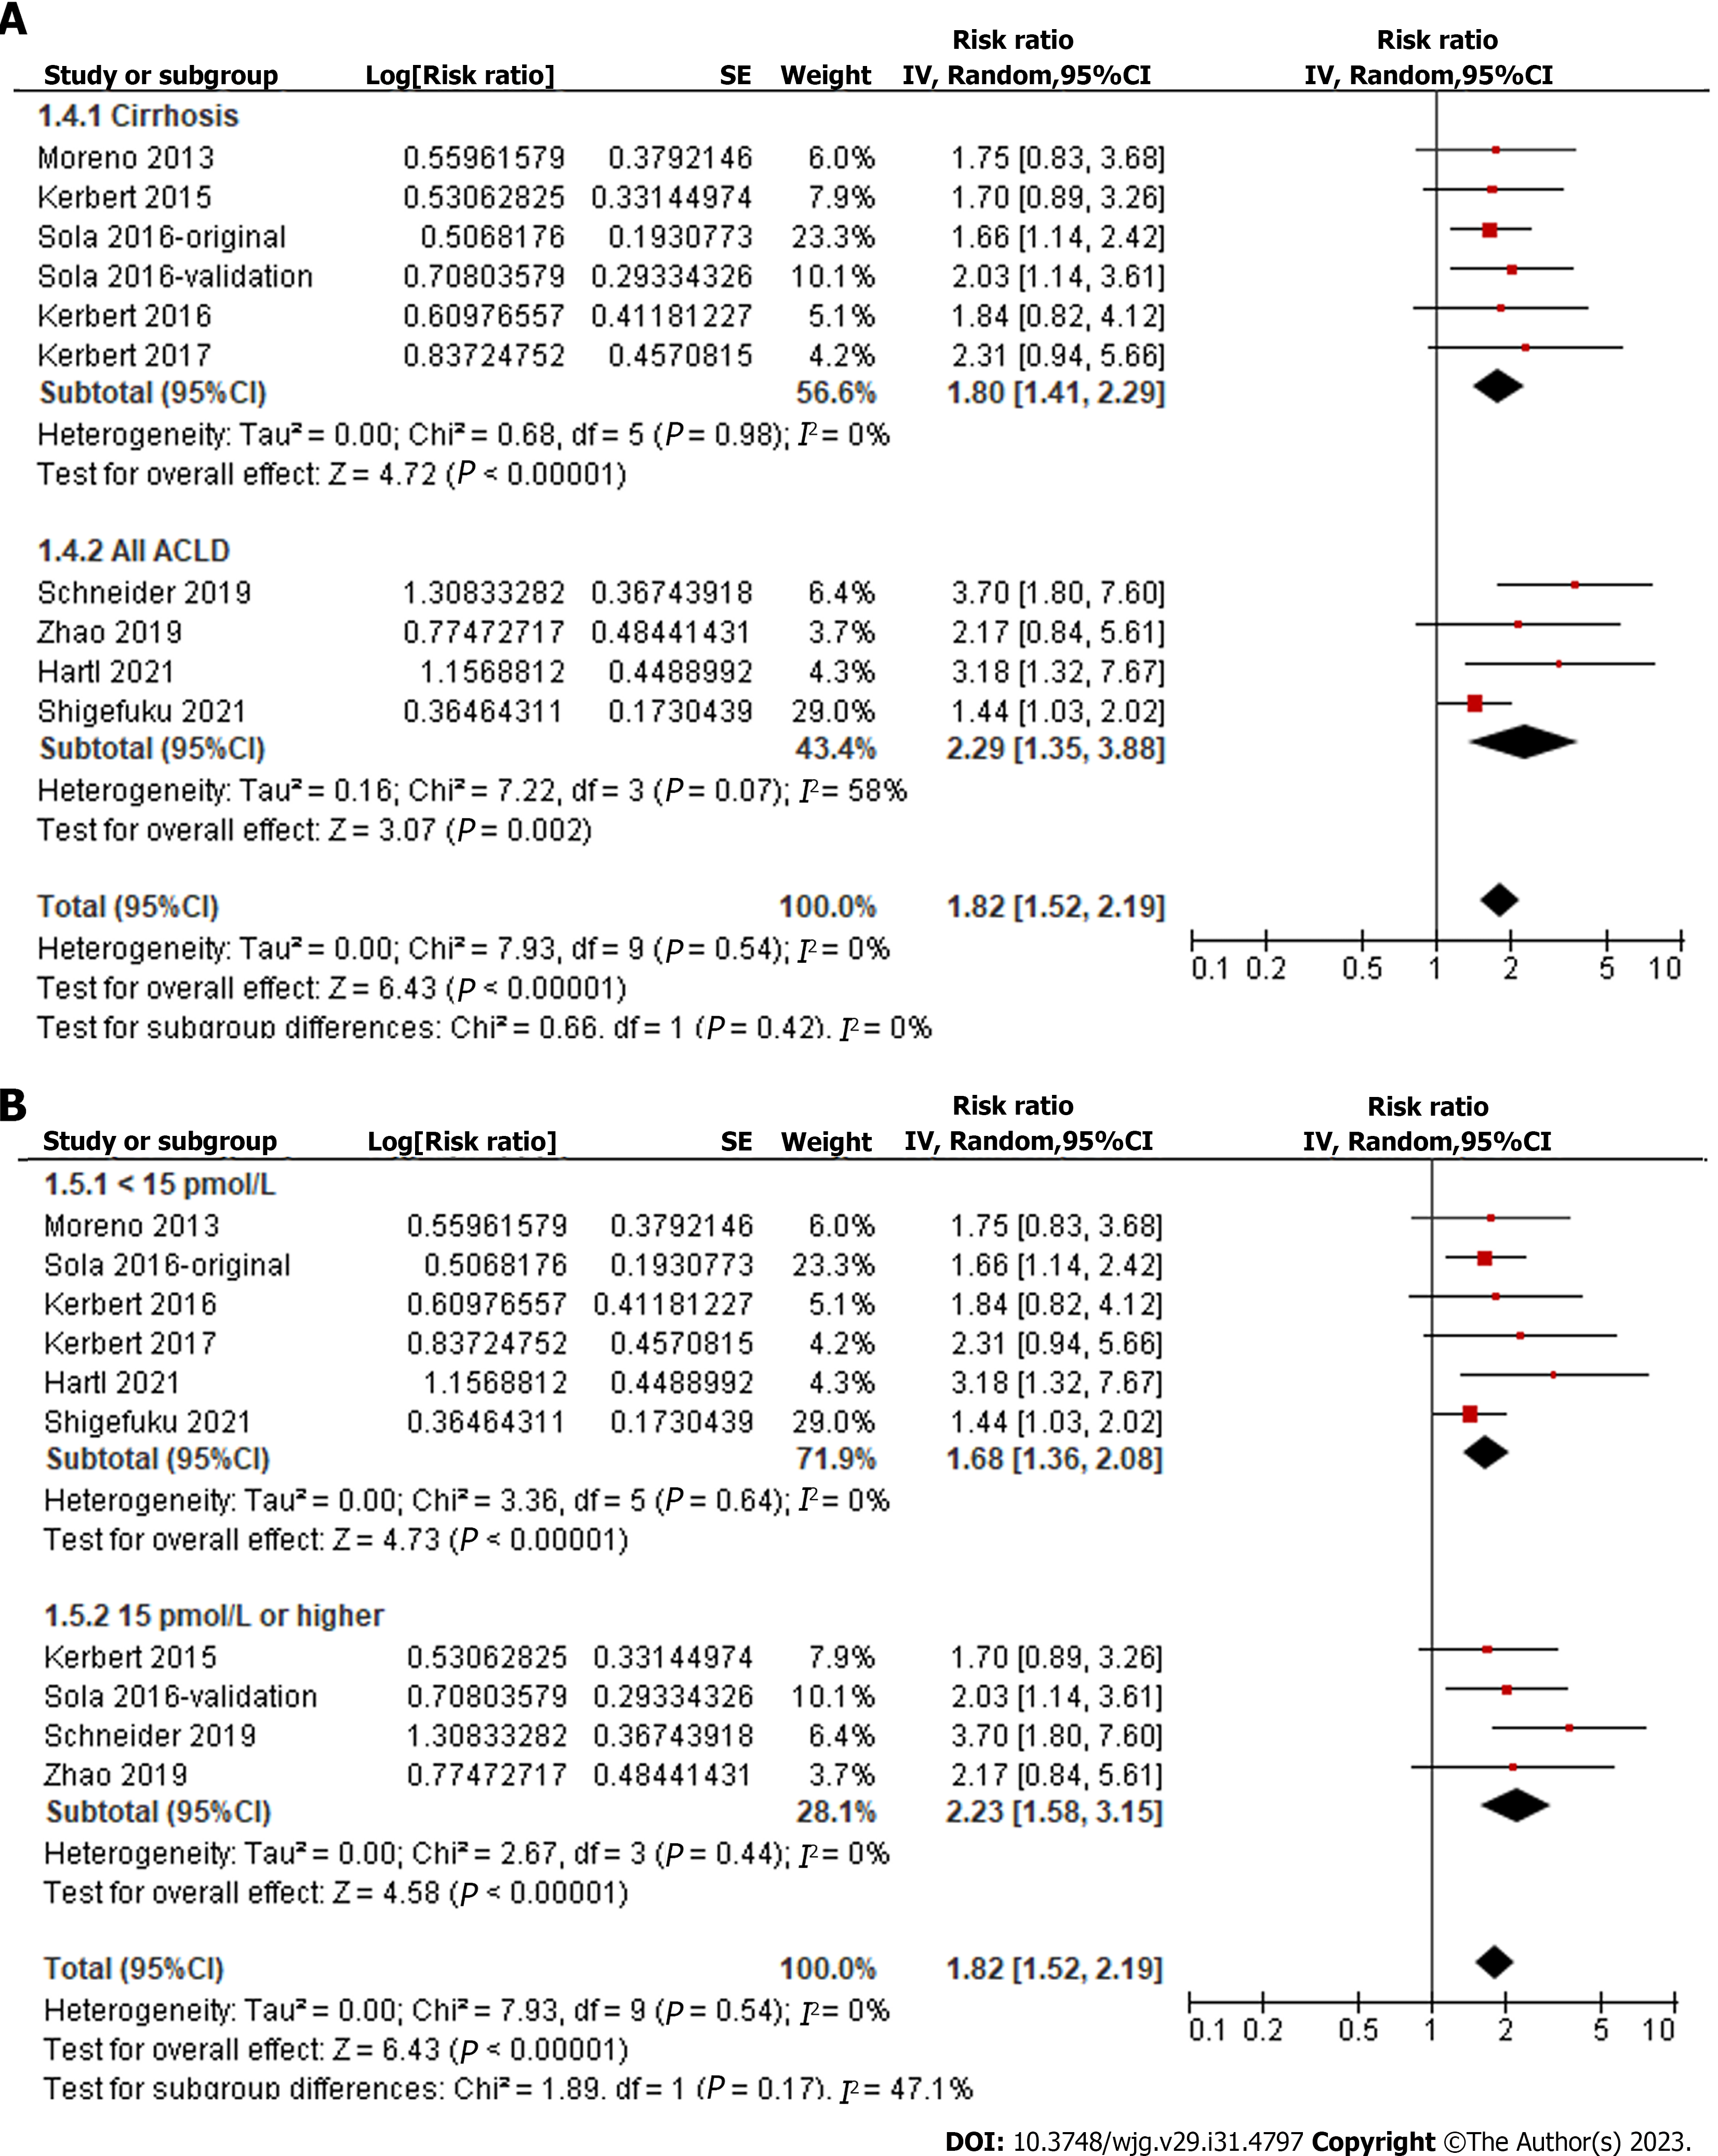
Figure 4 Forest plots for the subgroup analyses regarding the association between serum copeptin and transplant-free survival of patients with chronic liver diseases.
A: Subgroup analysis according to the diagnosis of the patients; B: Subgroup analysis according to the cutoffs of serum copeptin. 95%CI: 95% confidence interval.
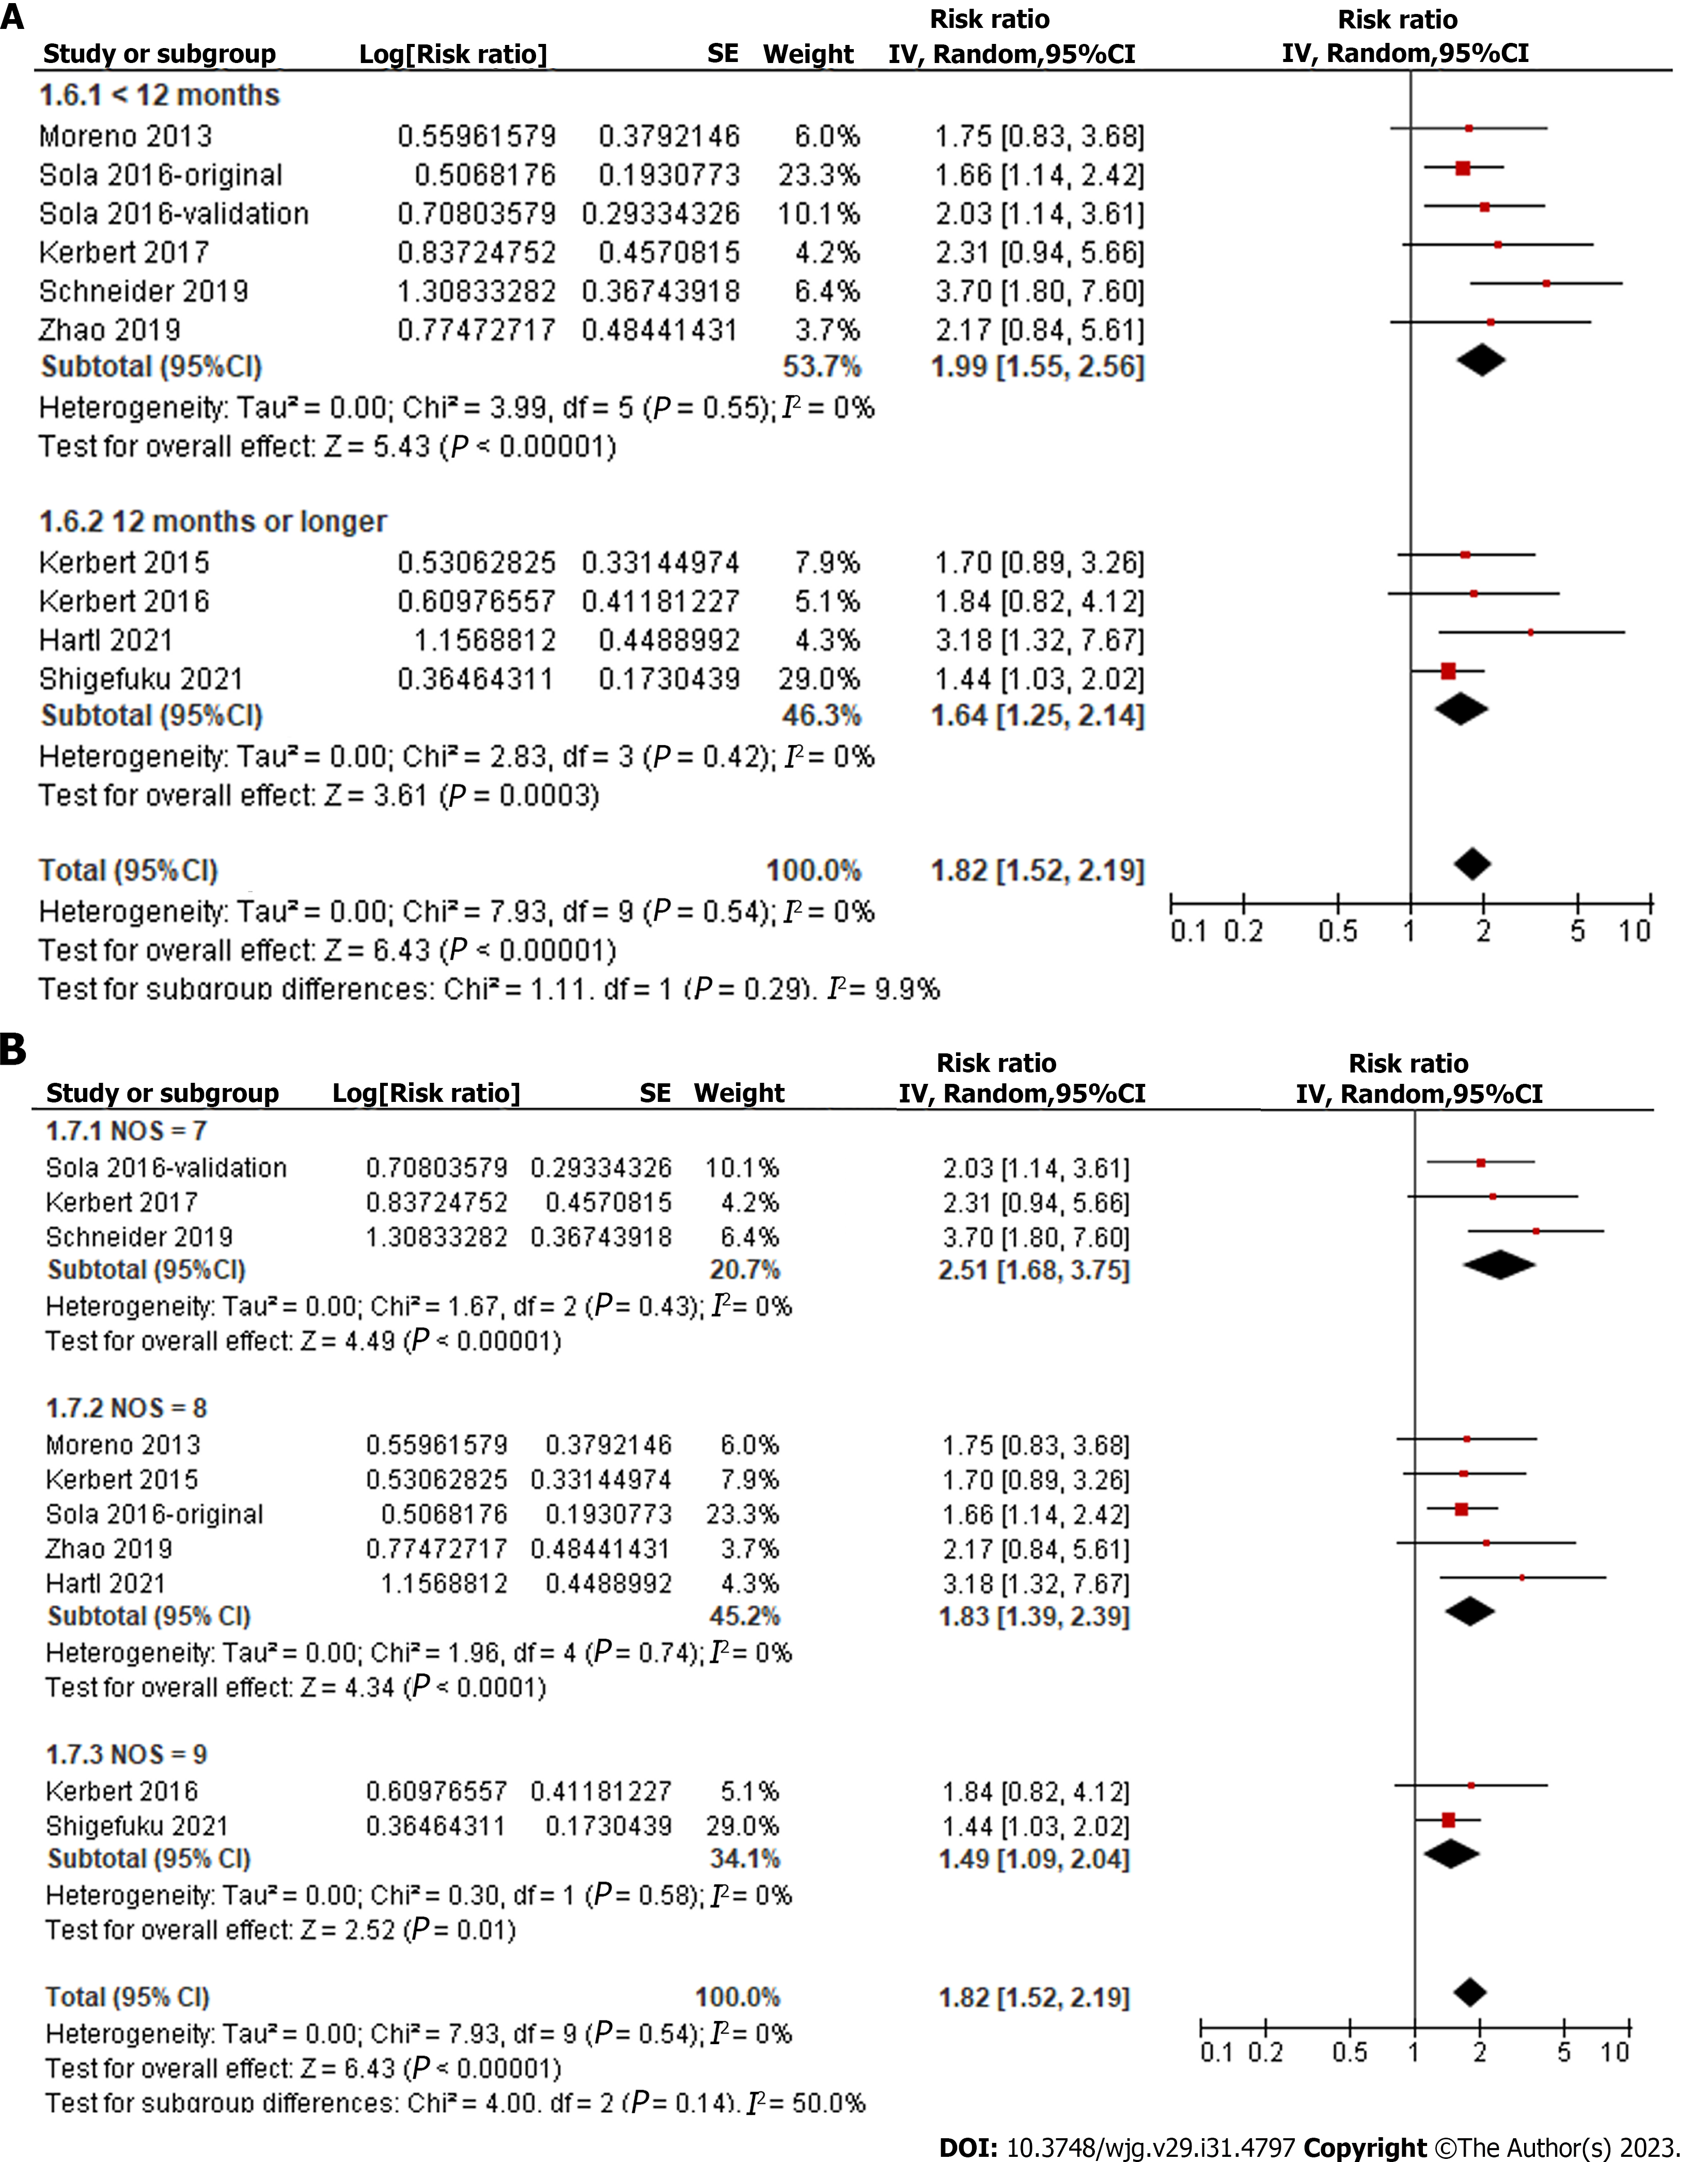
Figure 5 Forest plots for the subgroup analyses regarding the association between serum copeptin and transplant-free survival of patients with chronic liver diseases.
A: Subgroup analysis according to the follow-up durations; B: Subgroup analysis according to the study quality scores. 95%CI: 95% confidence interval.
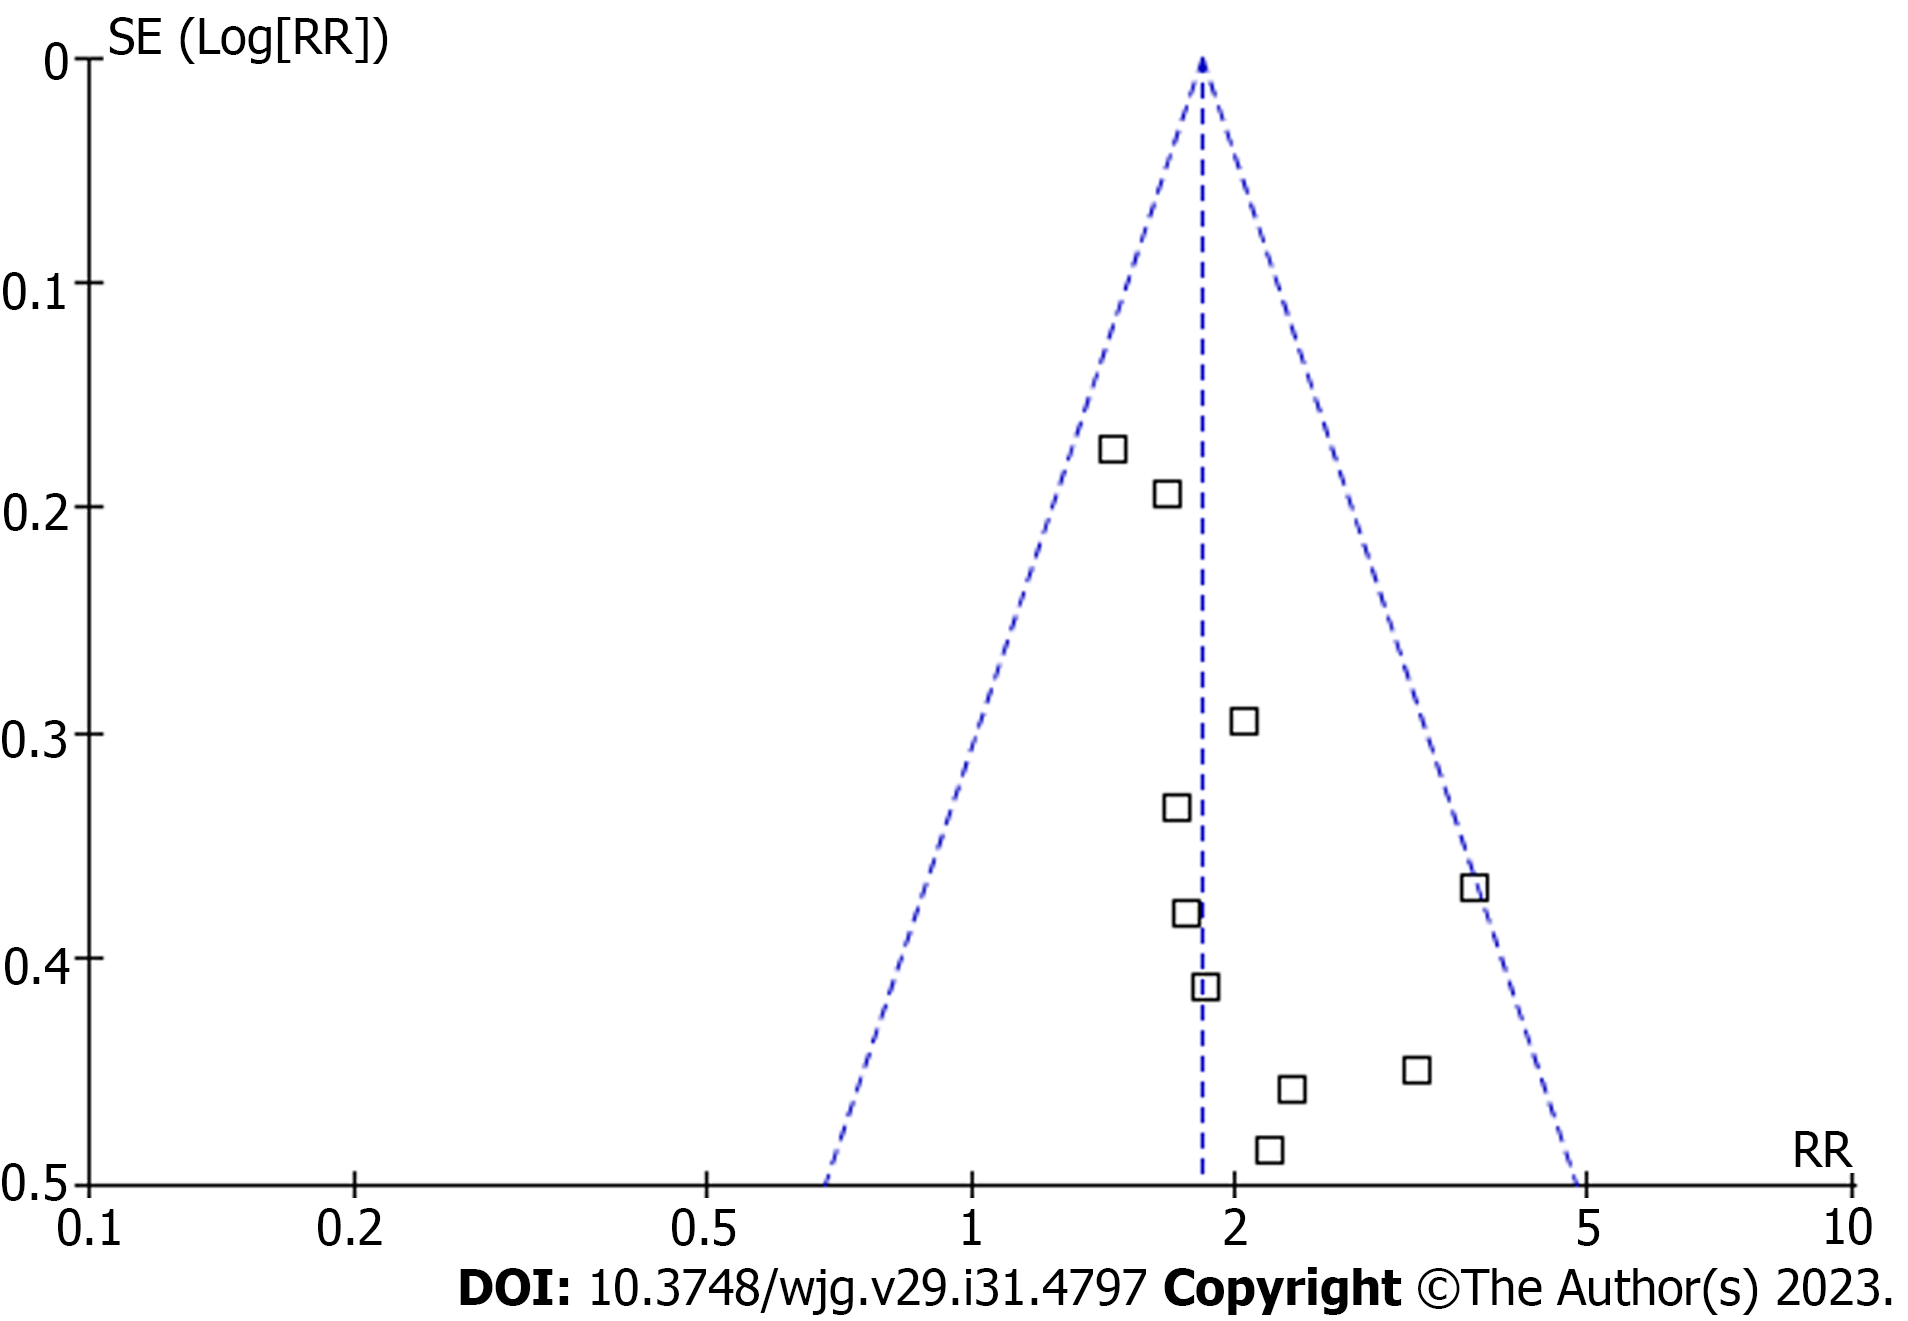
Figure 6 Funnel plots for the publication bias underlying the meta-analysis regarding the association between serum copeptin and transplant-free survival of patients with chronic liver diseases.
RR: Risk ratio.
- Citation: Tan HQ, Zhao M, Huang Z, Liu Y, Li H, Ma LH, Liu JY. Circulating copeptin level and the clinical prognosis of patients with chronic liver disease. World J Gastroenterol 2023; 29(31): 4797-4808
- URL: https://www.wjgnet.com/1007-9327/full/v29/i31/4797.htm
- DOI: https://dx.doi.org/10.3748/wjg.v29.i31.4797


