Copyright
©The Author(s) 2023.
World J Gastroenterol. Aug 21, 2023; 29(31): 4744-4762
Published online Aug 21, 2023. doi: 10.3748/wjg.v29.i31.4744
Published online Aug 21, 2023. doi: 10.3748/wjg.v29.i31.4744
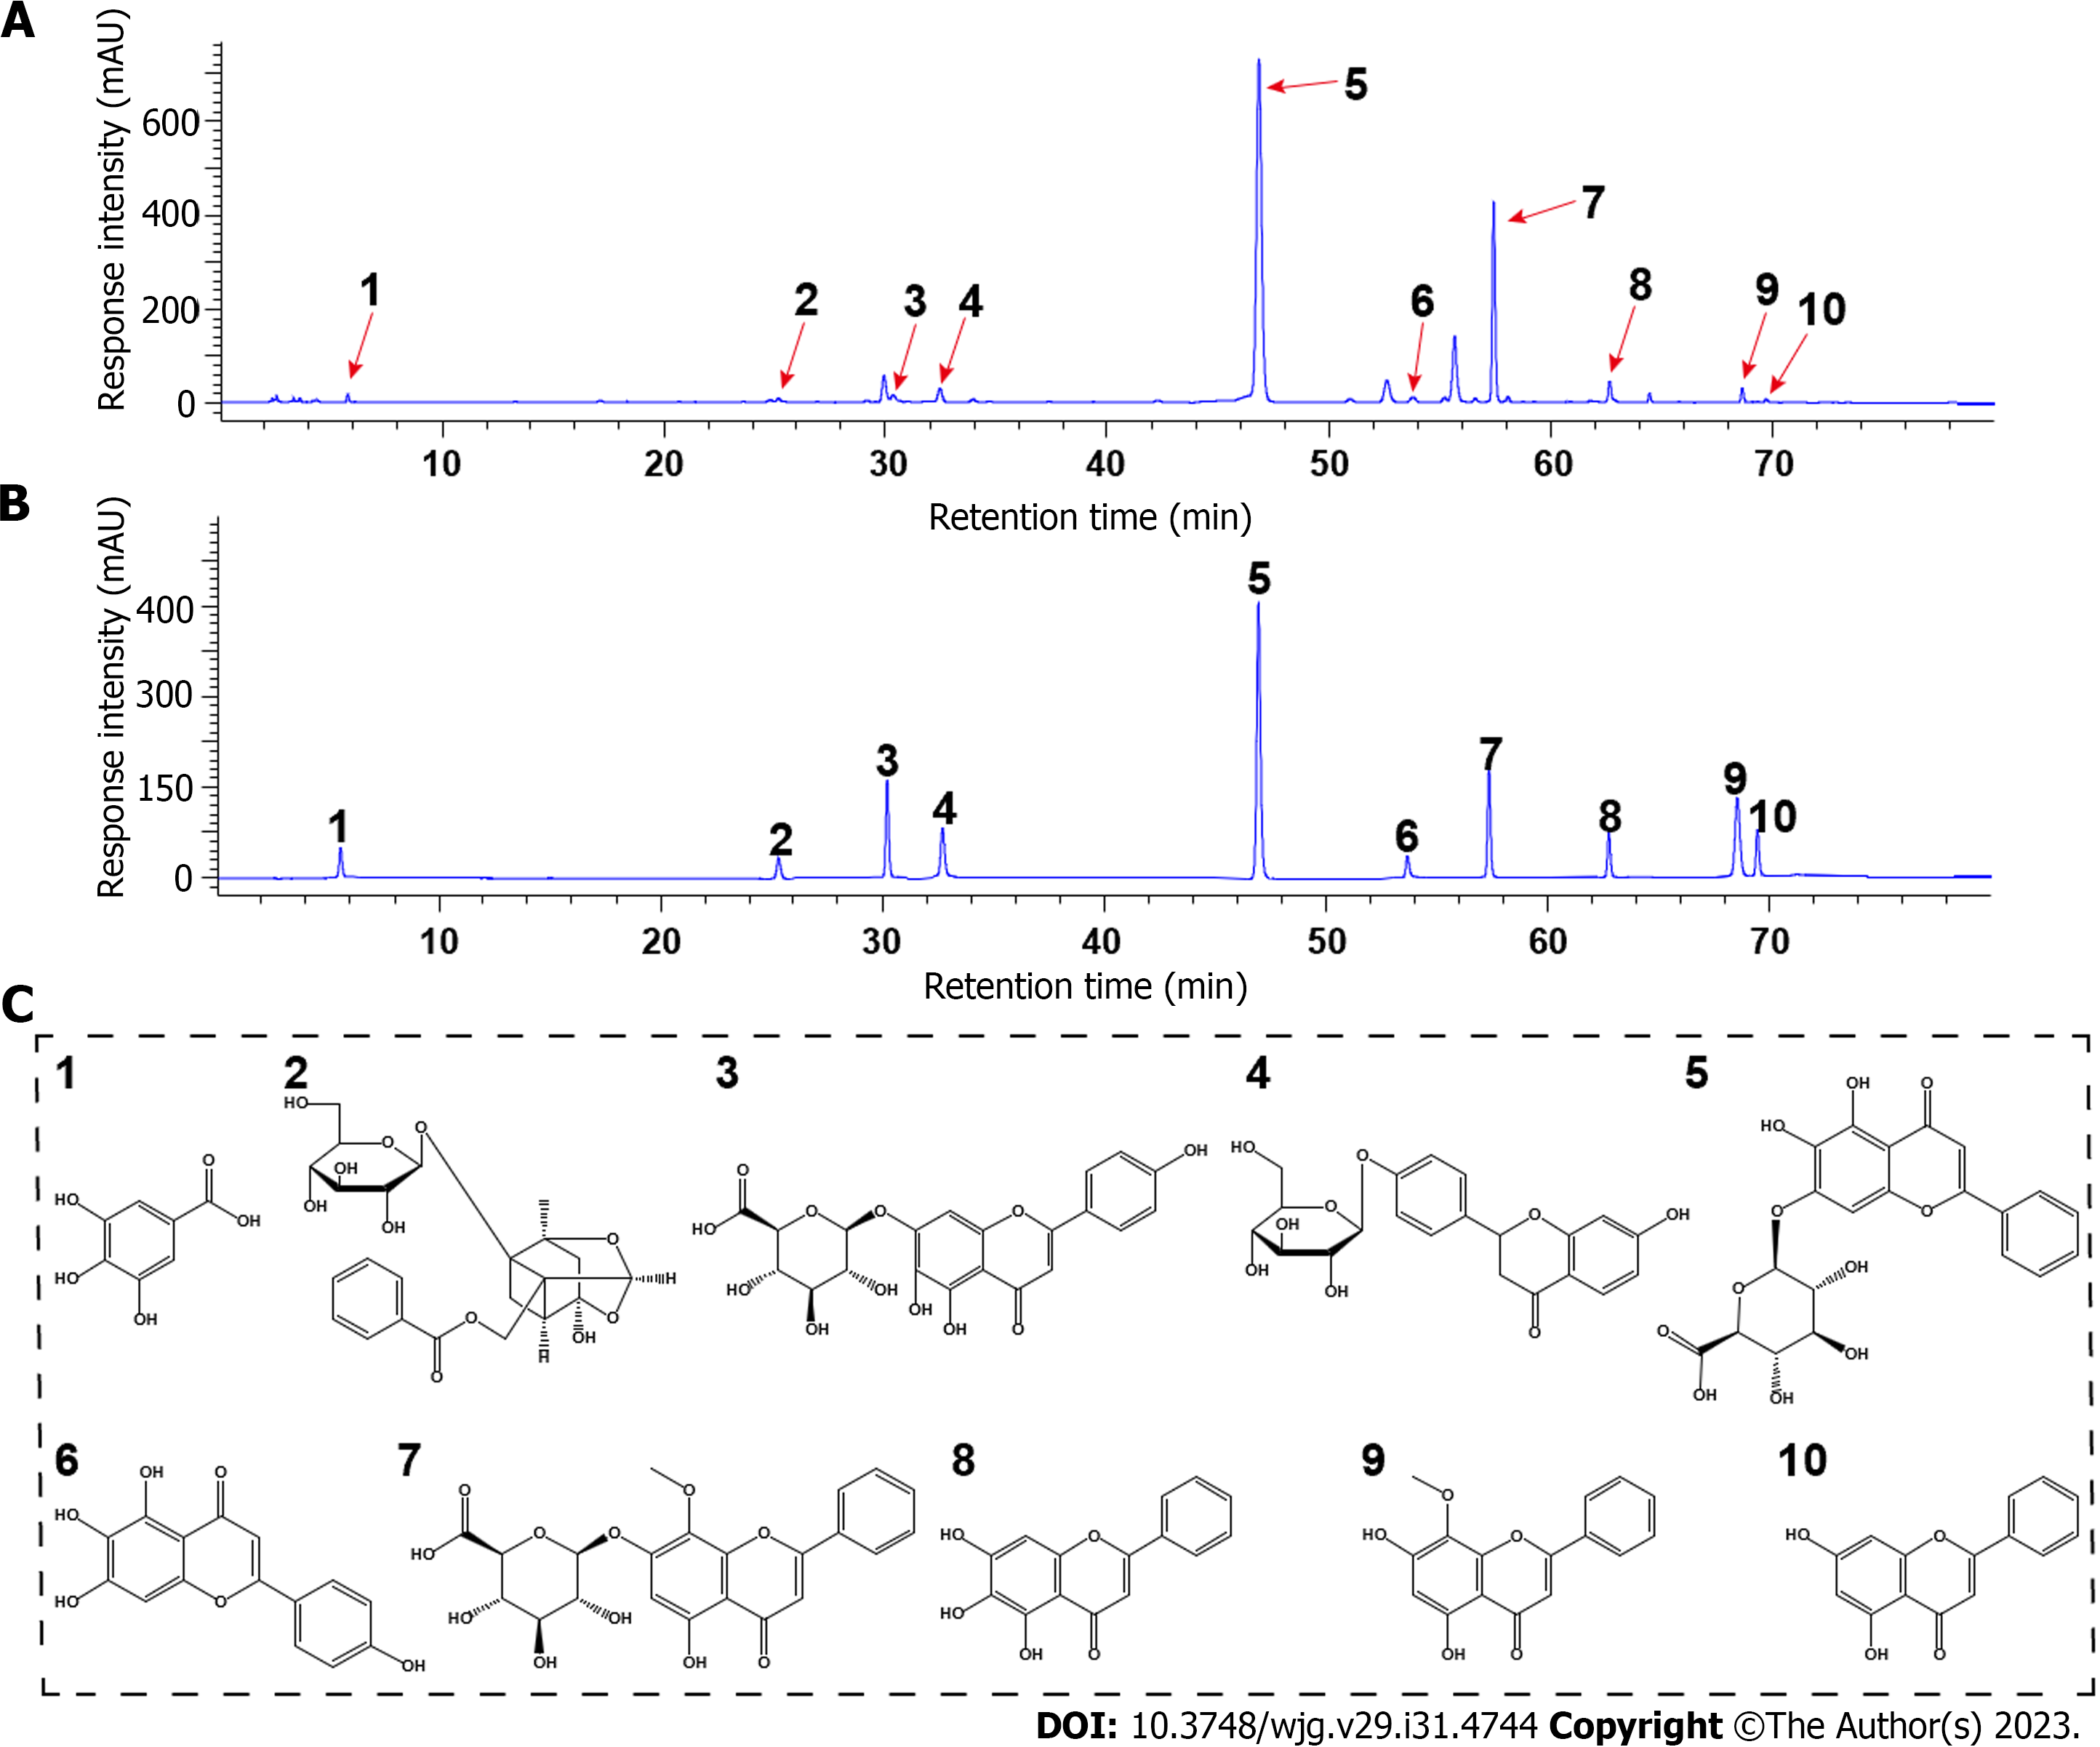
Figure 1 High-performance liquid chromatography fingerprint spectrum of Huangqin decoction and structures of the major phytochemicals in Huangqin decoction.
A and B: High-performance liquid chromatography profiles of Huangqin decoction (HQD) and the standard mixture: (1) Gallic acid, (2) paeoniflorin, (3) scutellarin, (4) liquiritin, (5) baicalin, (6) scutellarein, (7) wogonoside, (8) baicalein, (9) wogonin, and (10) chrysin; C: Structures of the major phytochemicals in HQD.
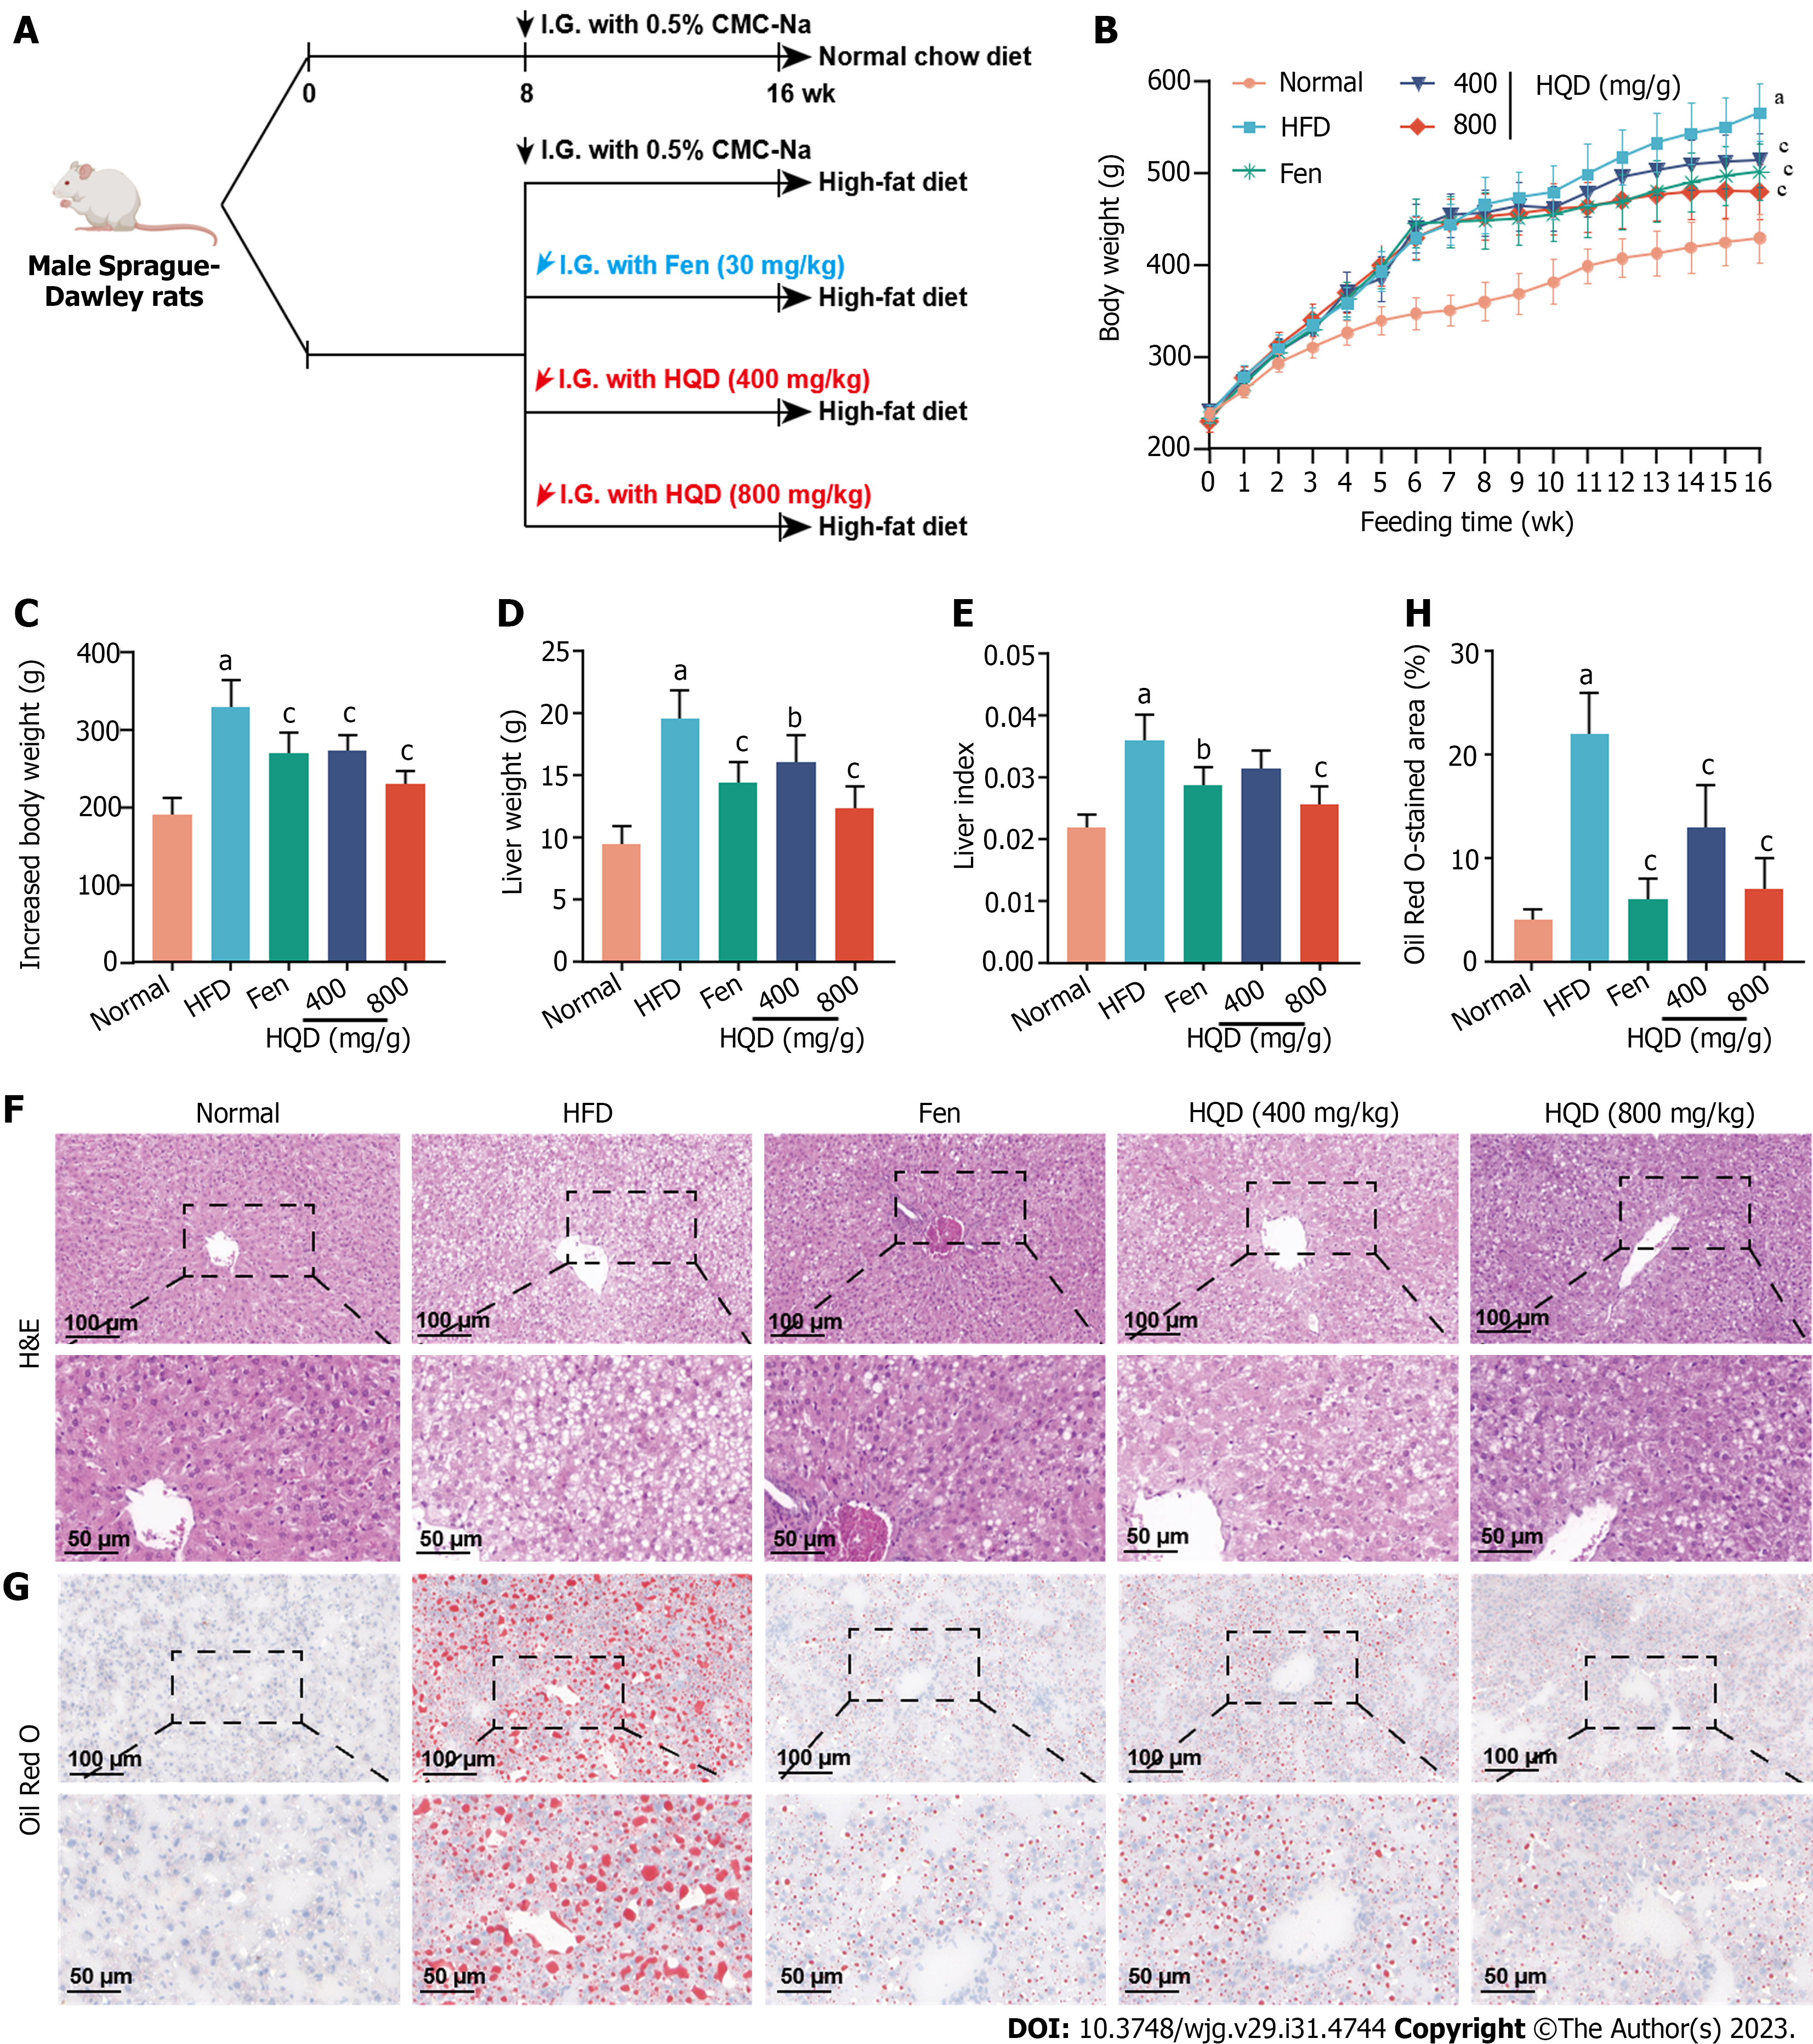
Figure 2 Huangqin decoction improves adiposity and hepatic histological abnormalities in high-fat diet-induced nonalcoholic fatty liver disease rats.
Data are presented as mean ± SD (n = 4–8). aP < 0.01 vs the normal group, bP < 0.05 and cP < 0.01 vs the high-fat diet group. A: Workflow of the experimental design; B: Dynamic curve of the body weight; C-E: Barcharts showing the effects of different treatments on body weight (C), liver weight at the termination of the experiment (D), and liver index (liver weight/body weight) (E) at the termination of the experiment; F and G: Representative micrographs of Hematoxylin and eosin and Oil Red O stained liver sections; H: Quantitative analysis of positive areas in Oil Red O staining. CMC-Na: Sodium carboxymethylcellulose; Fen: fenofibrate; HQD: Huangqin decoction; I.G.: Intragastric administration.
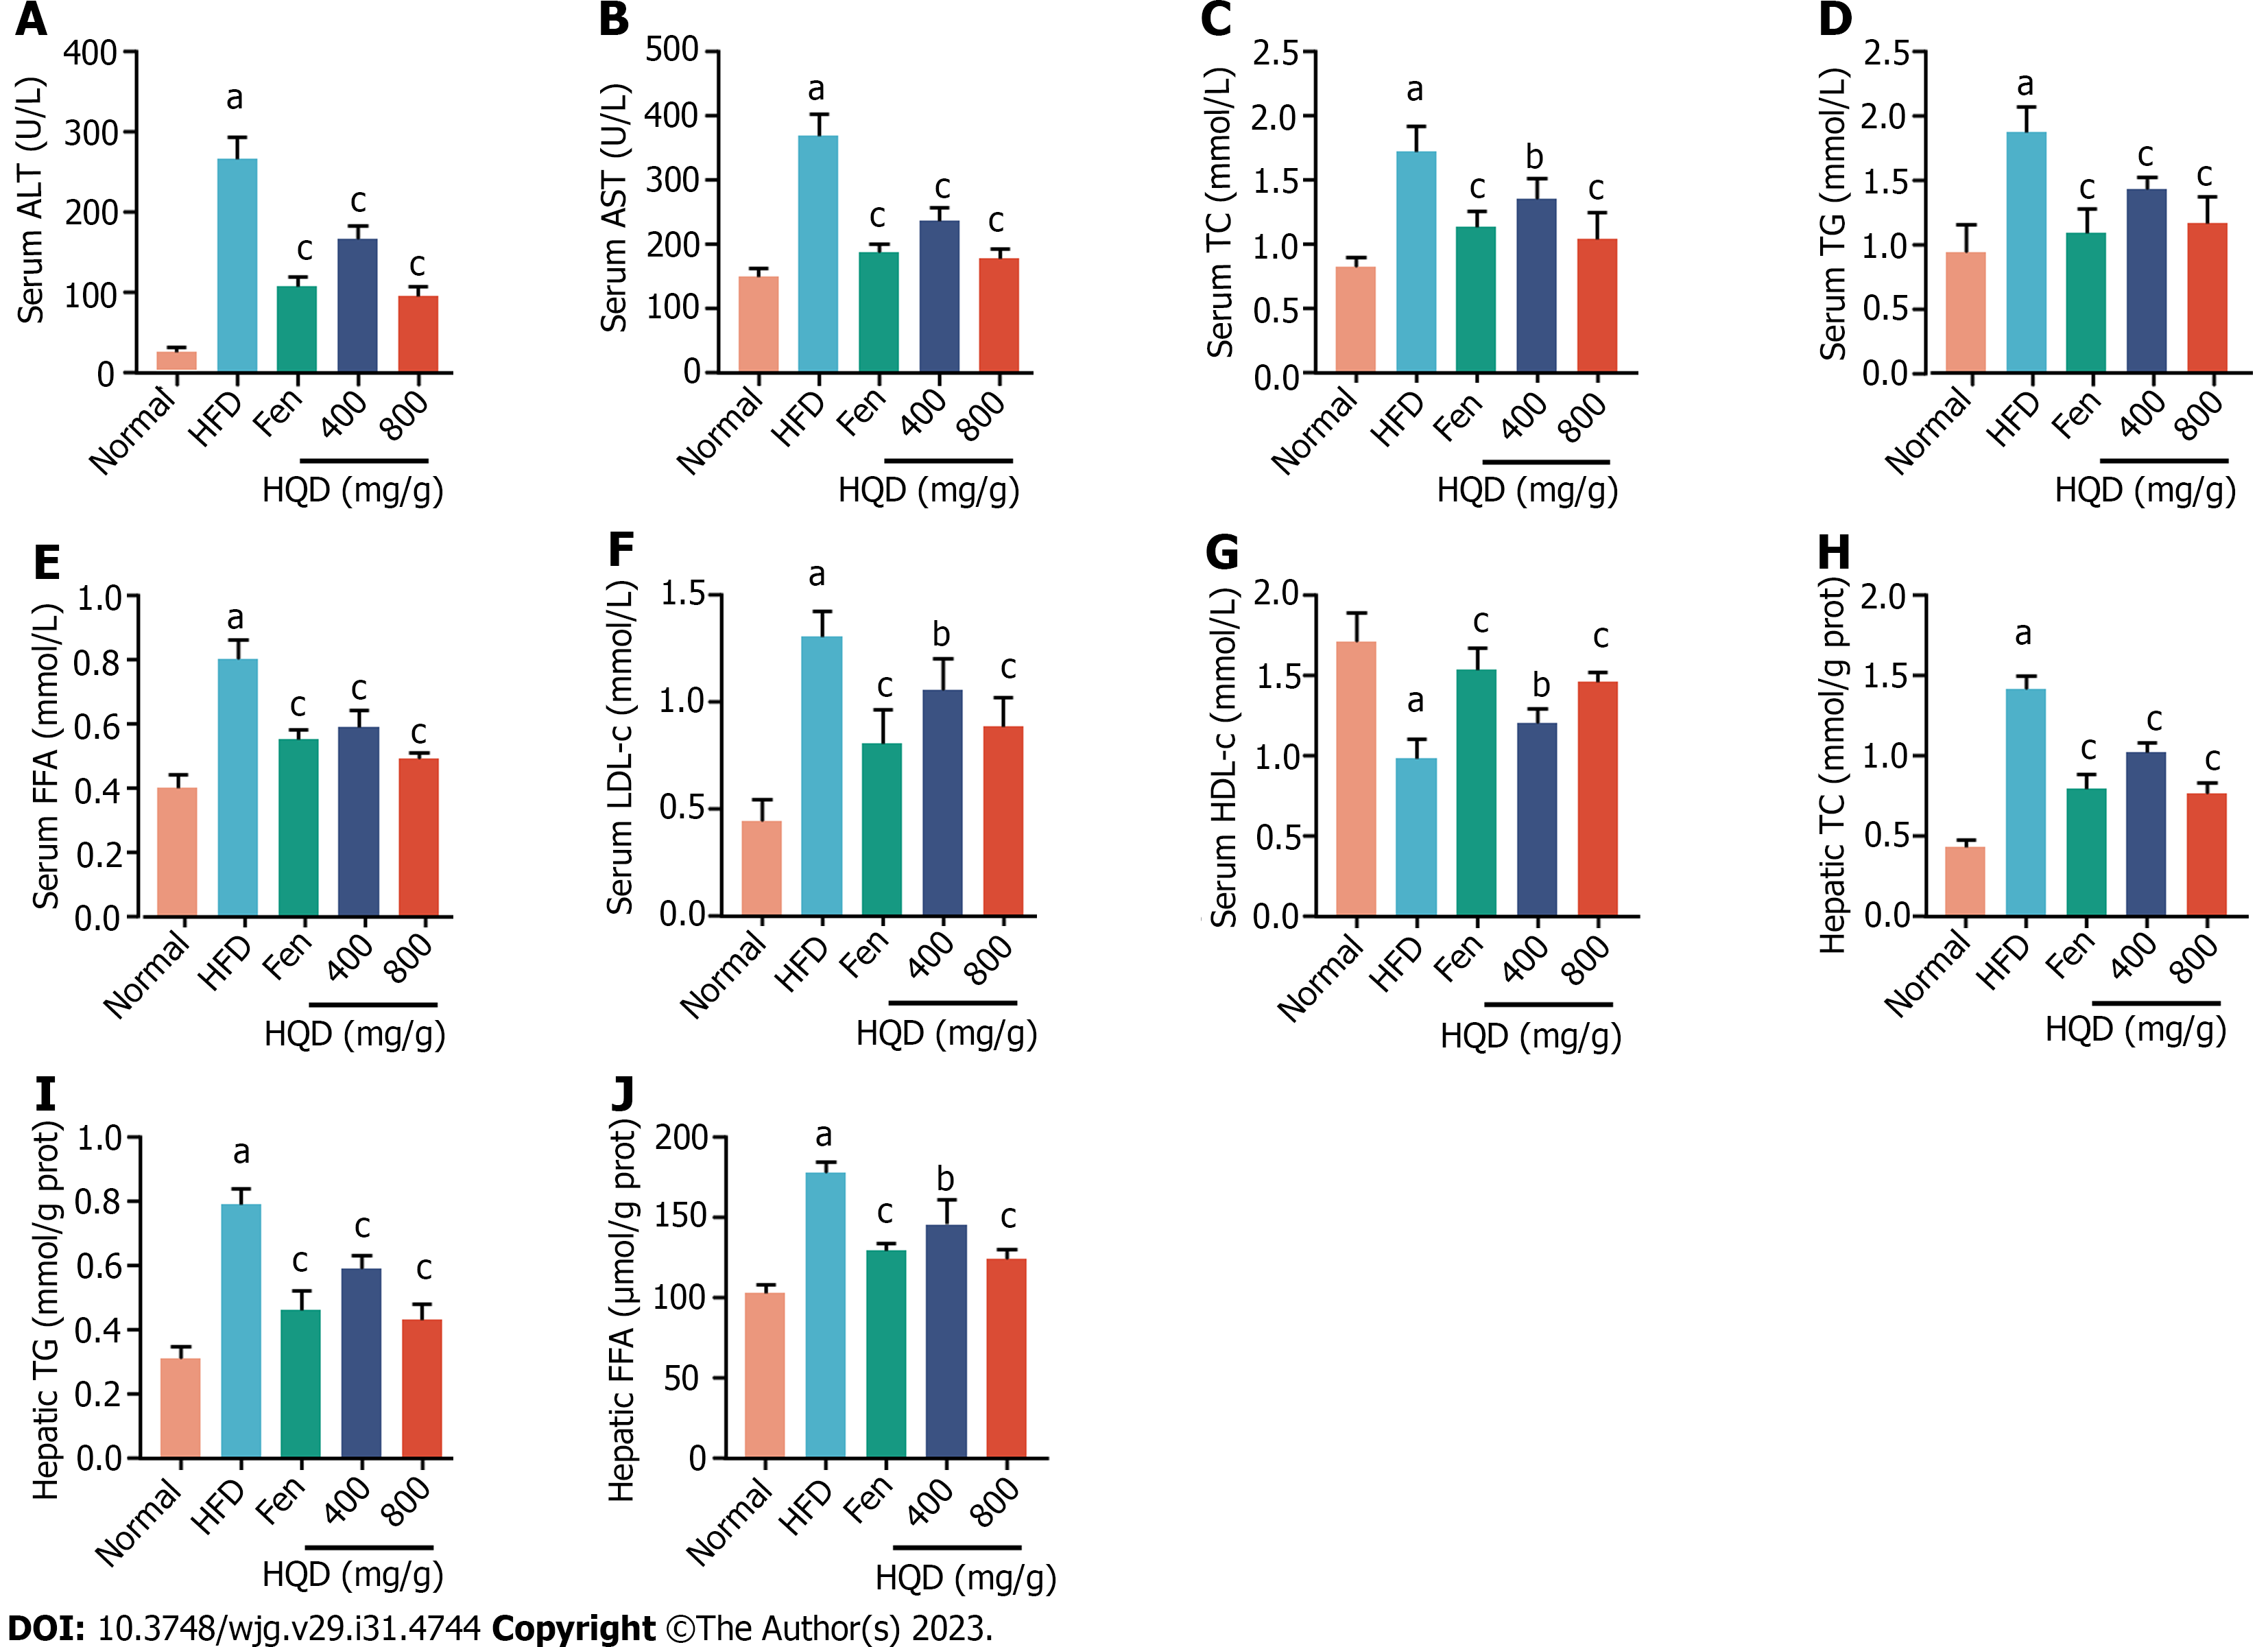
Figure 3 Huangqin decoction alleviates liver damage and lipid metabolism disorders in high-fat diet-induced nonalcoholic fatty liver disease rats.
Data are presented as mean ± SD (n = 8). aP < 0.01 vs the normal group, bP < 0.05 and cP < 0.01 vs high-fat diet group. A-J: Effects of different treatments on levels of alanine transaminase (A); aspartate transaminase (B); total cholesterol (TC) (C); triacylglycerol (TG) (D); free fatty acid (FFA) (E); low-density lipoprotein cholesterol (F); high-density lipoprotein cholesterol (G); TC (H); TG (I); FFA (J) levels in rats are shown. ALT: Alanine transaminase; AST: Aspartate transaminase; Fen: Fenofibrate; FFA: Free fatty acid; HDL-c: High-density lipoprotein cholesterol; HFD: High-fat diet; HQD: Huangqin decoction; LDL-c: Low-density lipoprotein cholesterol; TC: Total cholesterol; TG: Triacylglycerol.
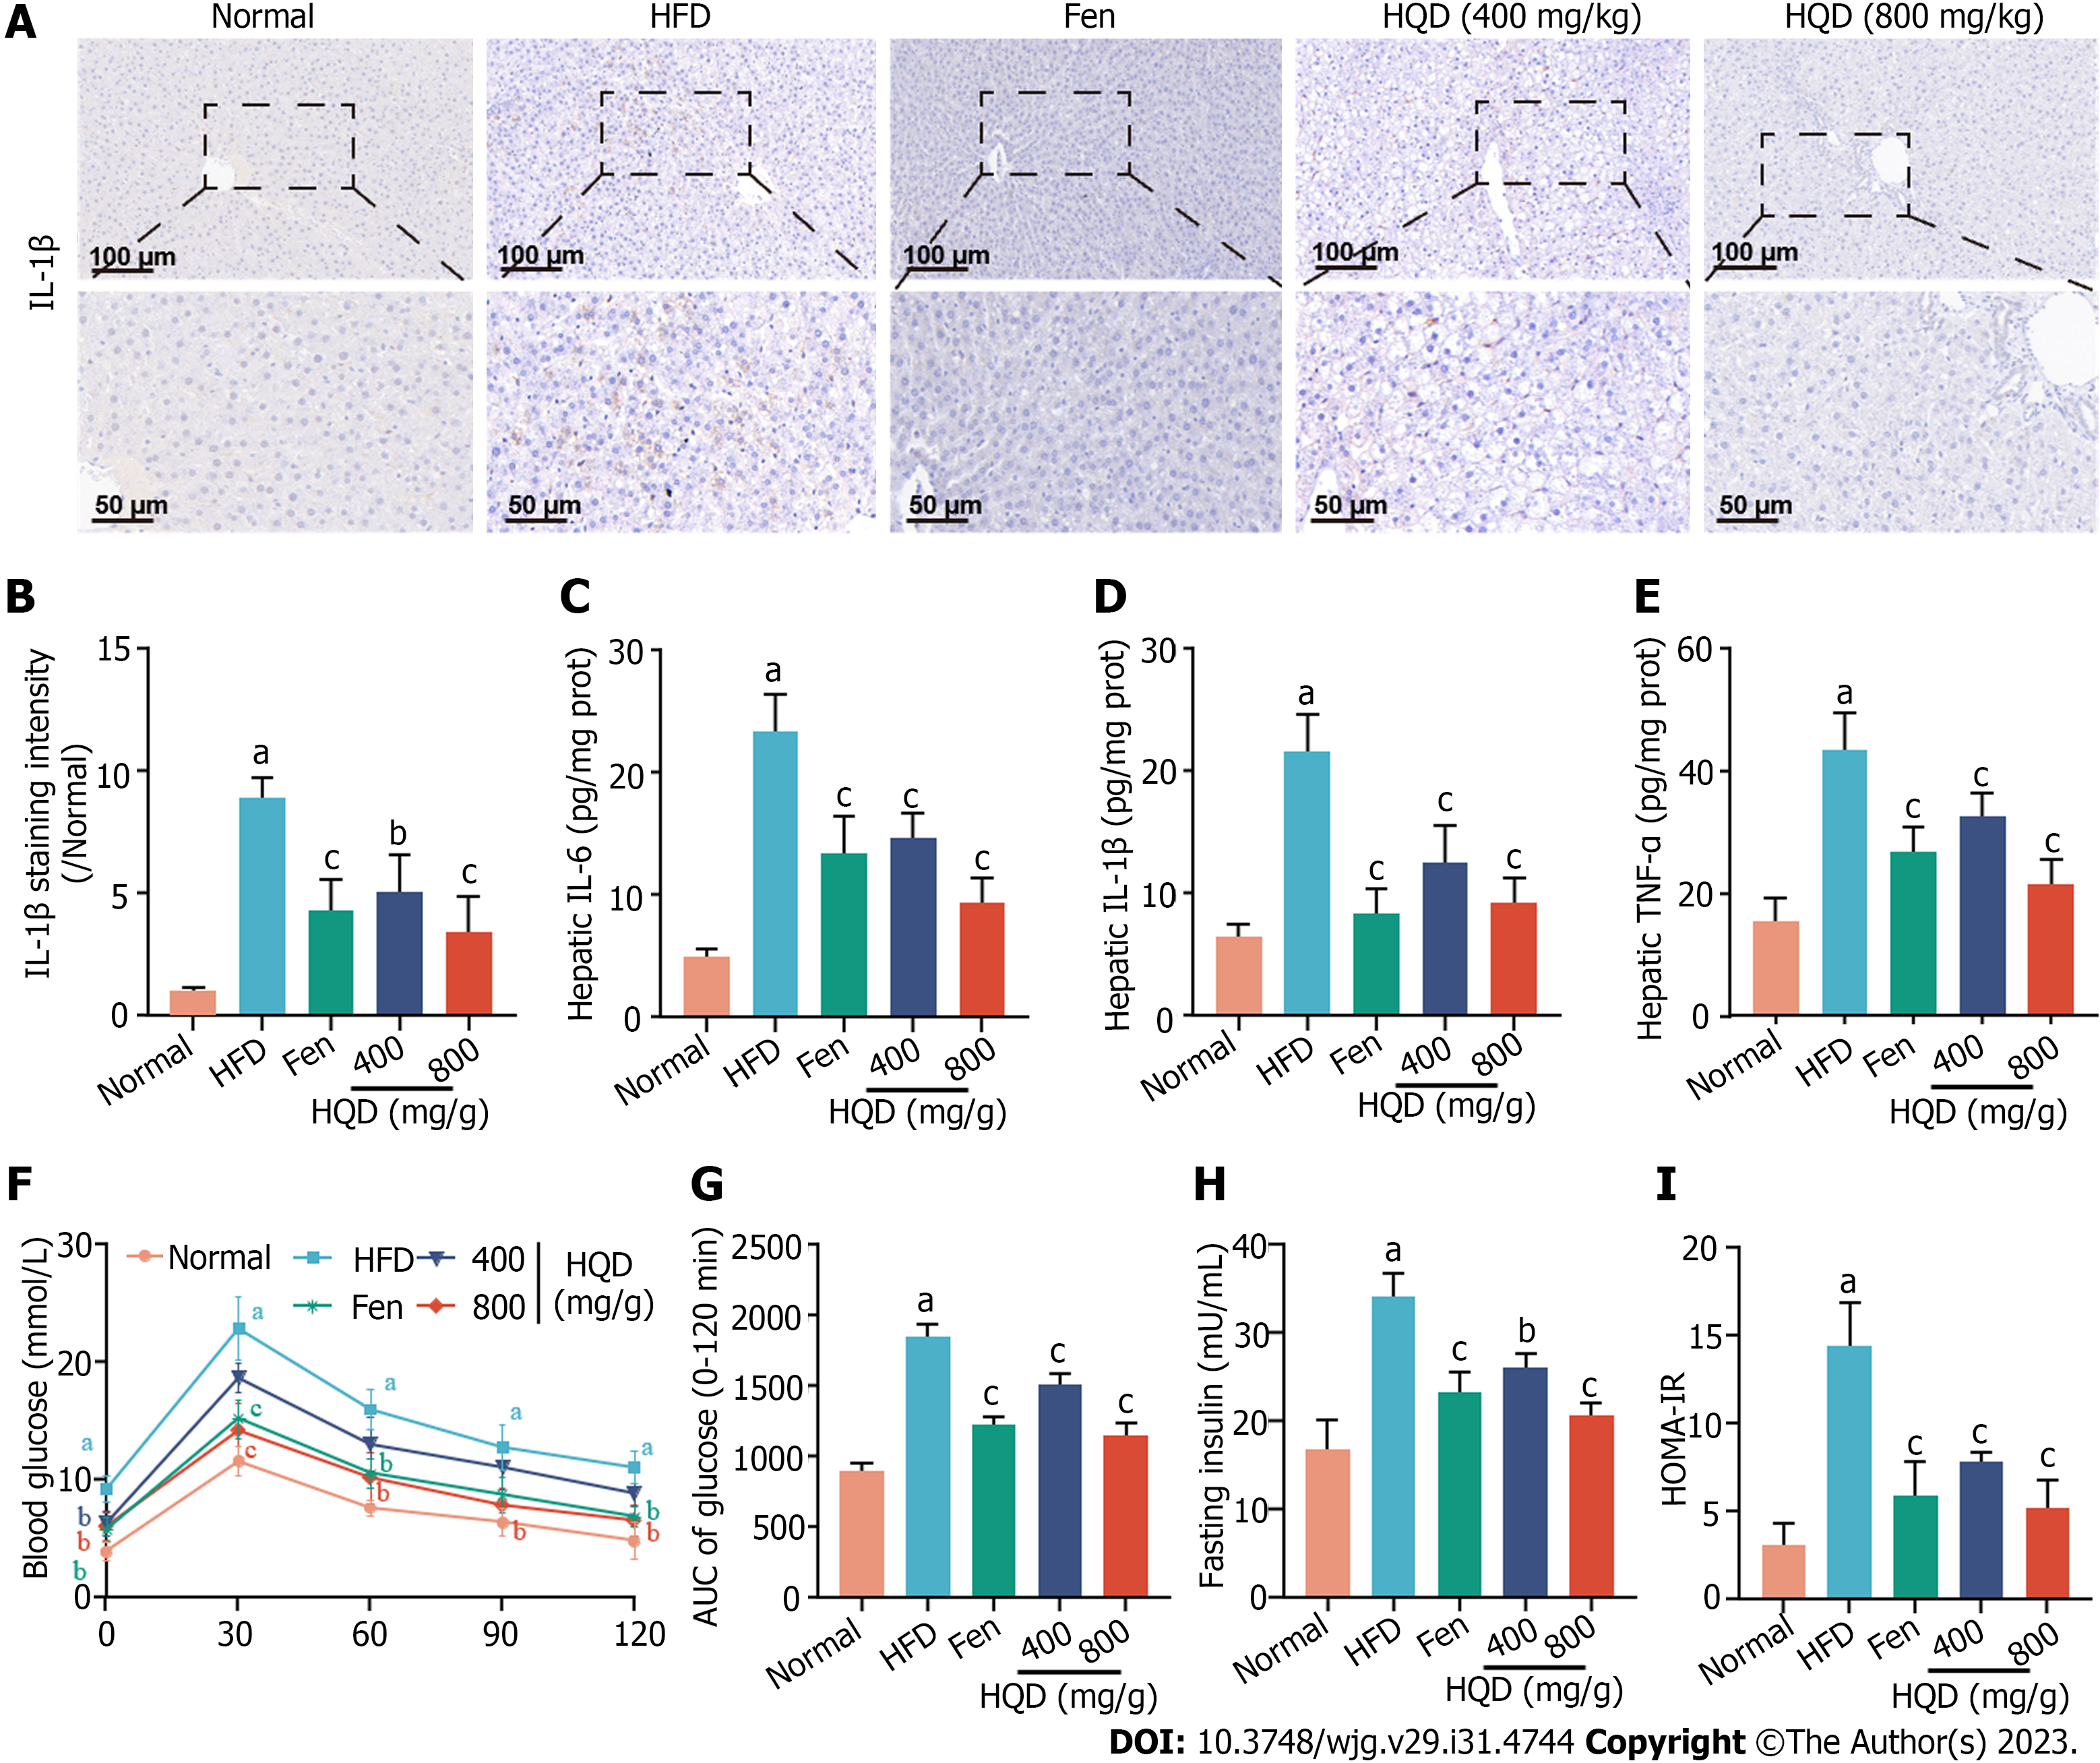
Figure 4 Huangqin decoction suppresses hepatic inflammation and insulin resistance in high-fat diet-induced nonalcoholic fatty liver disease rats.
Data are presented as mean ± SD (n = 4–8). aP < 0.01 vs the normal group, bP < 0.05 and cP < 0.01 vs the high-fat diet (HFD) group. A: Representative images of immunohistochemical staining of interleukin (IL)-1β in liver sections; B: Quantitative analysis of staining intensity of IL-1β; C-E: Levels of IL-6 (C), IL-1β (D), and tumor necrosis factor-α (E) in the liver of HFD-fed rats; F: Oral glucose tolerance test (OGTT); G: Area under the curve from OGTT; H: Level of fasting serum insulin; I: Values of homeostasis model assessment of insulin resistance. AUC: Area under the curve; Fen: Fenofibrate; HFD: High-fat diet; HOMA-IR: Homeostasis model assessment of insulin resistance; HQD: Huangqin decoction; IL: Interleukin; TNF: Tumor necrosis factor.
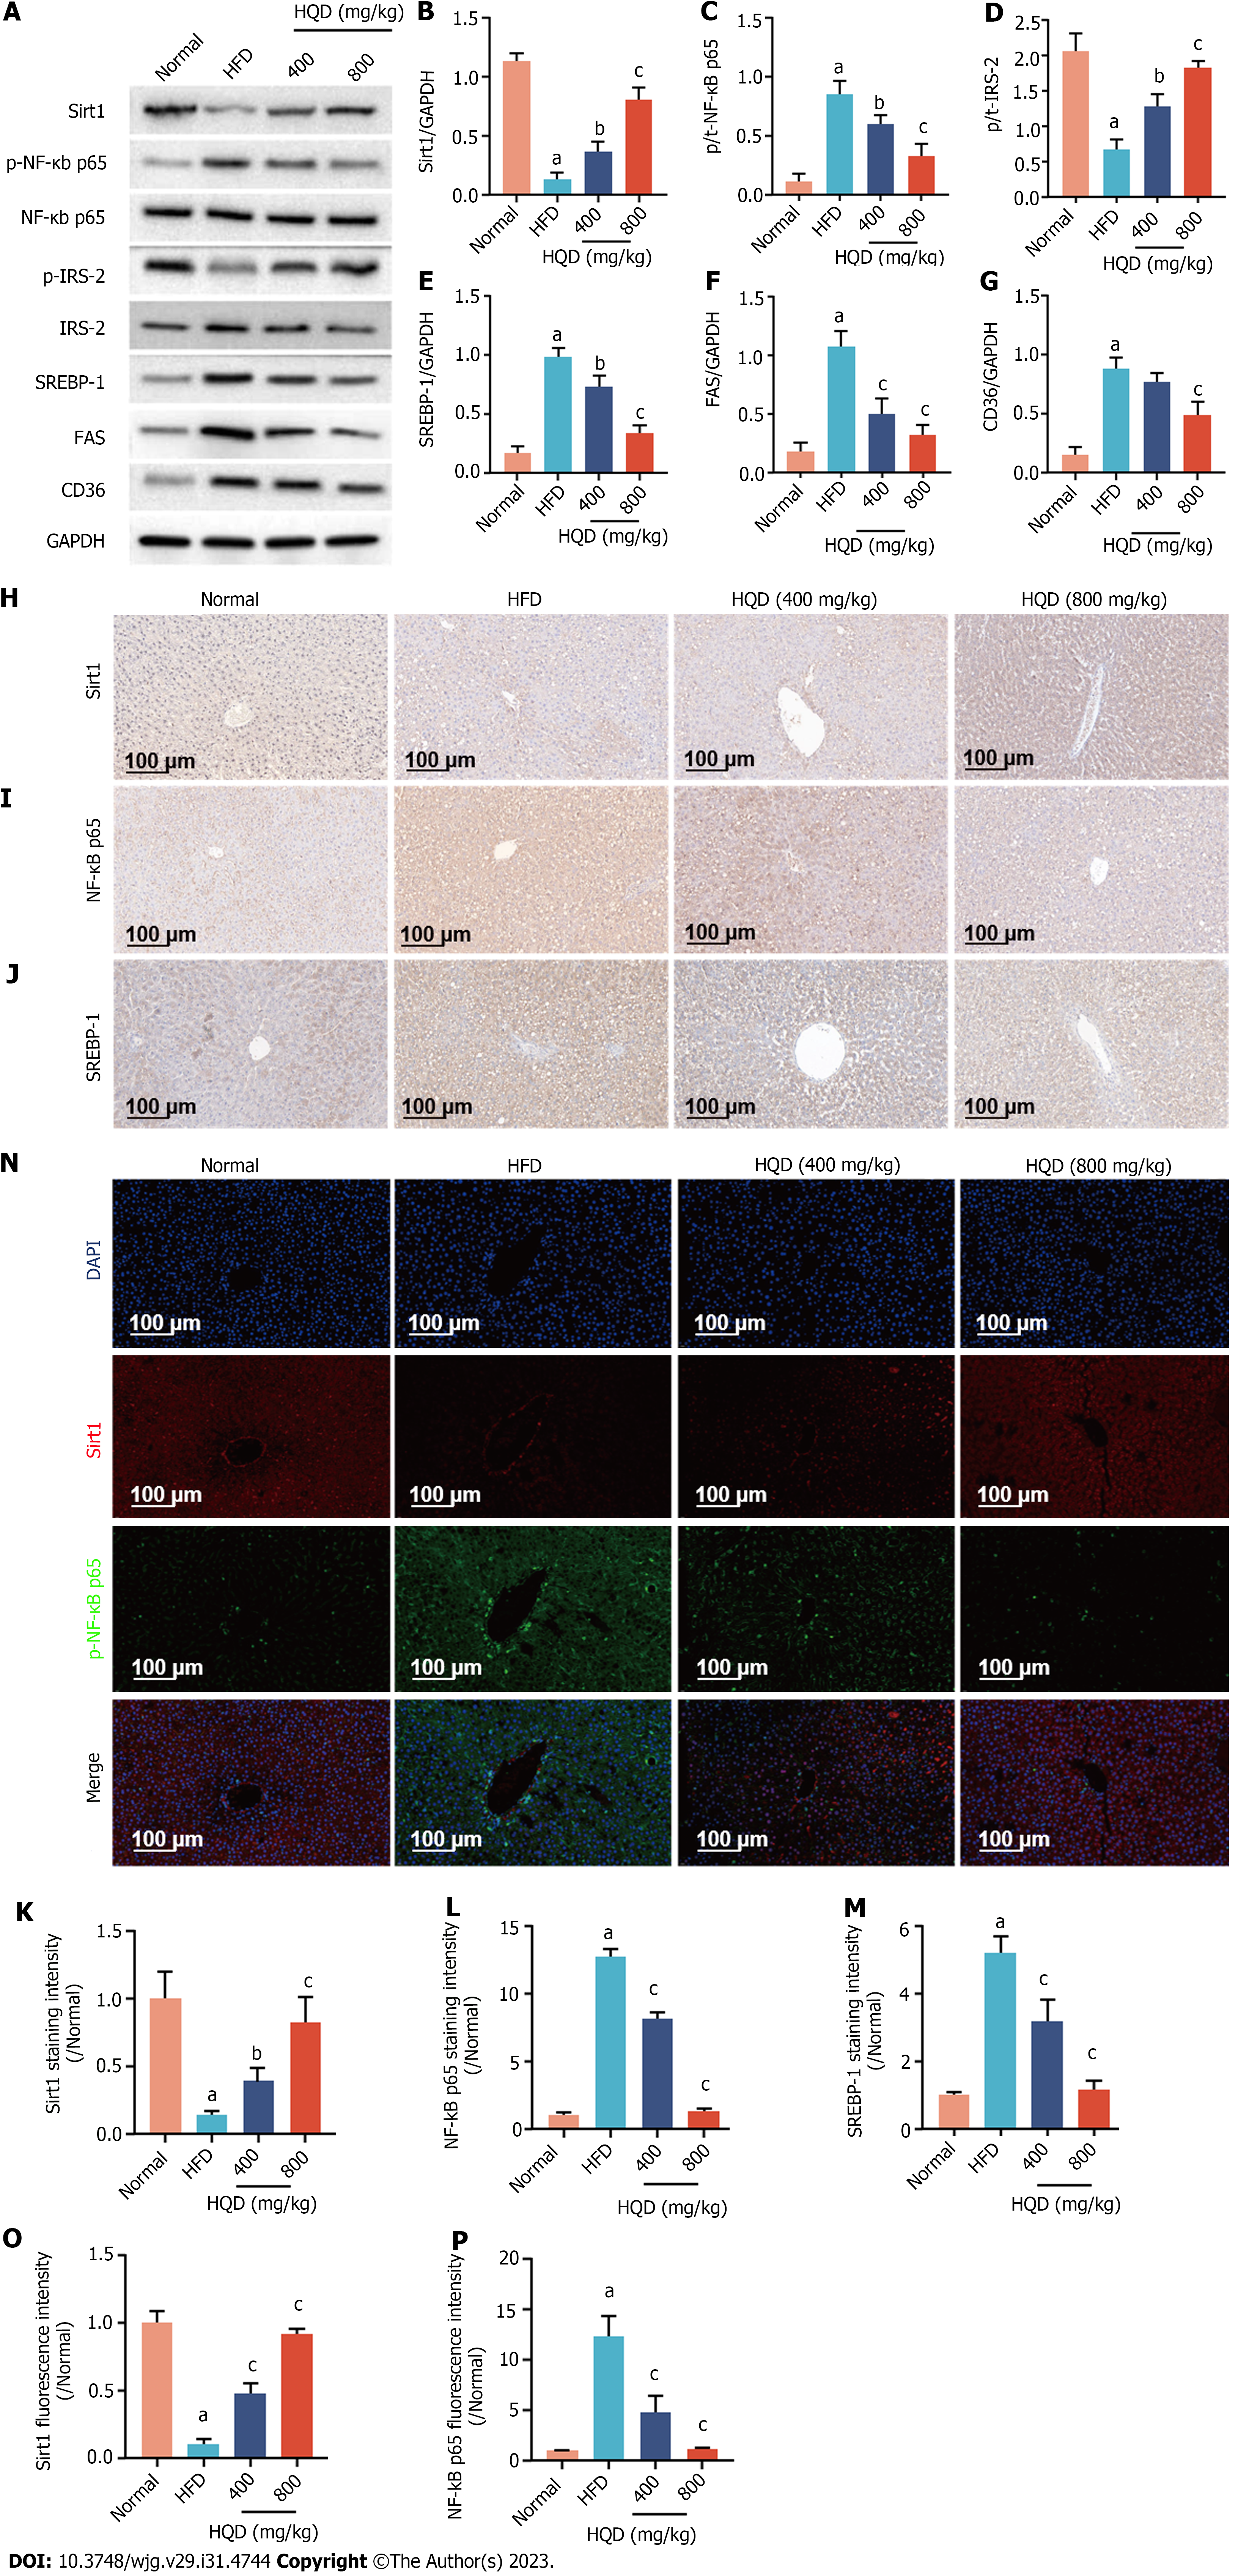
Figure 5 Huangqin decoction activates the Sirt1/NF-Κb pathway in high-fat diet-induced nonalcoholic fatty liver disease rats.
Data are presented as mean ± SD (n = 3–4). aP < 0.01 vs the normal group, bP < 0.05 and cP < 0.01 vs the high-fat diet group. A: Expression levels of Sirt1, p-NF-κB/NF-κB, p-IRS-2/IRS-2, sterol regulatory element-binding protein (SREBP)-1c, fatty acid synthase, and cluster of differentiation 36; B-G: Semi-quantitative analysis of these proteins; H-J: Representative images of immunohistochemical staining of Sirt1 (H), NF-κB (I), and SREBP-1c (J) in liver sections; K-M: Quantitative analysis of the staining intensity; N: Representative images of immunofluorescent staining of Sirt1 and NF-κB in liver sections; O and P: Quantitative analysis of the fluorescence intensity. CD36: Cluster of differentiation 36; DAPI: 4',6-diamidino-2-phenylindole; FAS: Fatty acid synthase; GAPDH: Glyceraldehyde-3-phosphate dehydrogenase; HFD: High-fat diet; HQD, Huangqin decoction; SREBP: Sterol regulatory element-binding protein.
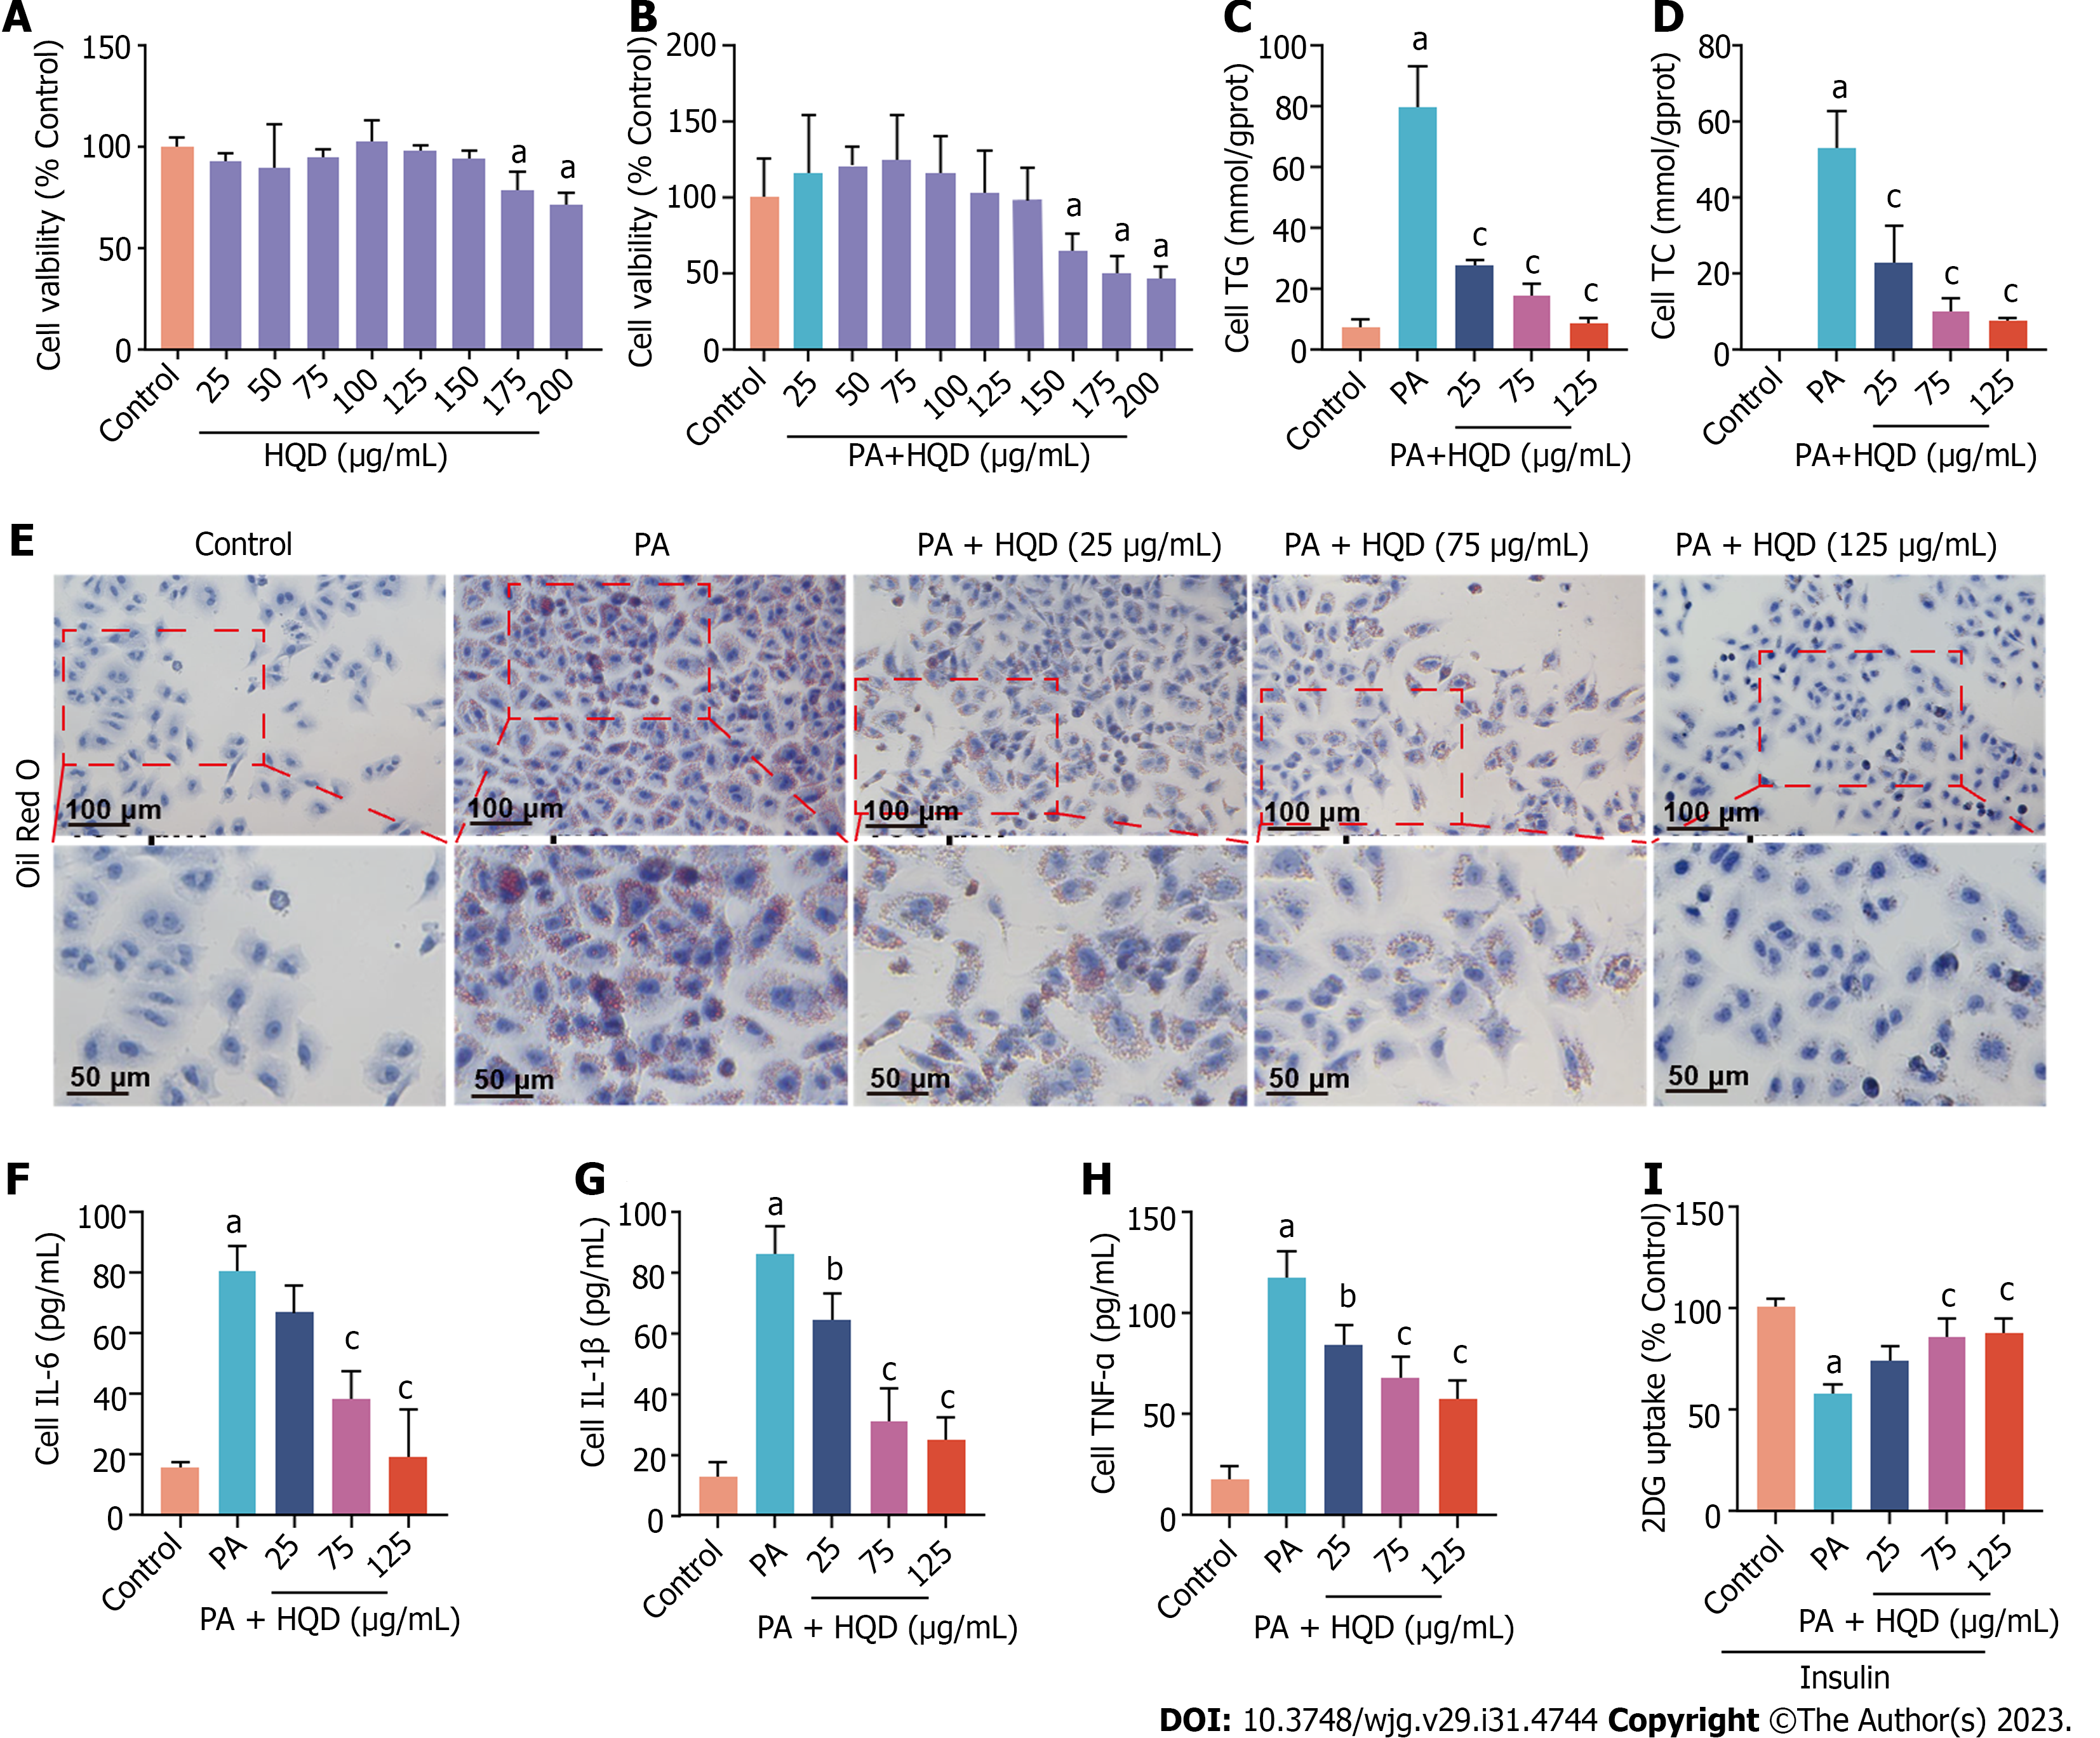
Figure 6 Huangqin decoction improves lipotoxicity, inflammation, and insulin resistance in palmitic acid-induced HepG2 cells.
Data are presented as mean ± SD of at least three independent experiments. aP < 0.01 vs the control group, bP < 0.05 and cP < 0.01 vs the palmitic acid (PA) group. A: Viability of HepG2 cells following incubation with different concentrations of Huangqin decoction (HQD); B: Viability of HepG2 cells following co-culture with PA and different concentrations of HQD; C and D: Levels of triacylglycerol and total cholesterol in HepG2 cells; E: Representative micrographs of Oil Red O staining of HepG2 cells; F–H: Levels of interleukin (IL)-6, IL-1β, and tumor necrosis factor-α in HepG2 cells; I: Level of glucose uptake in HepG2 cells. 2DG: 2-deoxydglucose; HQD, Huangqin decoction; IL: Interleukin; TC: Total cholesterol; TG: Triacylglycerol; TNF: Tumor necrosis factor; PA: Palmitic acid.
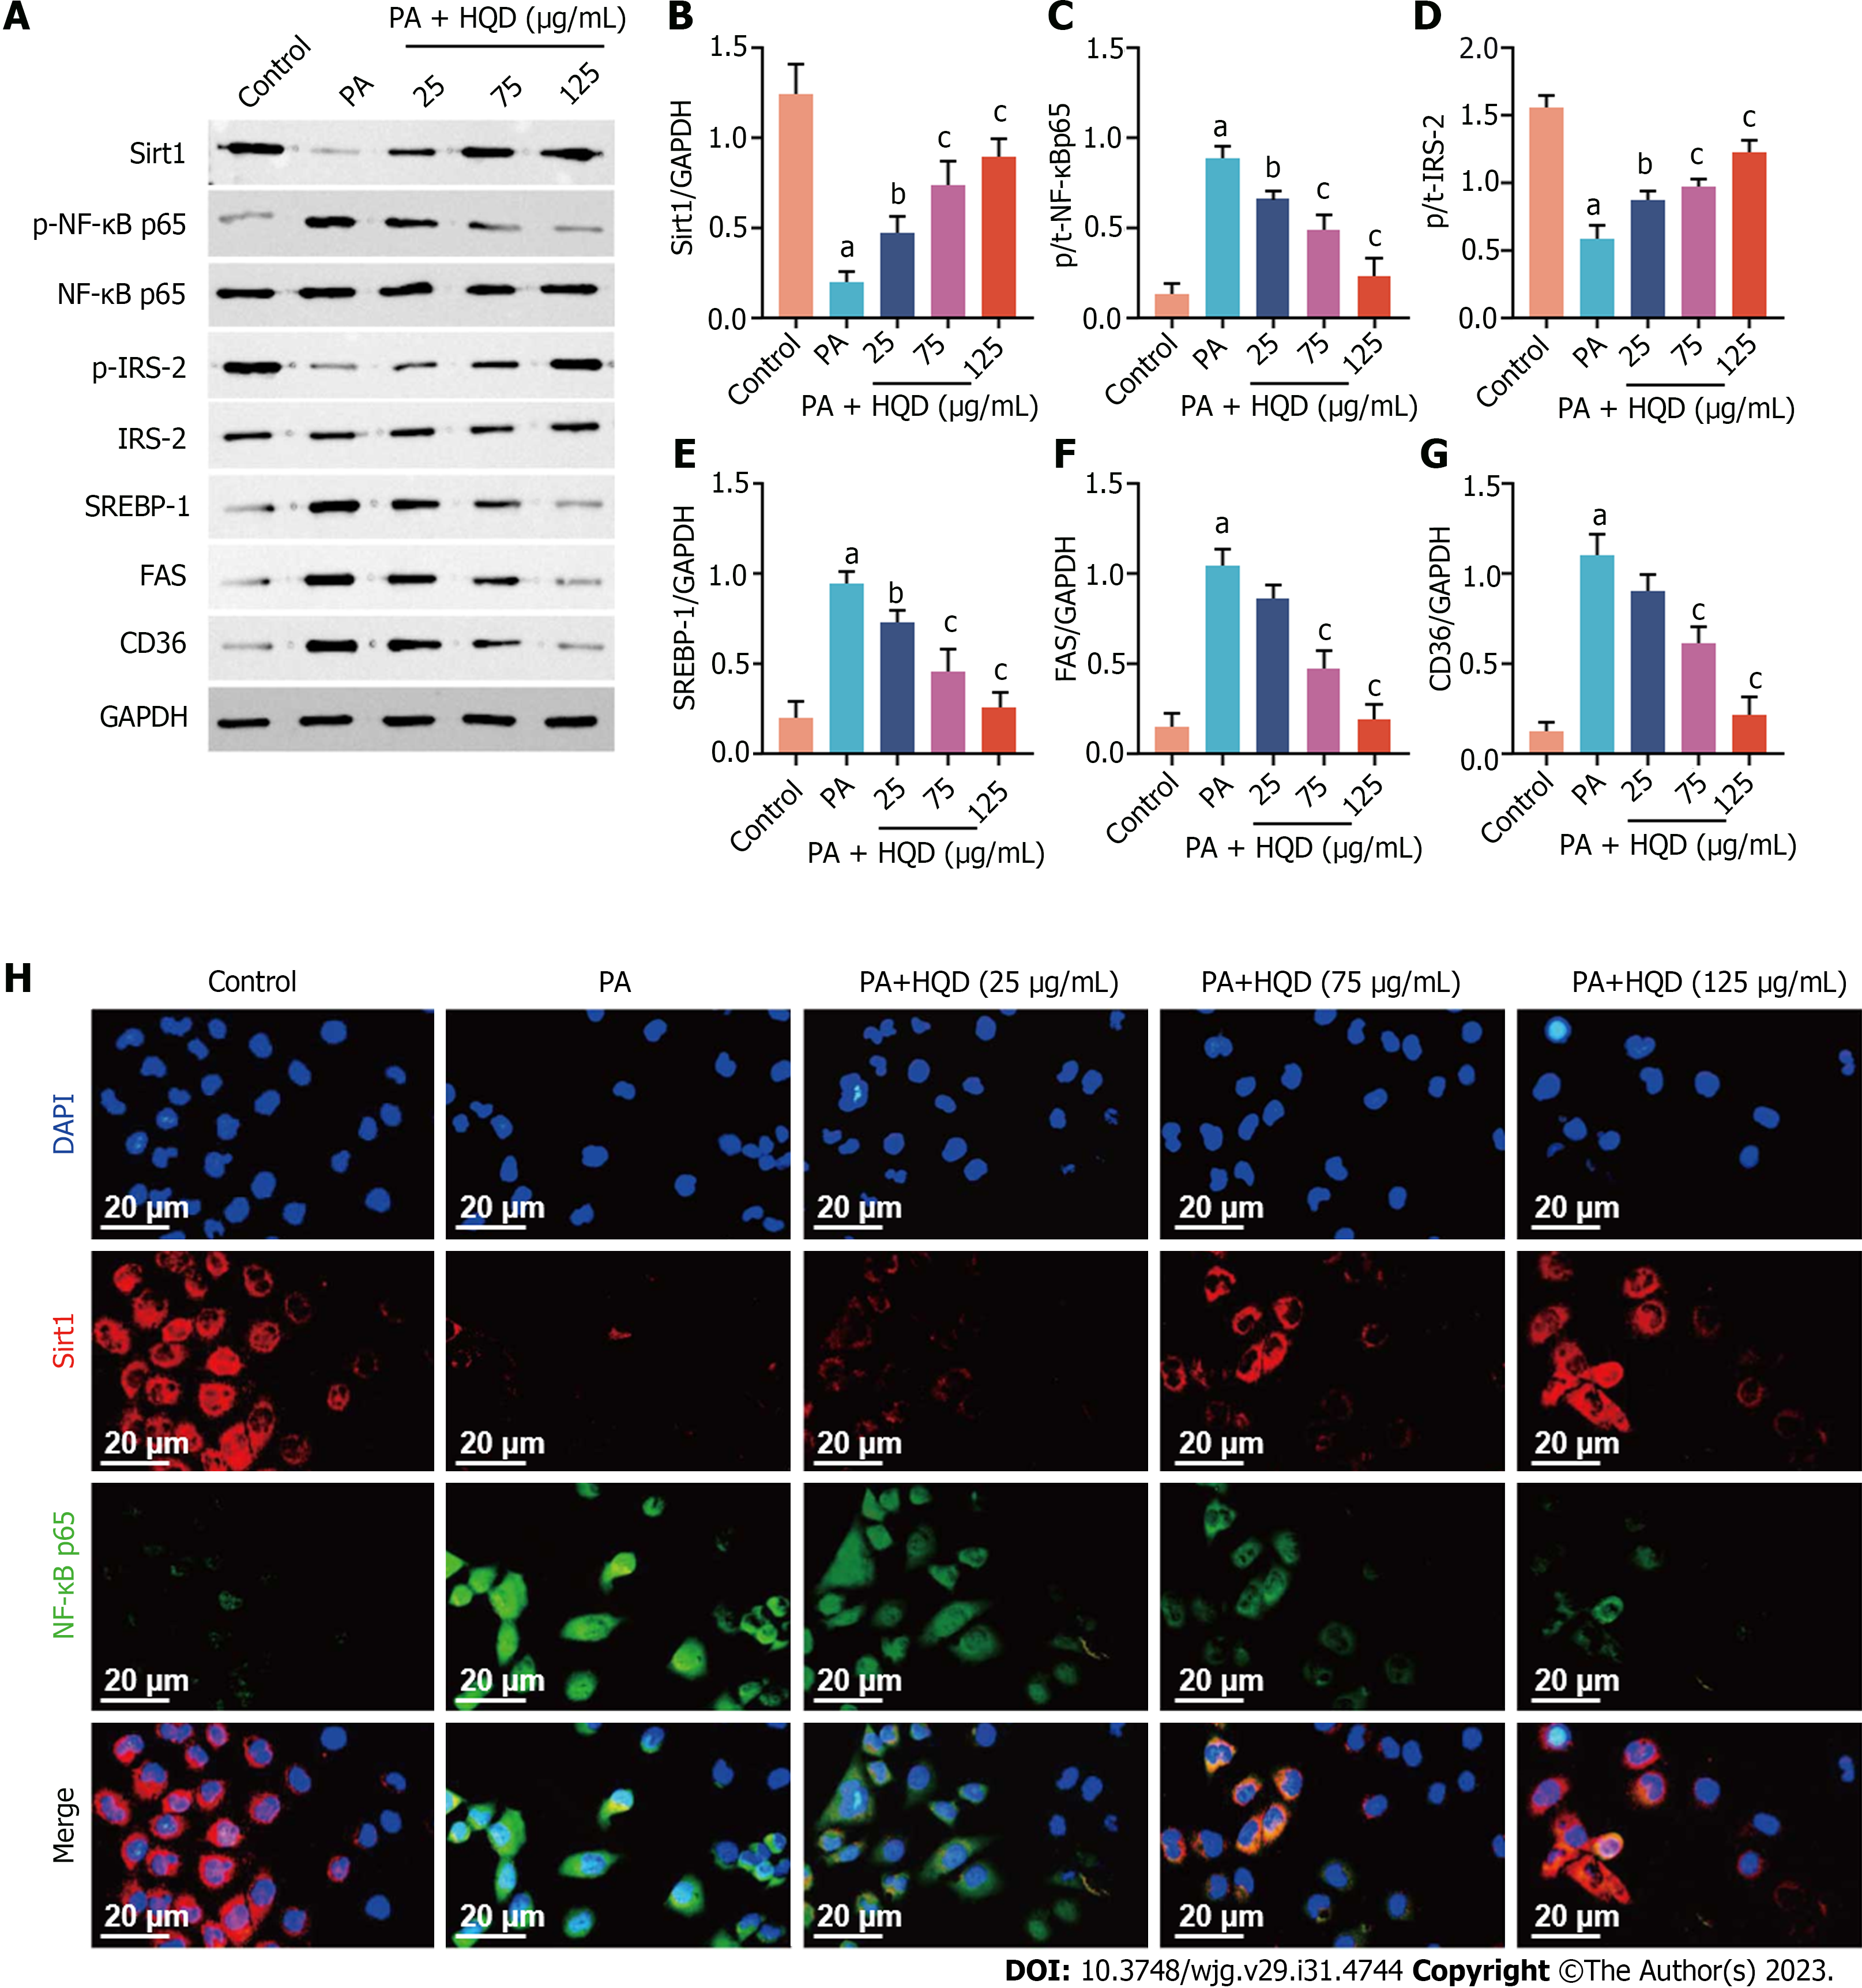
Figure 7 Huangqin decoction activates the Sirt1/NF-κB pathway in palmitic acid-induced HepG2 cells.
Data are presented as mean ± SD of at least three independent experiments. aP < 0.01 vs the control group, bP < 0.05 and cP < 0.01 vs the palmitic acid group. A: Expression levels of Sirt1, p-NF-κB/NF-κB, p-IRS-2/IRS-2, sterol regulatory element-binding protein 1, fatty acid synthase, and cluster of differentiation 36 in HepG2 cells; B–G: Semi-quantitative analysis of these proteins; H: Representative images of immunofluorescent staining of Sirt1 and NF-κB in HepG2 cells. CD36: Cluster of differentiation 36; DAPI: 4',6-diamidino-2-phenylindole; FAS: Fatty acid synthase; GAPDH: Glyceraldehyde-3-phosphate dehydrogenase; HQD, Huangqin decoction; PA: Palmitic acid; SREBP: Sterol regulatory element-binding protein.
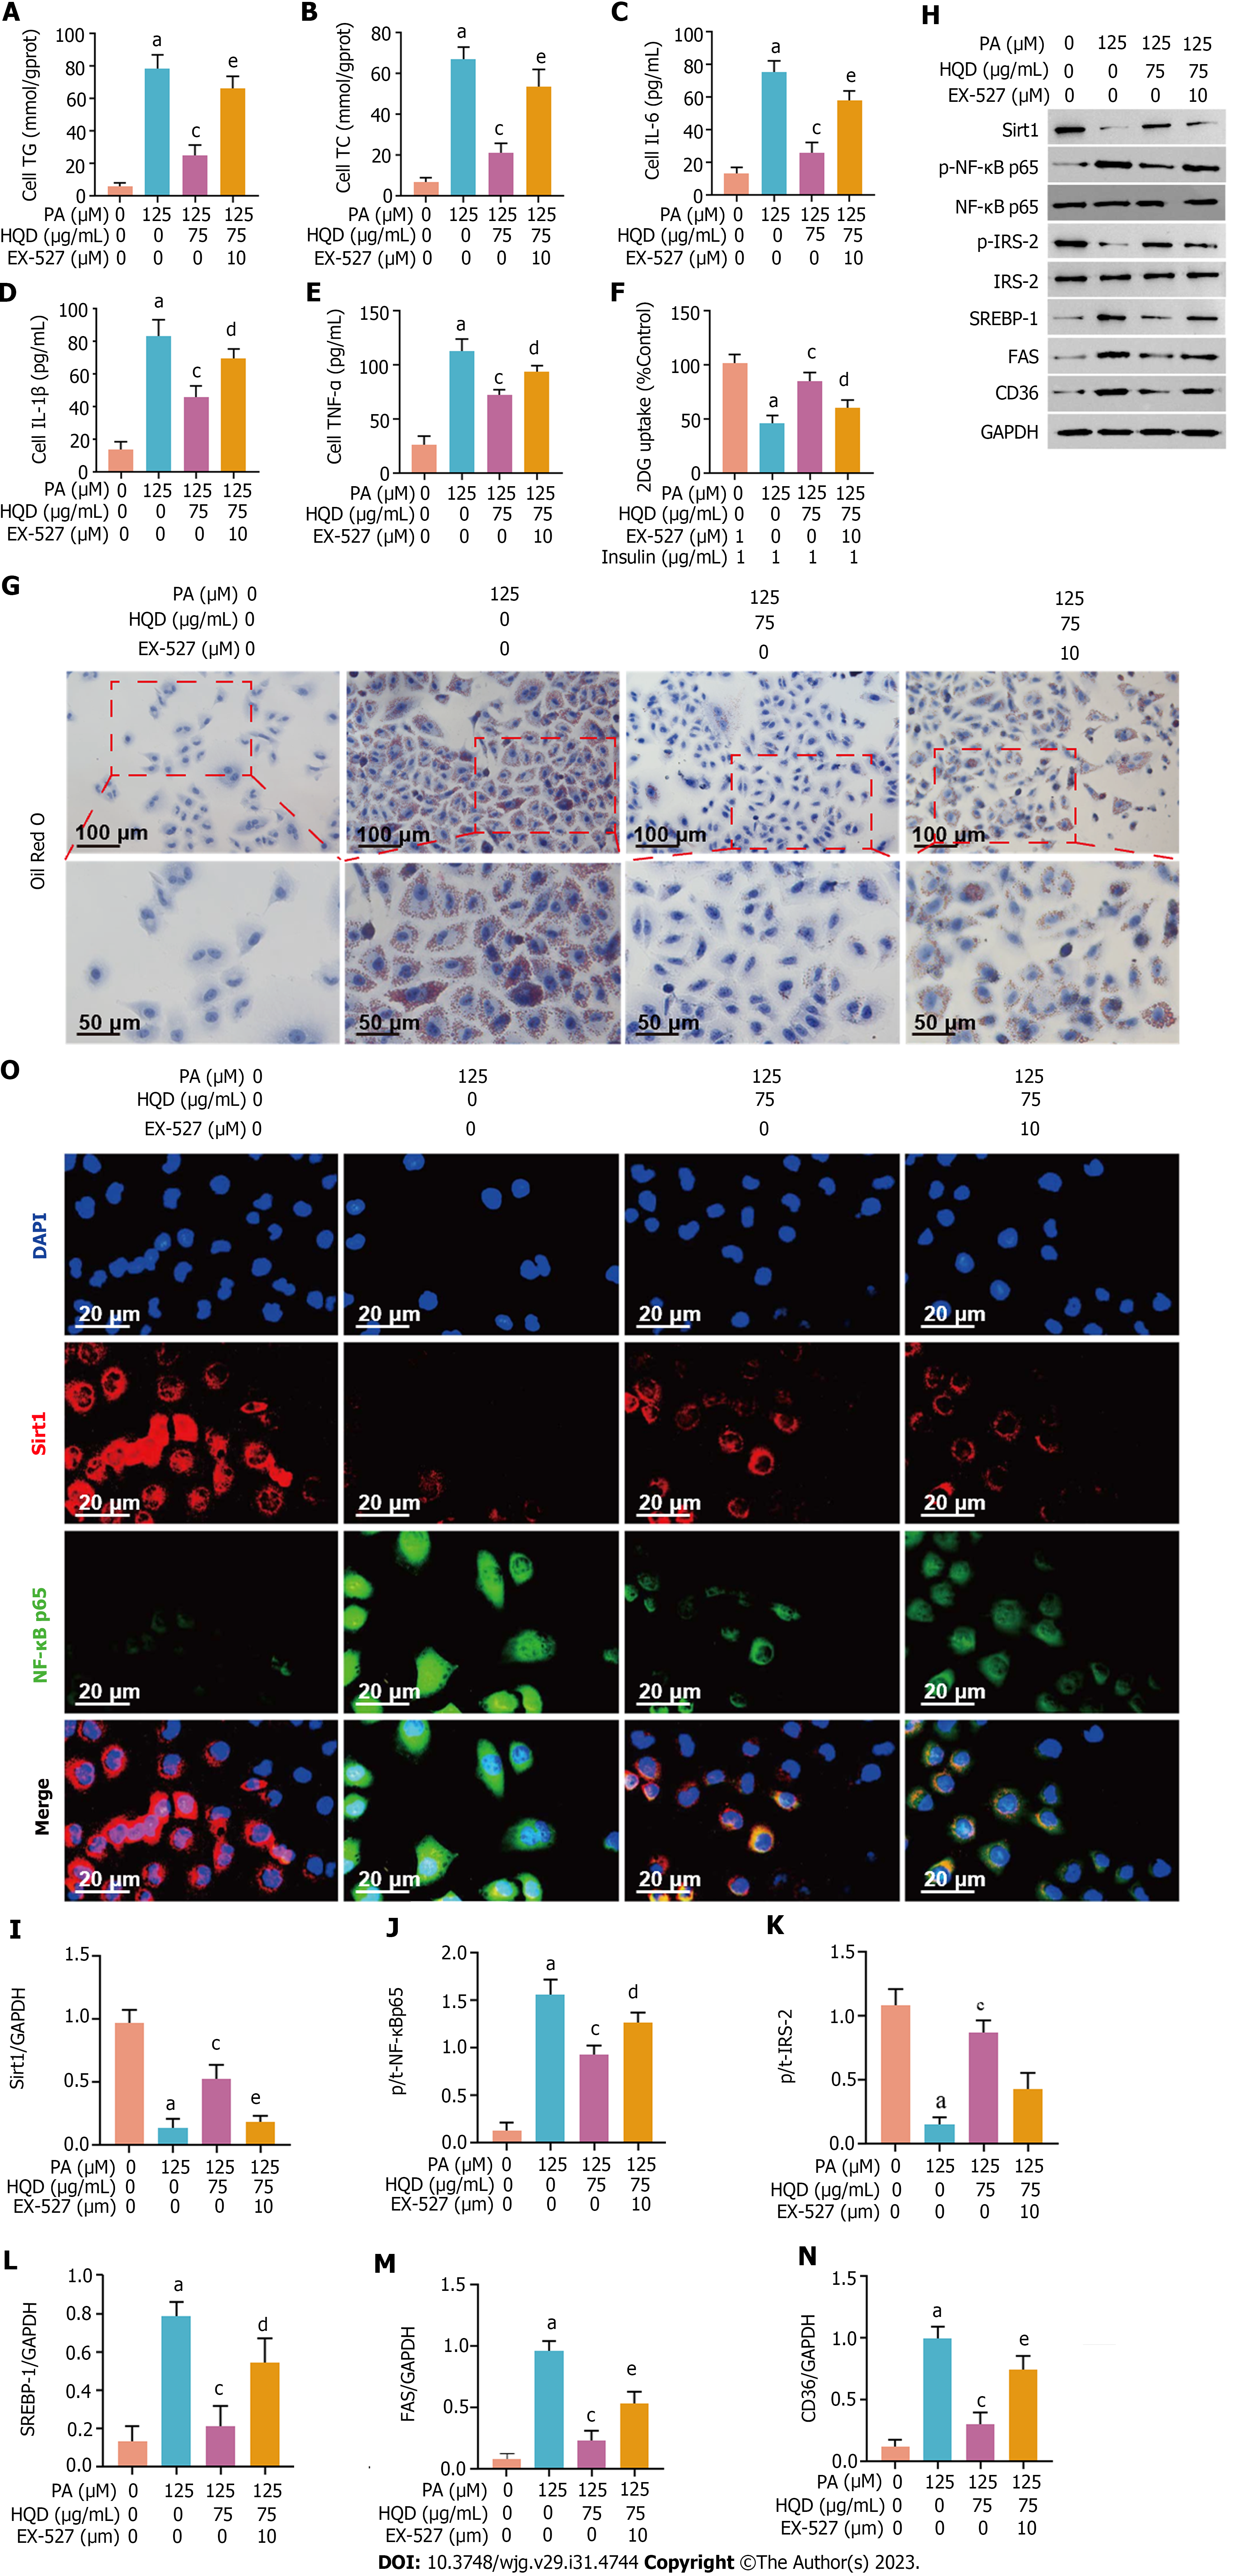
Figure 8 Huangqin decoction protects hepatocytes by triggering Sirt1/NF-κB pathway in palmitic acid-induced HepG2 cells.
Data are presented as mean ± SD of at least three independent experiments. aP < 0.01 vs the control group, bP < 0.05 and cP < 0.01 vs the palmitic acid group, dP < 0.05 and eP < 0.01 vs the Huangqin decoction group. A and B: Levels of triacylglycerol (A) and total cholesterol (B) in HepG2 cells co-cultured with or without EX-527; C-E: Levels of interleukin (IL)-6, IL-1β, and tumor necrosis factor-α in HepG2 cells co-cultured with or without EX-527; F: Level of glucose uptake in HepG2 cells co-cultured with or without EX-527; G: Representative micrographs of Oil Red O staining of HepG2 cells co-cultured with or without EX-527; H: Expression levels of Sirt1, p-NF-κB/NF-κB, p-IRS-2/IRS-2, sterol regulatory element-binding protein-1c, fatty acid synthase, and cluster of differentiation 36 in HepG2 cells co-cultured with or without EX-527; I-N: Semi-quantitative analysis of these proteins; O: Representative images of immunofluorescent staining of Sirt1 and NF-κB in HepG2 cells co-cultured with or without EX-527. 2DG: 2-deoxydglucose; CD36: Cluster of differentiation 36; DAPI: 4',6-diamidino-2-phenylindole; FAS: Fatty acid synthase; GAPDH: Glyceraldehyde-3-phosphate dehydrogenase; HQD: Huangqin decoction; IL: Interleukin; PA: Palmitic acid; SREBP: Sterol regulatory element-binding protein; TC: Total cholesterol; TG: Triacylglycerol; TNF: Tumor necrosis factor.
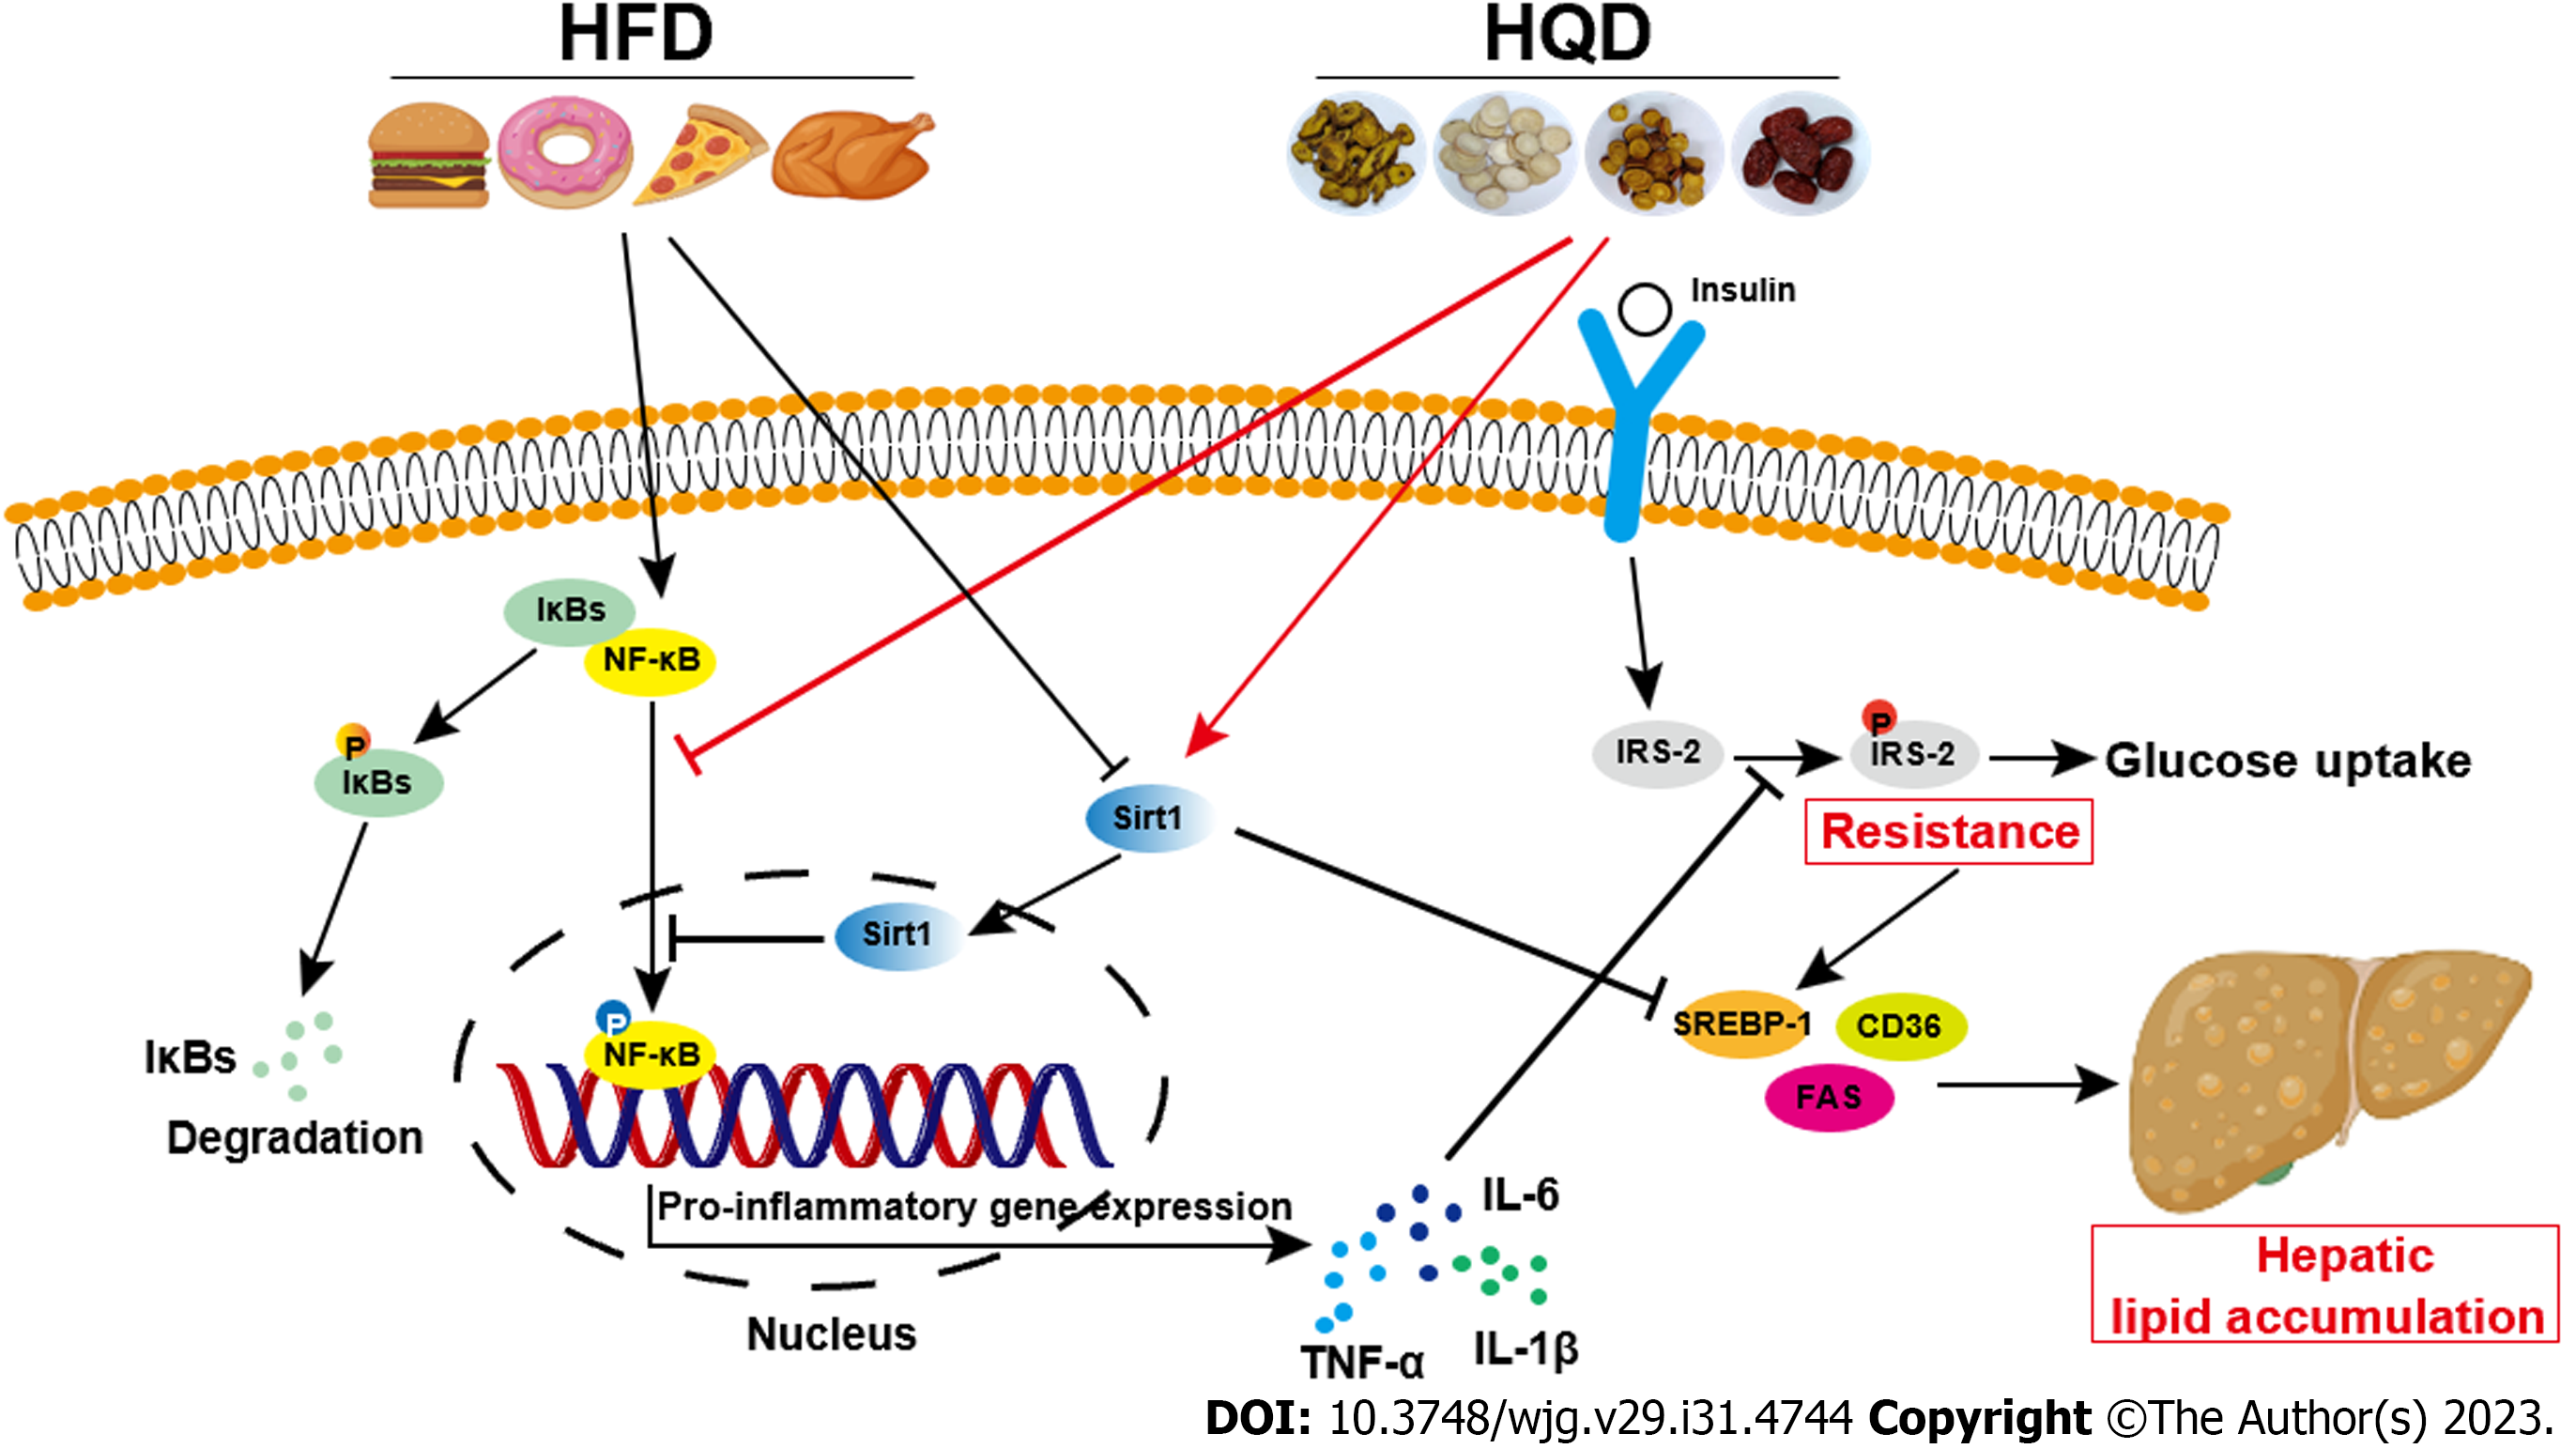
Figure 9 Schematic diagram illustrating the effects of Huangqin decoction on Sirt1/NF-κB pathway-modulated hepatic steatosis and insulin resistance.
CD36: Cluster of differentiation 36; FAS: Fatty acid synthase; HFD: High-fat diet; HQD: Huangqin decoction; IL: Interleukin; SREBP: Sterol regulatory element-binding protein; TNF: Tumor necrosis factor.
- Citation: Yan BF, Pan LF, Quan YF, Sha Q, Zhang JZ, Zhang YF, Zhou LB, Qian XL, Gu XM, Li FT, Wang T, Liu J, Zheng X. Huangqin decoction alleviates lipid metabolism disorders and insulin resistance in nonalcoholic fatty liver disease by triggering Sirt1/NF-κB pathway. World J Gastroenterol 2023; 29(31): 4744-4762
- URL: https://www.wjgnet.com/1007-9327/full/v29/i31/4744.htm
- DOI: https://dx.doi.org/10.3748/wjg.v29.i31.4744


