Copyright
©The Author(s) 2023.
World J Gastroenterol. Aug 14, 2023; 29(30): 4657-4670
Published online Aug 14, 2023. doi: 10.3748/wjg.v29.i30.4657
Published online Aug 14, 2023. doi: 10.3748/wjg.v29.i30.4657
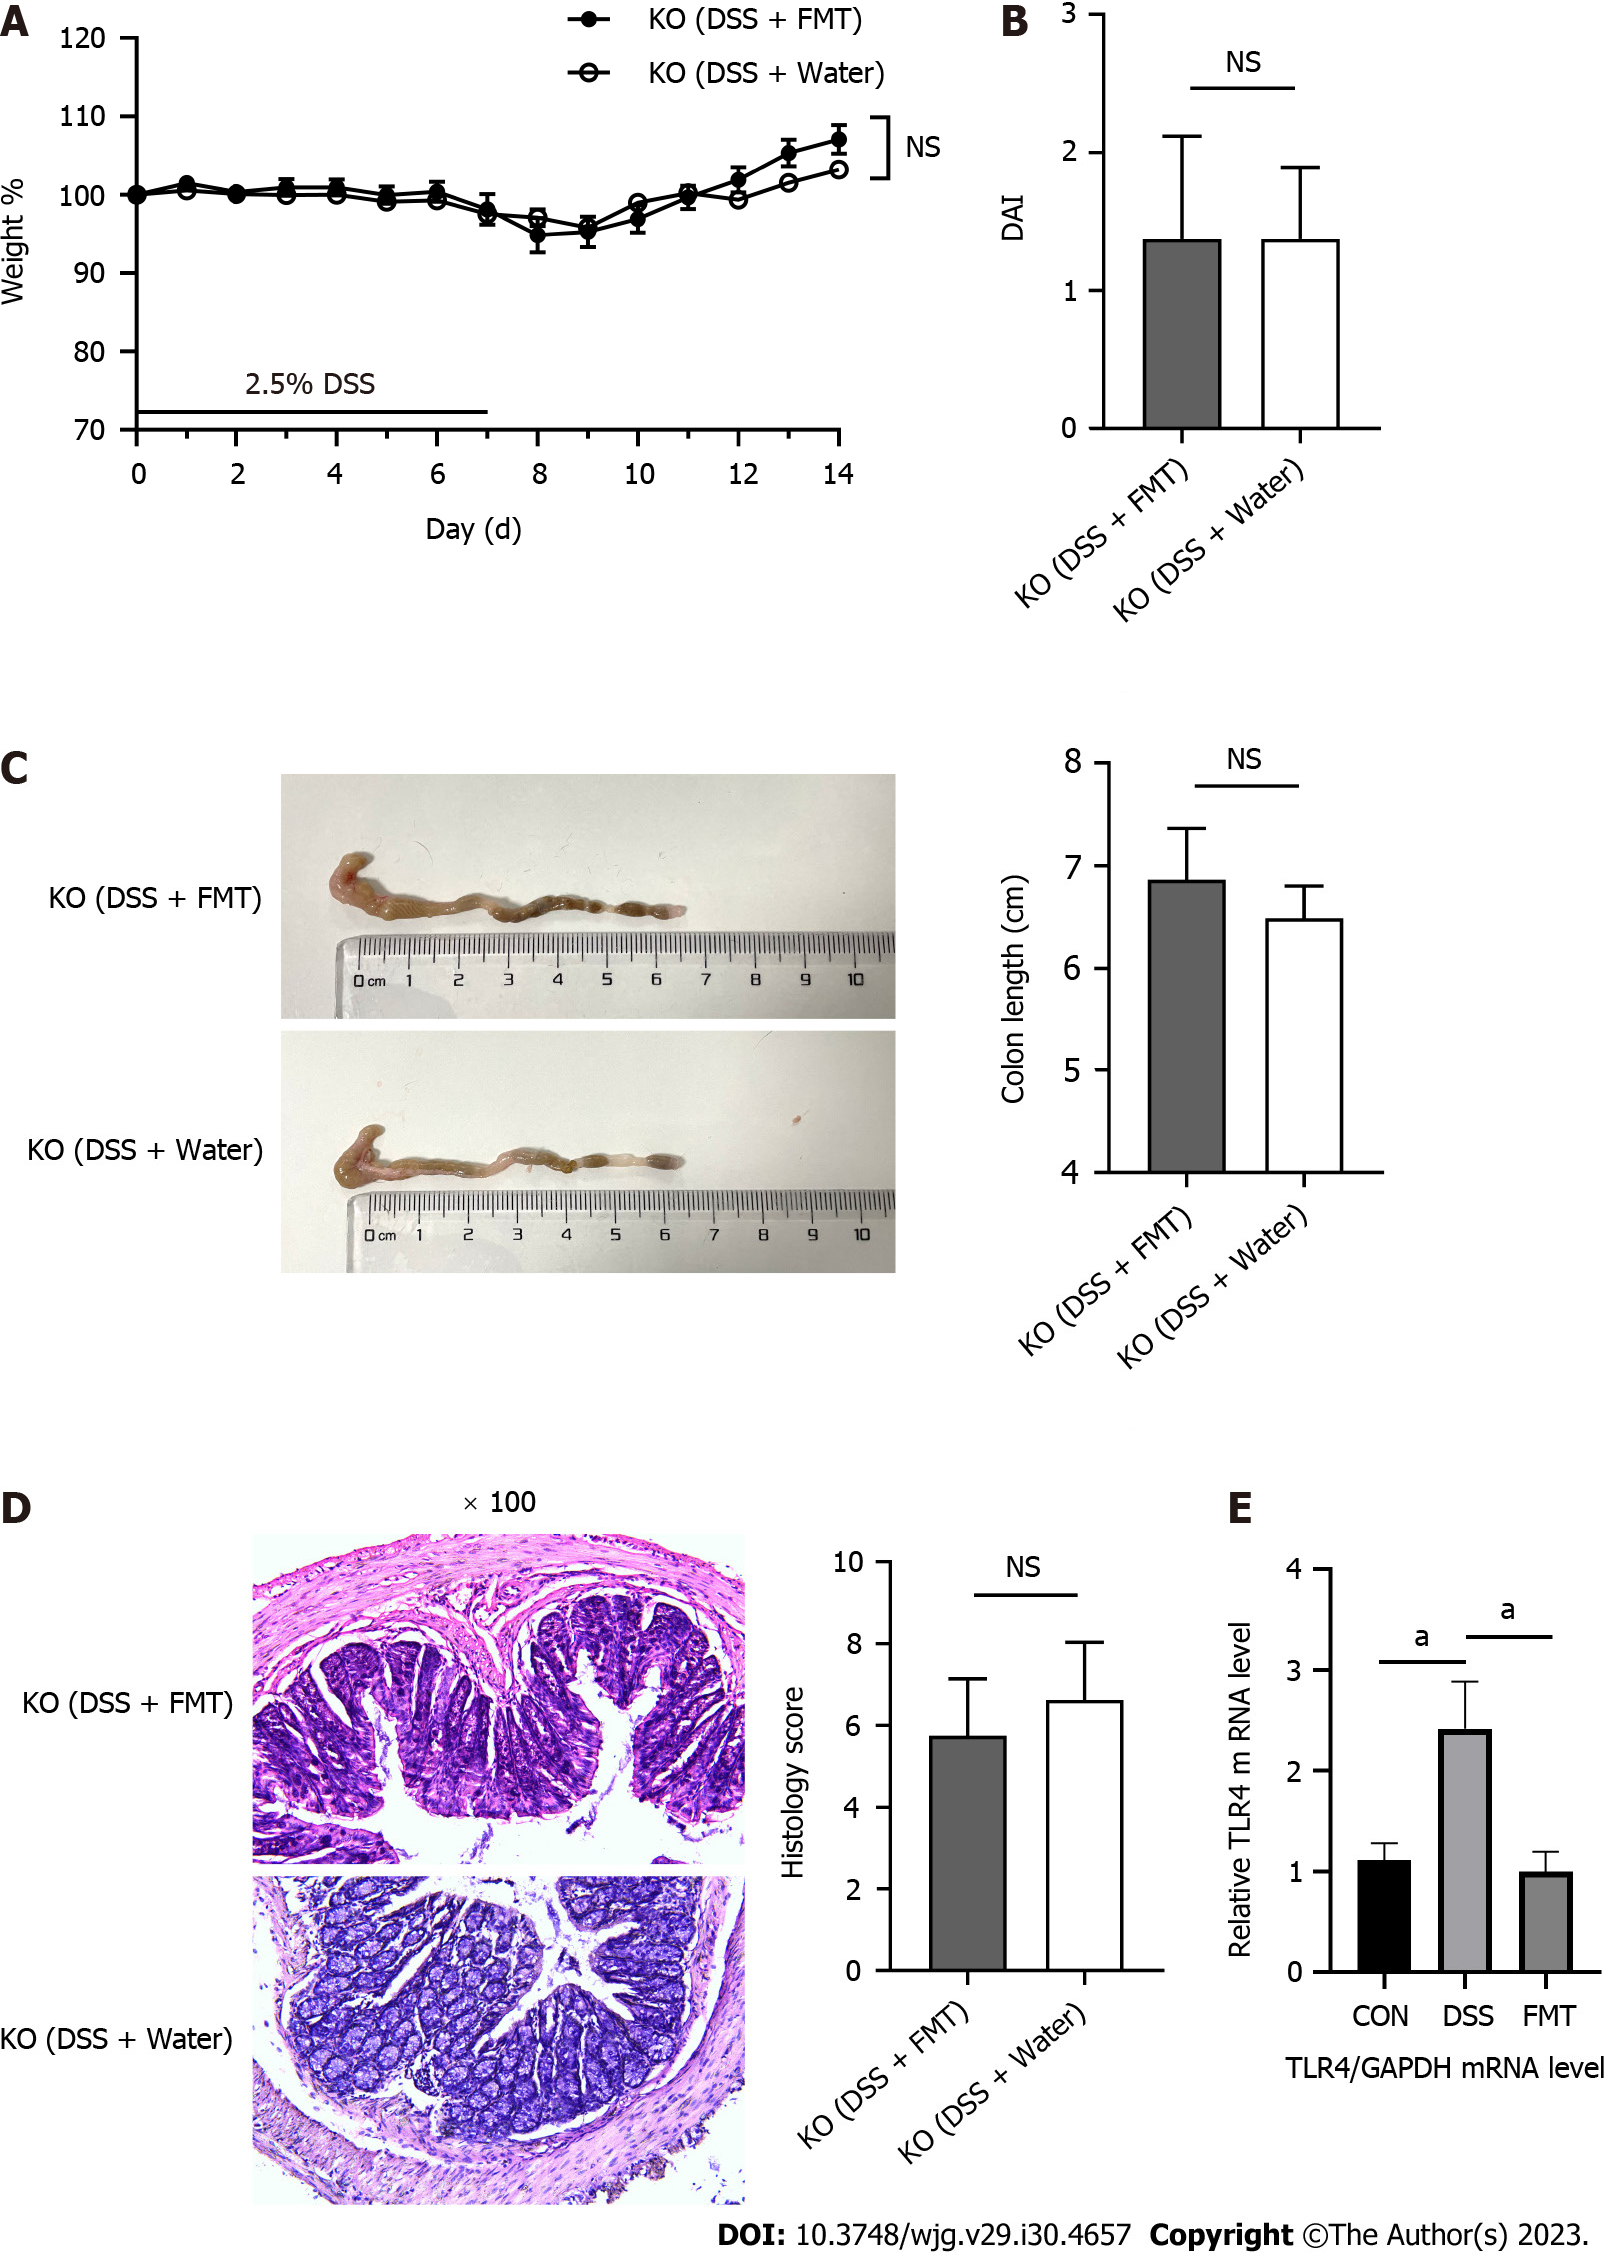
Figure 1 Fecal microbiota transplantation did not alleviate acute colitis induced by dextran sodium sulphate in Toll-like receptor 4 knockout mice.
A: Body weight of mice during the course of colitis; B: The bar chart represents the disease activity index (DAI) score of mice on day 14; C: Representative images of colons from mice (left) and statistical analysis of colon length (right); D: Representative hematoxylin and eosin staining of colon tissues, original magnification 100 ×, and histological scores (right); E: Relative quantification of the transcription level of Toll-like receptor 4 (TLR4) among groups. aP < 0.05. DSS: Dextran sodium sulphate; FMT: Fecal microbiota transplantation; KO: Knockout.
Figure 2 Fecal microbiota transplantation changed the gut microbiota of Toll-like receptor 4 knockout mice.
A: Linear discriminant analysis (LDA) effect size (LEfSe) analysis in two groups with an LDA score > 3.0; B: The relative abundance of Akkermansia in Toll-like receptor 4 knockout mice. aP < 0.05, bP < 0.01. DSS: Dextran sodium sulphate; FMT: Fecal microbiota transplantation.
Figure 3 Toll-like receptor 4 knockout alleviated dextran sodium sulphate-induced inflammation in the colon.
A: Scheme of the animal experimental design; B: The change in body weight of mice from days 0 to 7 during the disease course (knockout-dextran sodium sulphate [KO-DSS]: n = 8; wild type [WT]-DSS: n = 7); C: The bar chart represents the disease activity index (DAI) score on day 7; D: Representative colons (left) and statistical analysis (right) of colonic length; E: Representative hematoxylin and eosin staining of colon tissues (left), original magnification 100 ×, and histological scores (right). aP < 0.05, bP < 0.01, and cP < 0.001 were considered statistically significant. FMT: Fecal microbiota transplantation.
Figure 4 Diversities and compositions of gut microbiota in knockdown-control and wild type-control groups.
A: β-diversity evaluated using the weighted UniFrac-based PCA (knockdown-control [KO-CON]: n = 7; wild type [WT]-CON: n = 7); B and C: Bar graphs showing the relative abundances of different bacteria at the phylum and genus levels; D: Linear discriminant analysis (LDA) effect size analysis in groups with an LDA score > 3.0 between two groups.
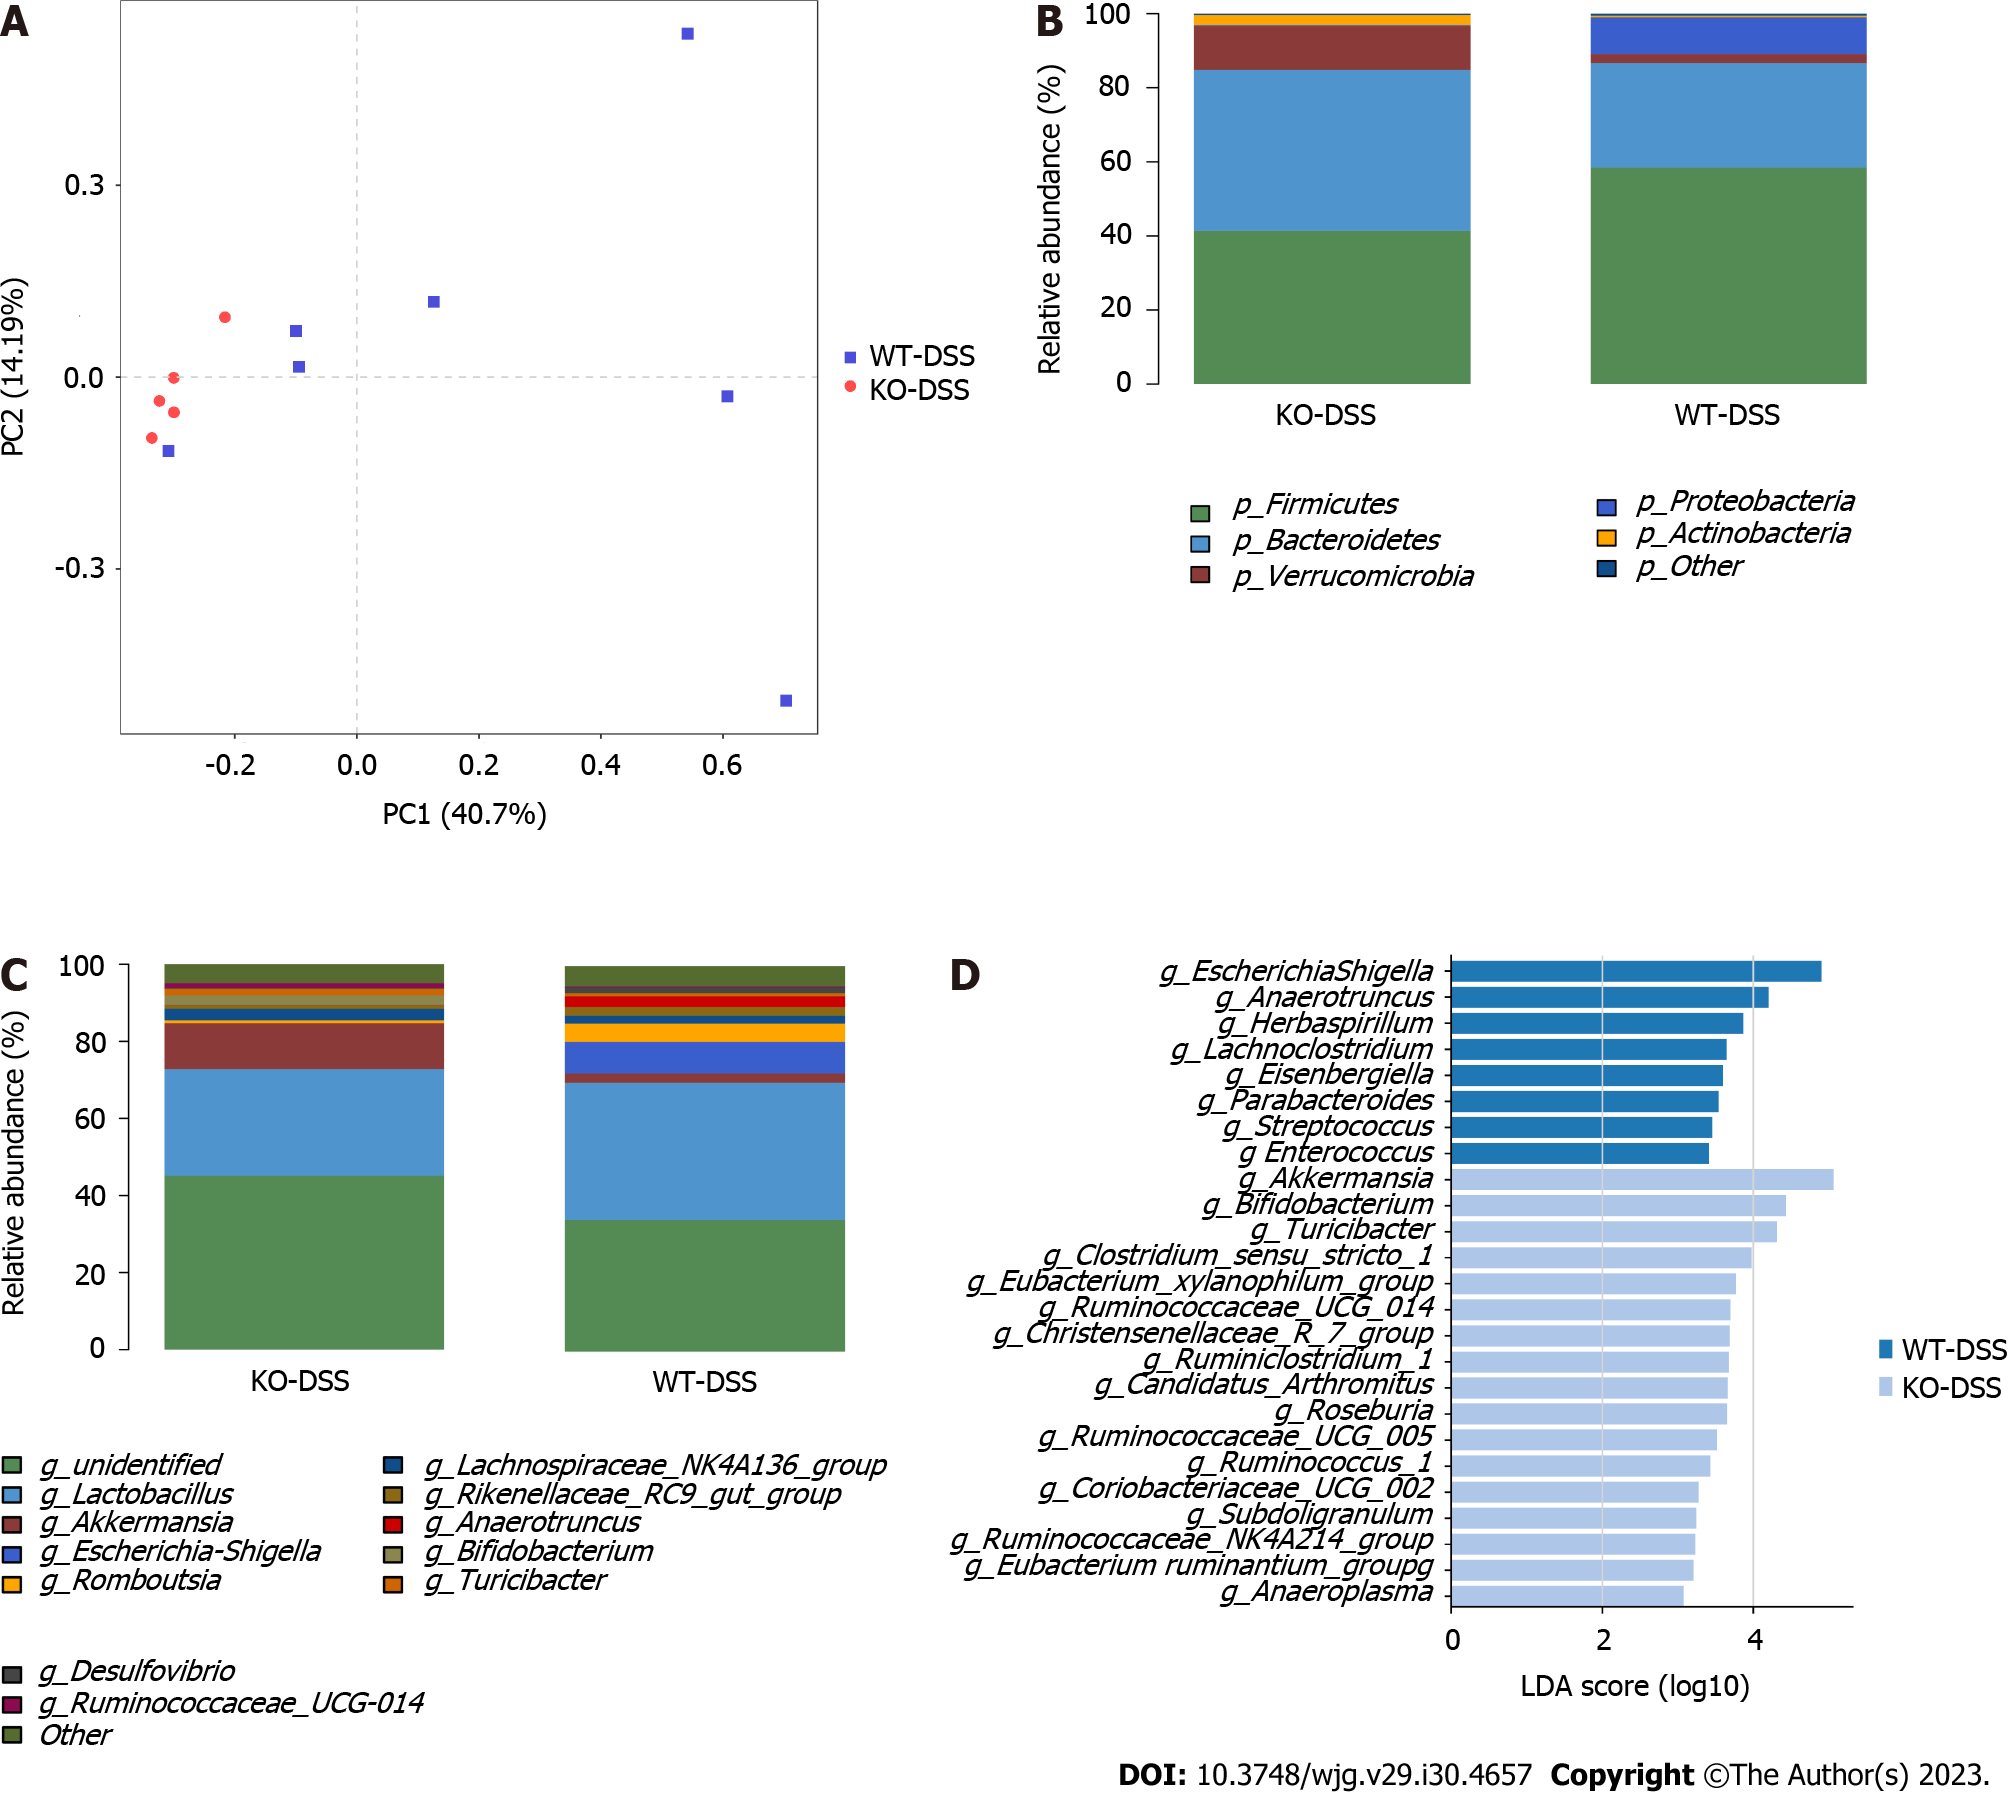
Figure 5 Diversities and compositions of gut microbiota in knockout-dextran sodium sulphate and wild type-dextran sodium sulphate groups.
A: Multiple sample principal component analysis (knockout-dextran sodium sulphate [KO-DSS]: n = 5; wild type [WT]-DSS: n = 7); B and C: Bar graphs showing the relative abundances of different bacteria at the phylum and genus levels; D: Linear discriminant analysis (LDA) effect size (LEfSe) analysis in groups with an LDA score > 3.0.
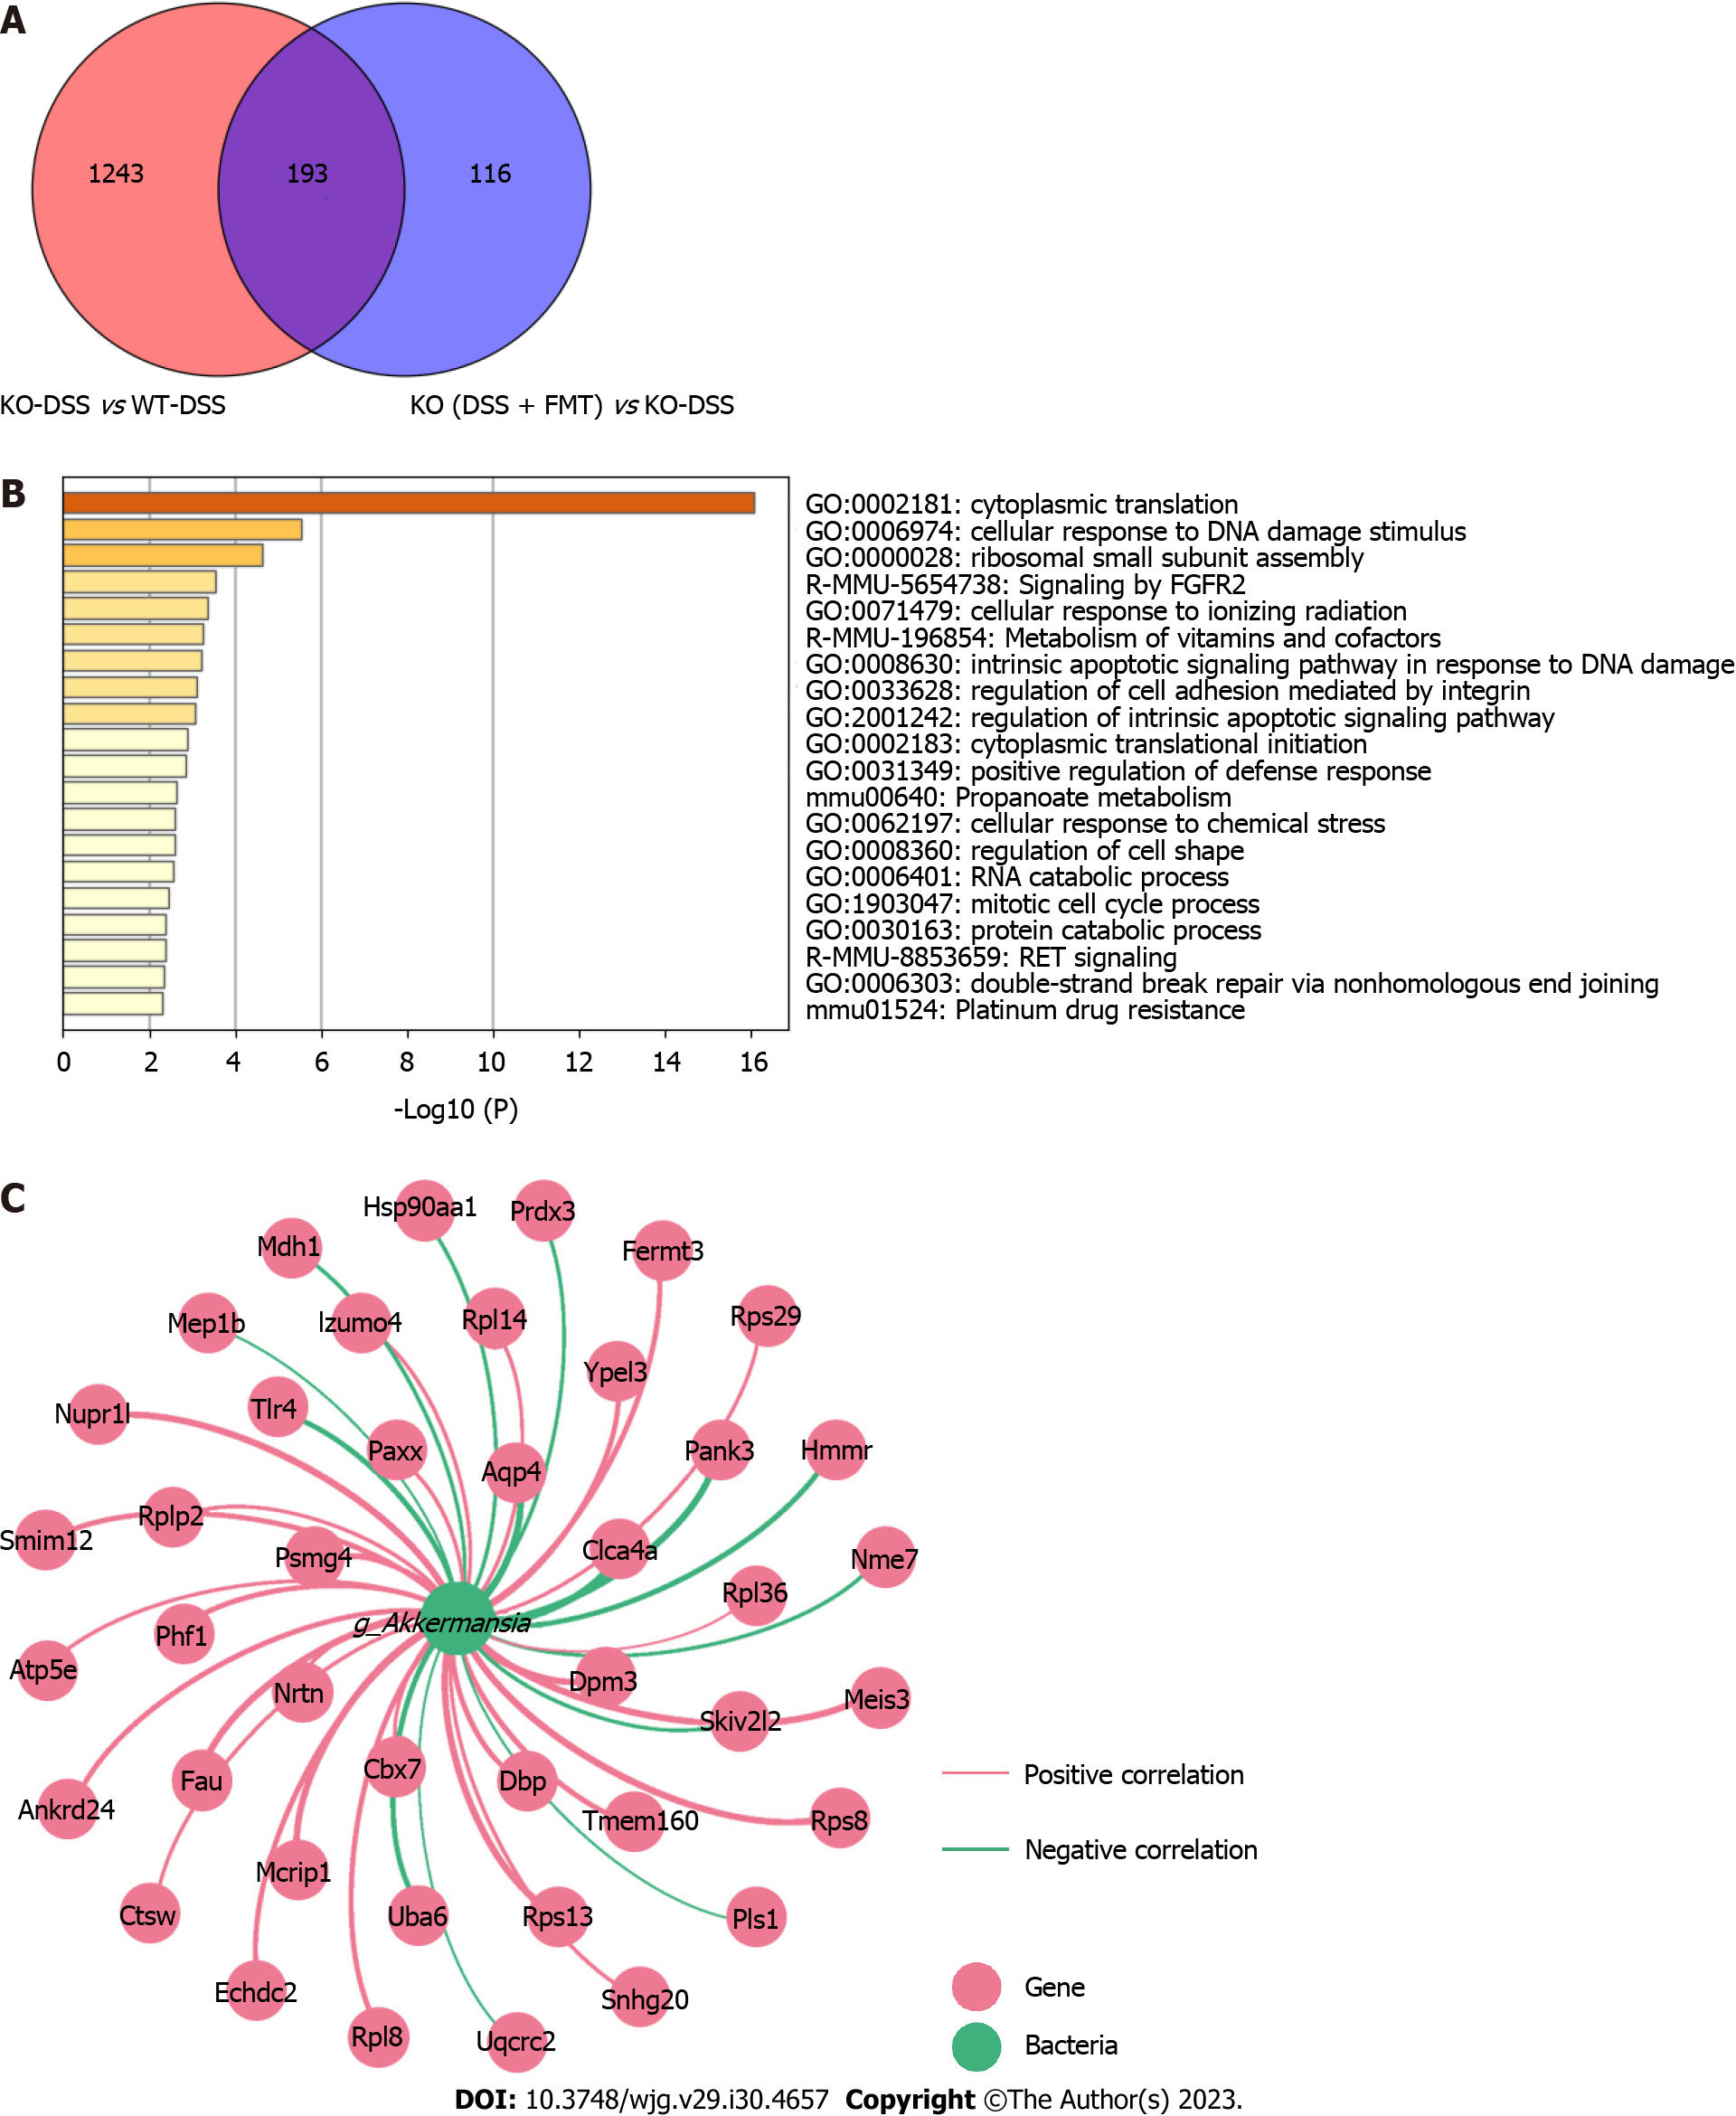
Figure 6 Colonic transcriptome profile and gene-microbe correlation.
A: Venn diagram illustrates genes regulated by fecal microbiota transplantation (FMT) and Toll-like receptor 4 knockout (KO); B: The top 20 Gene Ontology terms enriched in these 193 differentially expressed genes (DEGs); C: Network visualizing 193 DEGs associated with Akkermansia (|R| > 0.8, P < 0.05). CON: Control; DSS: Dextran Sodium Sulphate; WT: Wild type.
- Citation: Wen X, Xie R, Wang HG, Zhang MN, He L, Zhang MH, Yang XZ. Fecal microbiota transplantation alleviates experimental colitis through the Toll-like receptor 4 signaling pathway. World J Gastroenterol 2023; 29(30): 4657-4670
- URL: https://www.wjgnet.com/1007-9327/full/v29/i30/4657.htm
- DOI: https://dx.doi.org/10.3748/wjg.v29.i30.4657


