Copyright
©The Author(s) 2023.
World J Gastroenterol. Aug 7, 2023; 29(29): 4580-4592
Published online Aug 7, 2023. doi: 10.3748/wjg.v29.i29.4580
Published online Aug 7, 2023. doi: 10.3748/wjg.v29.i29.4580
Figure 1 The flowchart of patient enrolment.
PBC: Primary biliary cholangitis; BMD: Bone mineral density.
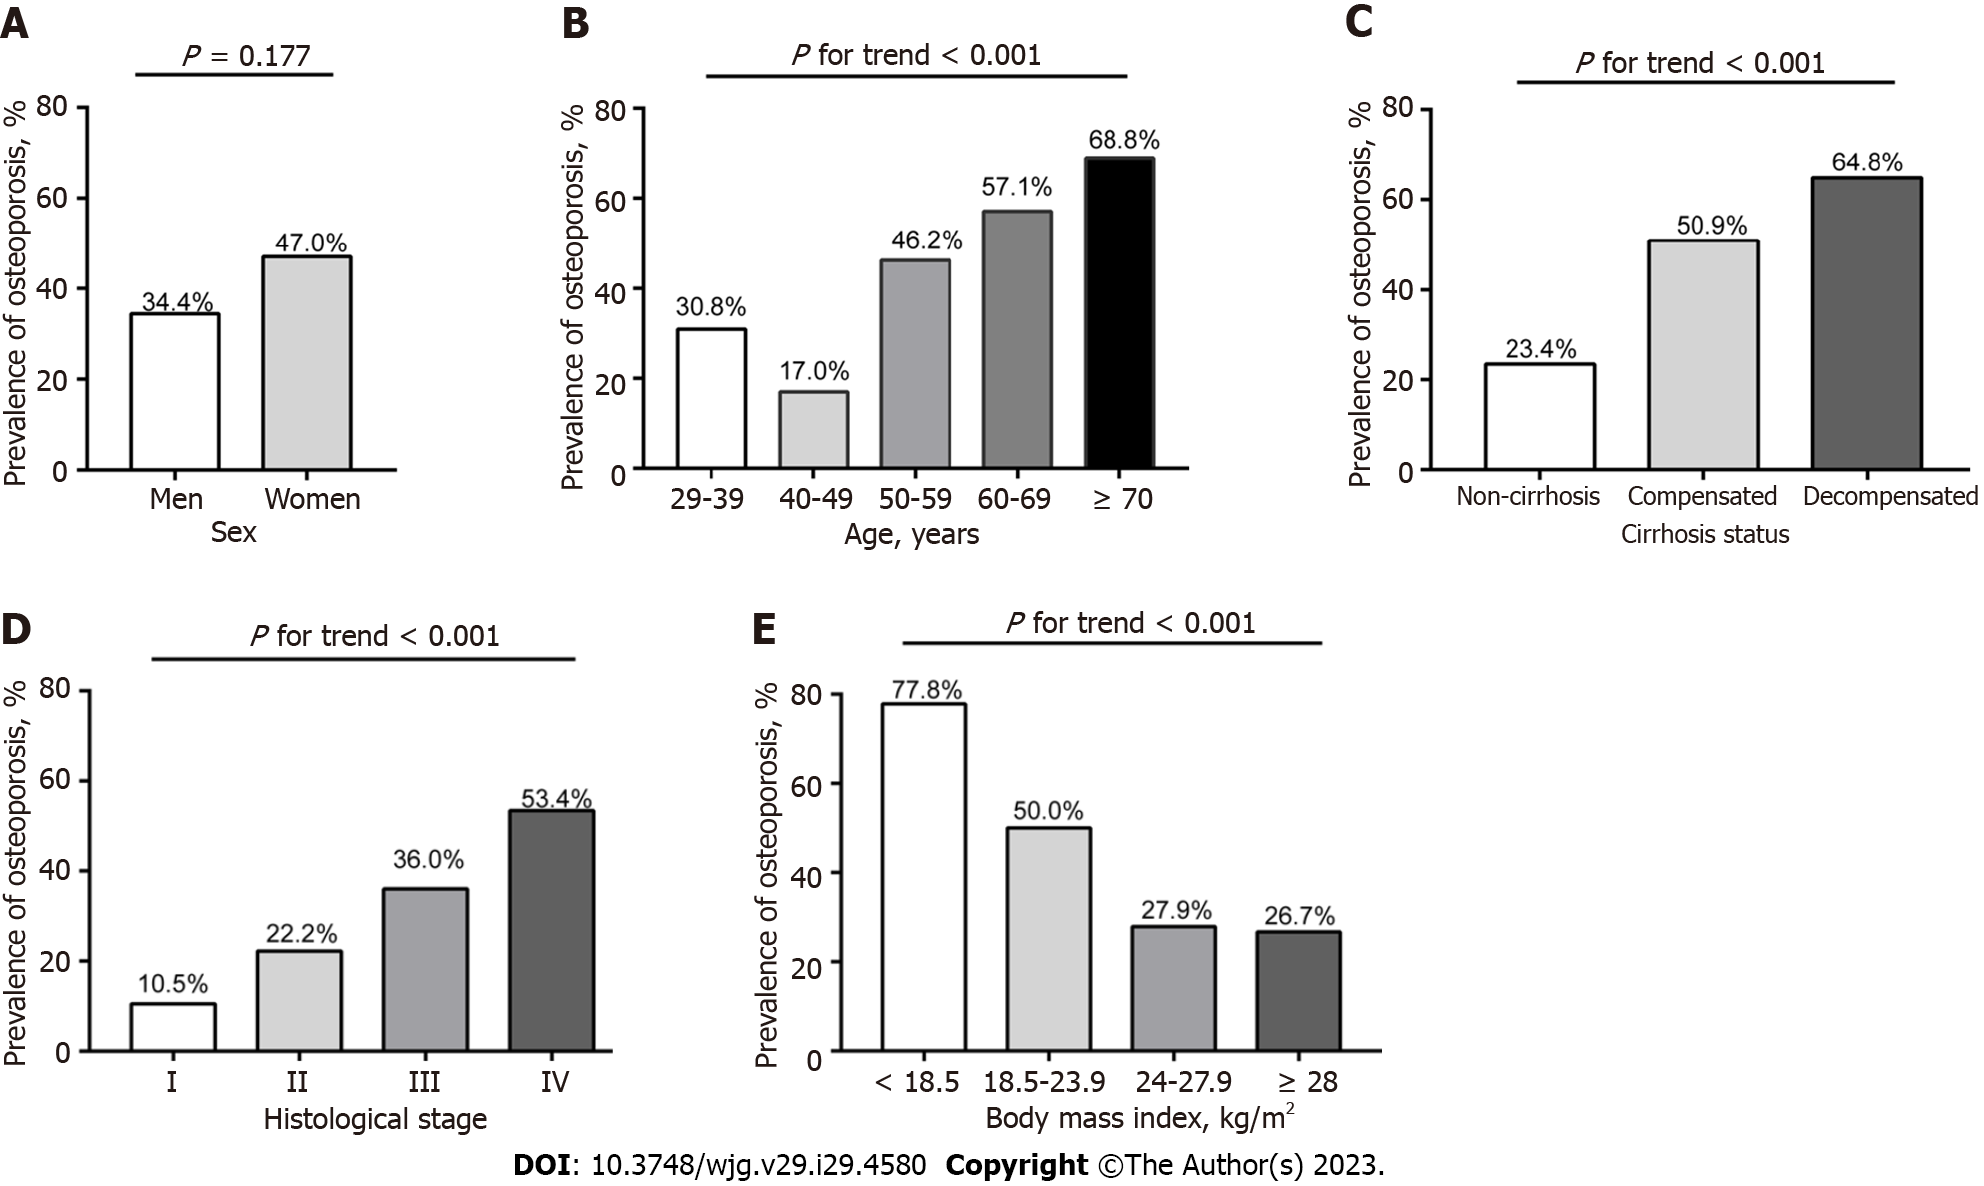
Figure 2 Prevalence of osteoporosis in different subgroups for overall patients with primary biliary cholangitis (n = 268).
A: Sex; B: Age; C: Cirrhosis status; D: Histological stage; E: Body mass index.
Figure 3 Prevalence of osteoporosis in different subgroups for women patients with primary biliary cholangitis (n = 236).
A: Postmenopausal status; B: Age; C: Cirrhosis status; D: Histological stage; E: Body mass index.
- Citation: Chen JL, Liu Y, Bi YF, Wang XB. Prevalence and risk factors of osteoporosis detected by dual-energy X-ray absorptiometry among Chinese patients with primary biliary cholangitis. World J Gastroenterol 2023; 29(29): 4580-4592
- URL: https://www.wjgnet.com/1007-9327/full/v29/i29/4580.htm
- DOI: https://dx.doi.org/10.3748/wjg.v29.i29.4580


