Copyright
©The Author(s) 2023.
World J Gastroenterol. Aug 7, 2023; 29(29): 4528-4541
Published online Aug 7, 2023. doi: 10.3748/wjg.v29.i29.4528
Published online Aug 7, 2023. doi: 10.3748/wjg.v29.i29.4528
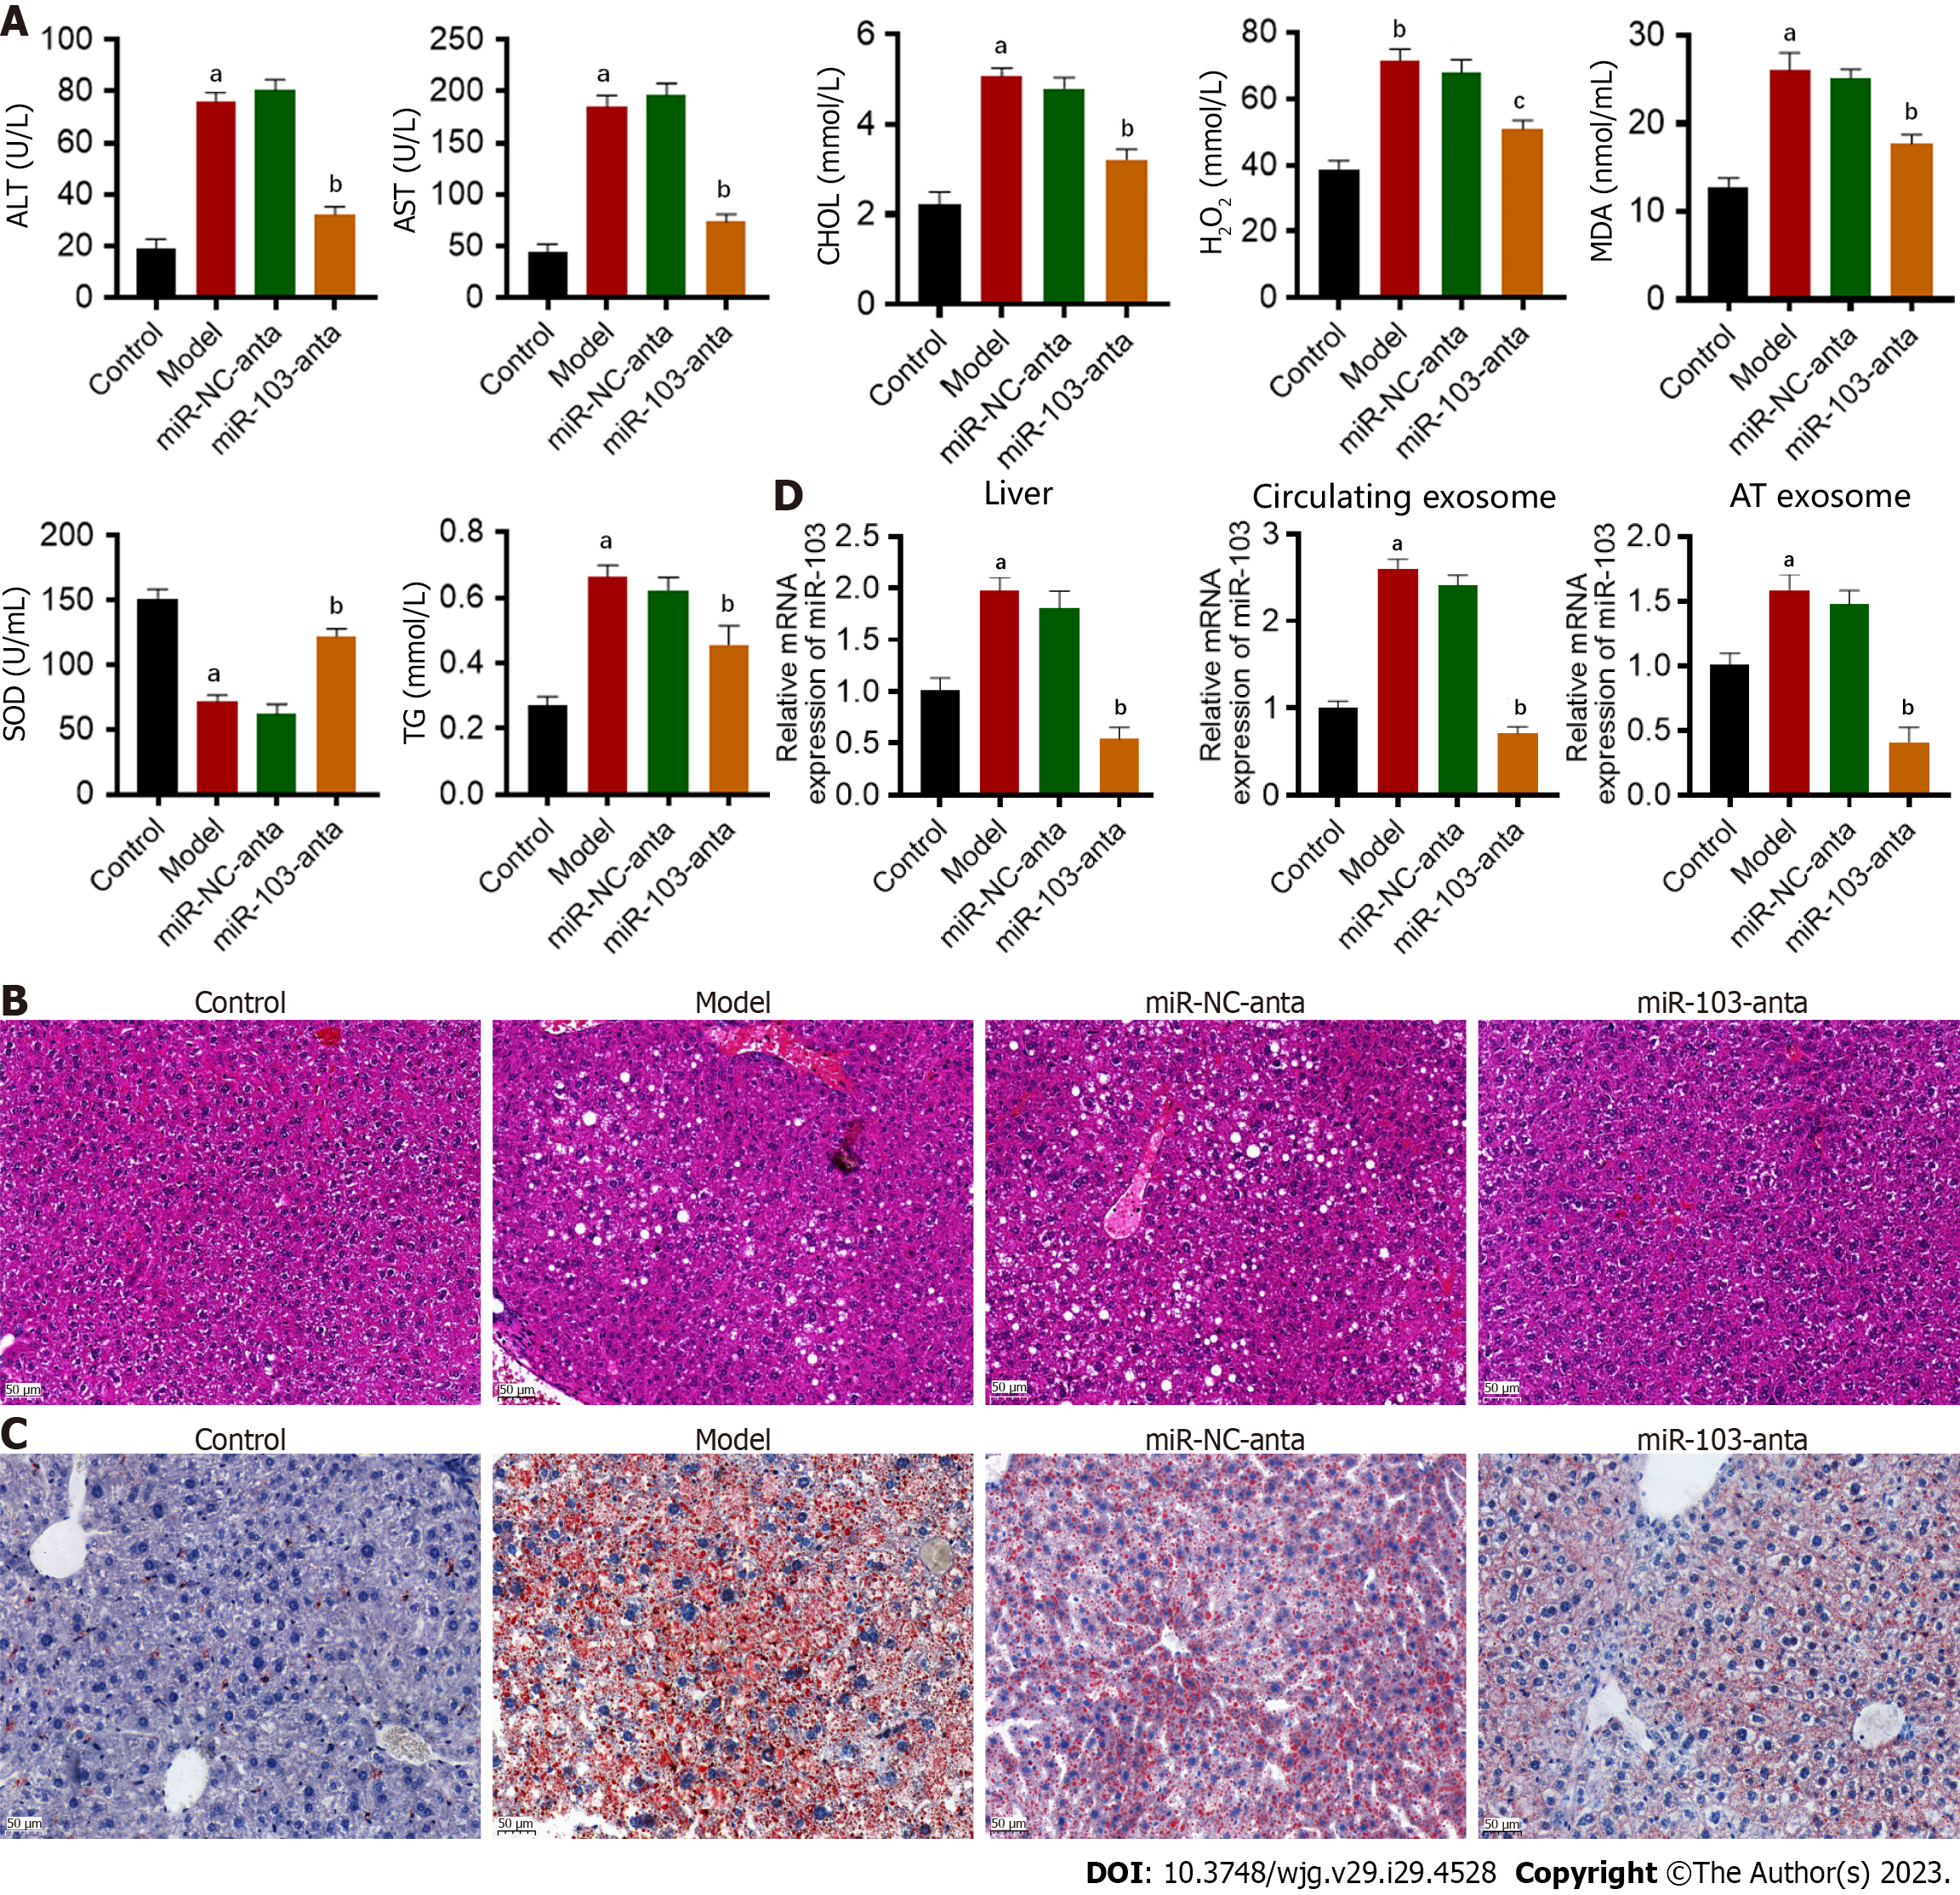
Figure 1 The effect of miR-103 on the development of non-alcoholic steatohepatitis in mice.
A: The results of ELISA to measure serum alanine aminotransferase (ALT), aspartate aminotransferase, total triglycerides, total cholesterol, superoxide dismutase, malondialdehyde, and H2O2; B: Hematoxylin and eosin staining of mice liver from different groups; C: Oil-red staining of mice liver from different groups; D: The expression of miR-103 in the liver, circulating exosomes, and adipose tissue-derived exosomes. aP < 0.01 vs control; bP < 0.01 vs model. ALT: Alanine aminotransferase; AST: Aspartate aminotransferase; TG: Total triglycerides; CHOL: Cholesterol; SOD: Superoxide dismutase; MDA: Malondialdehyde.
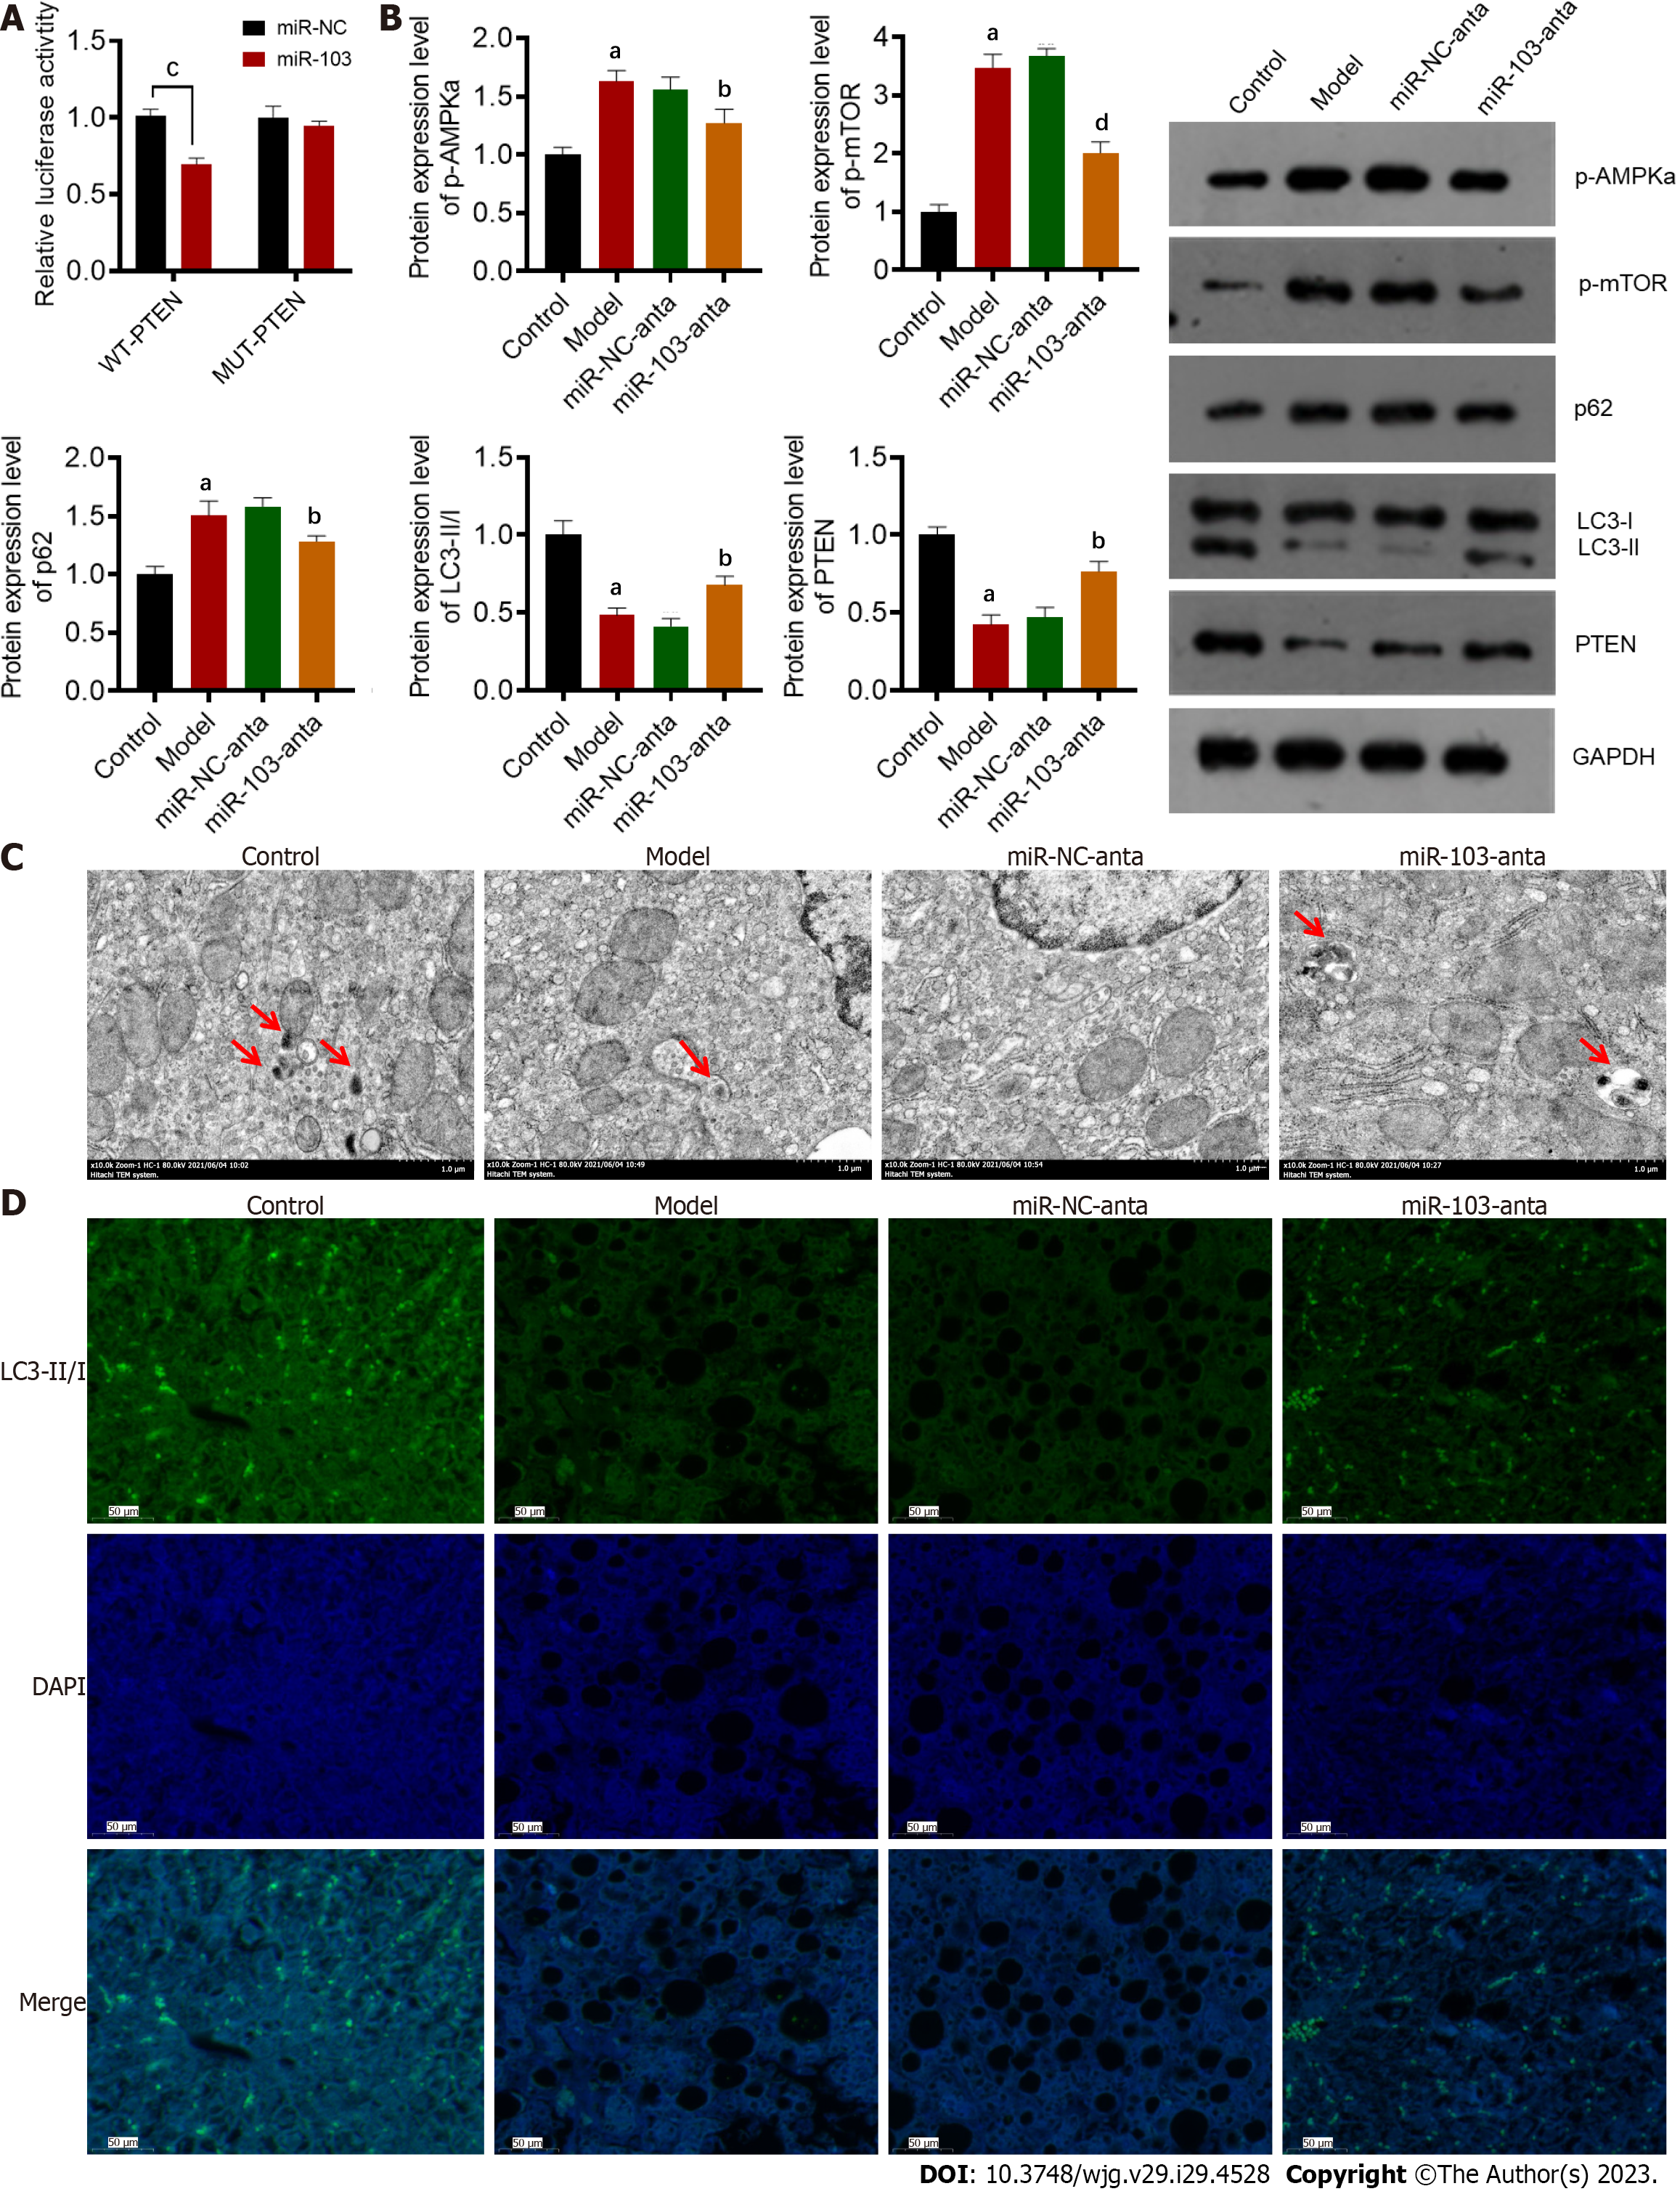
Figure 2 The capacity of miR-103 in targeting phosphatase and tensin homolog gene and affecting autophagy.
A: The luciferase reporter assay results verified the interaction between miR-103 and phosphatase and tensin homolog; B: Western blotting showed the differential expression of the autophagy-related protein; C: Transmission electron microscopy images of autophagosomes (red arrowhead) in the liver; D: The results of immunofluorescence staining showed liver autophagosomes in different groups. aP < 0.01 vs control; bP < 0.01 vs model; cP < 0.01 vs miR-103; dP < 0.05 vs model. PTEN: Phosphatase and tensin homolog; WT: Wild type; MUT: Mutant; DAPI: 4’,6-diamidino-2-phenylindole; mTOR: Mammalian target of rapamycin; NC: Negative control.
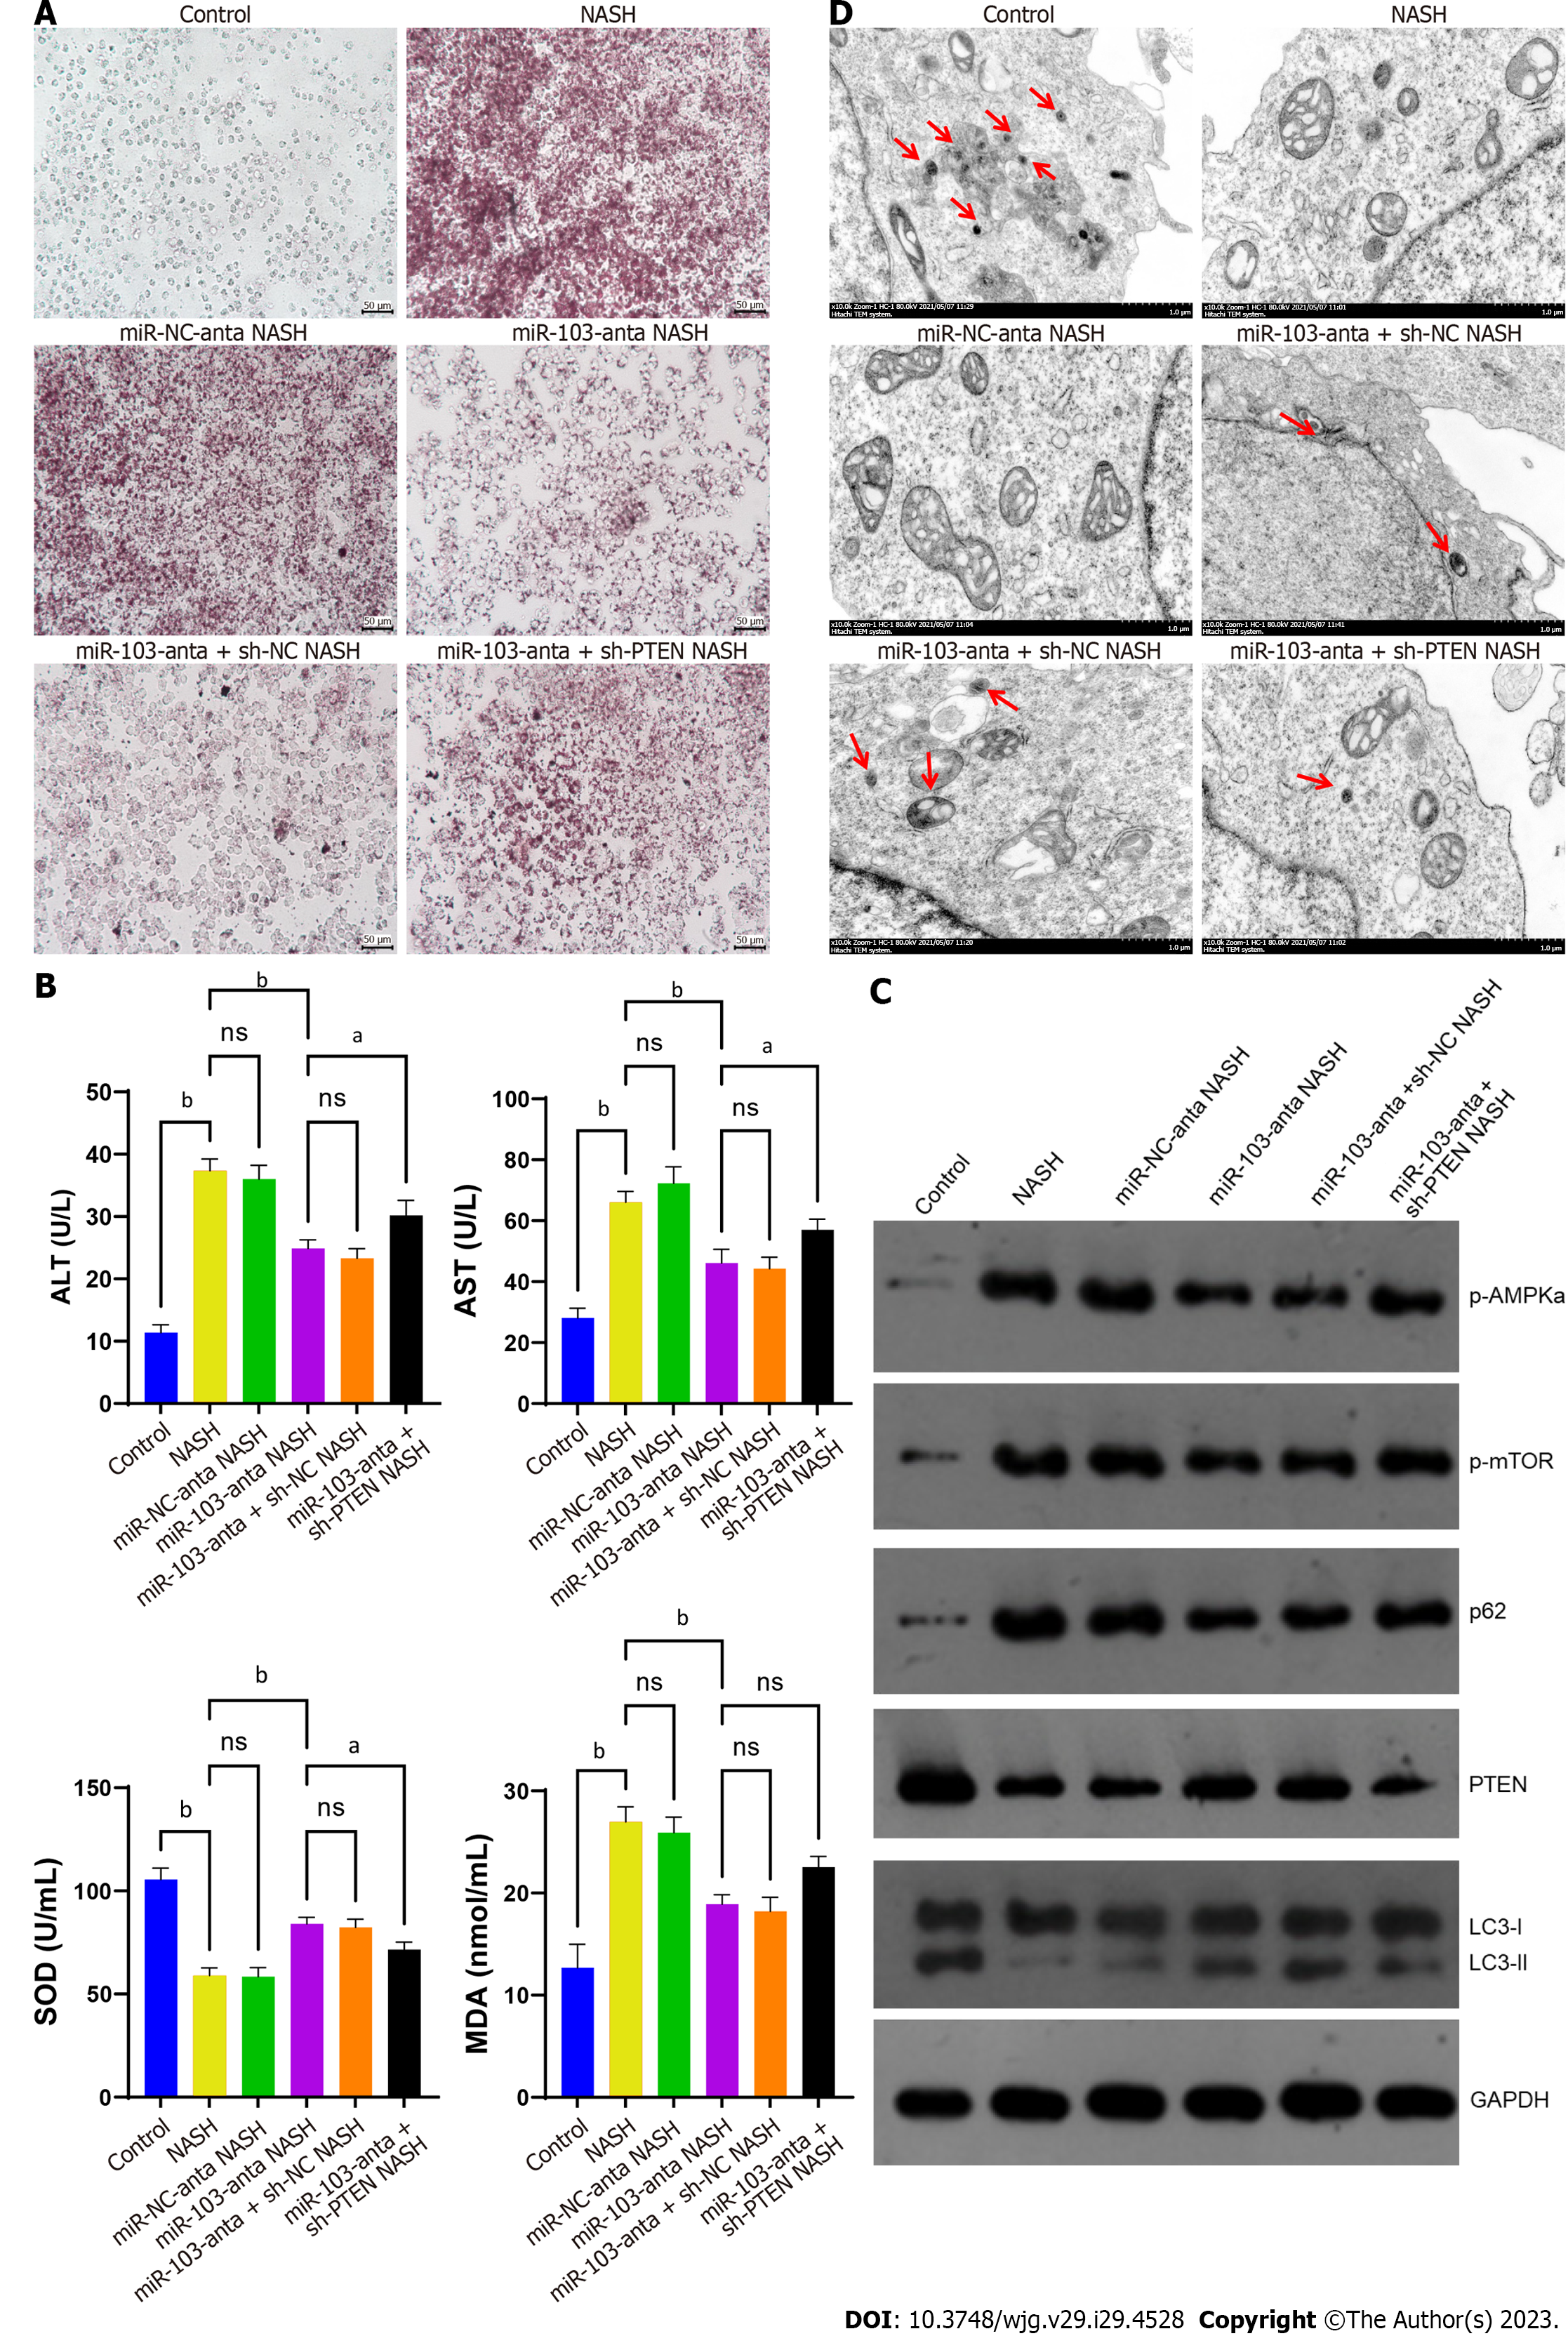
Figure 3 Invitro experiments confirmed the interaction between miR-103 and phosphatase and tensin homolog gene.
A: Oil-red staining of cells from different groups showed different lipid droplet accumulation and inflammatory cell infiltration; B: The results of ELISA to measure serum alanine aminotransferase, aspartate aminotransferase, superoxide dismutase and malondialdehyde; C: Western blotting detected the expression of the autophagy-related protein of cells from different groups; D: Transmission electron microscopy pictures of autophagosomes (red arrowhead) in cells from different groups. aP < 0.05, bP < 0.01, ns: No significance. NASH: Non-alcoholic steatohepatitis; PTEN: Phosphatase and tensin homolog; NC: Negative control; ALT: Alanine aminotransferase; AST: Aspartate aminotransferase; TG: Total triglycerides; CHOL: Cholesterol; SOD: Superoxide dismutase; MDA: Malondialdehyde.
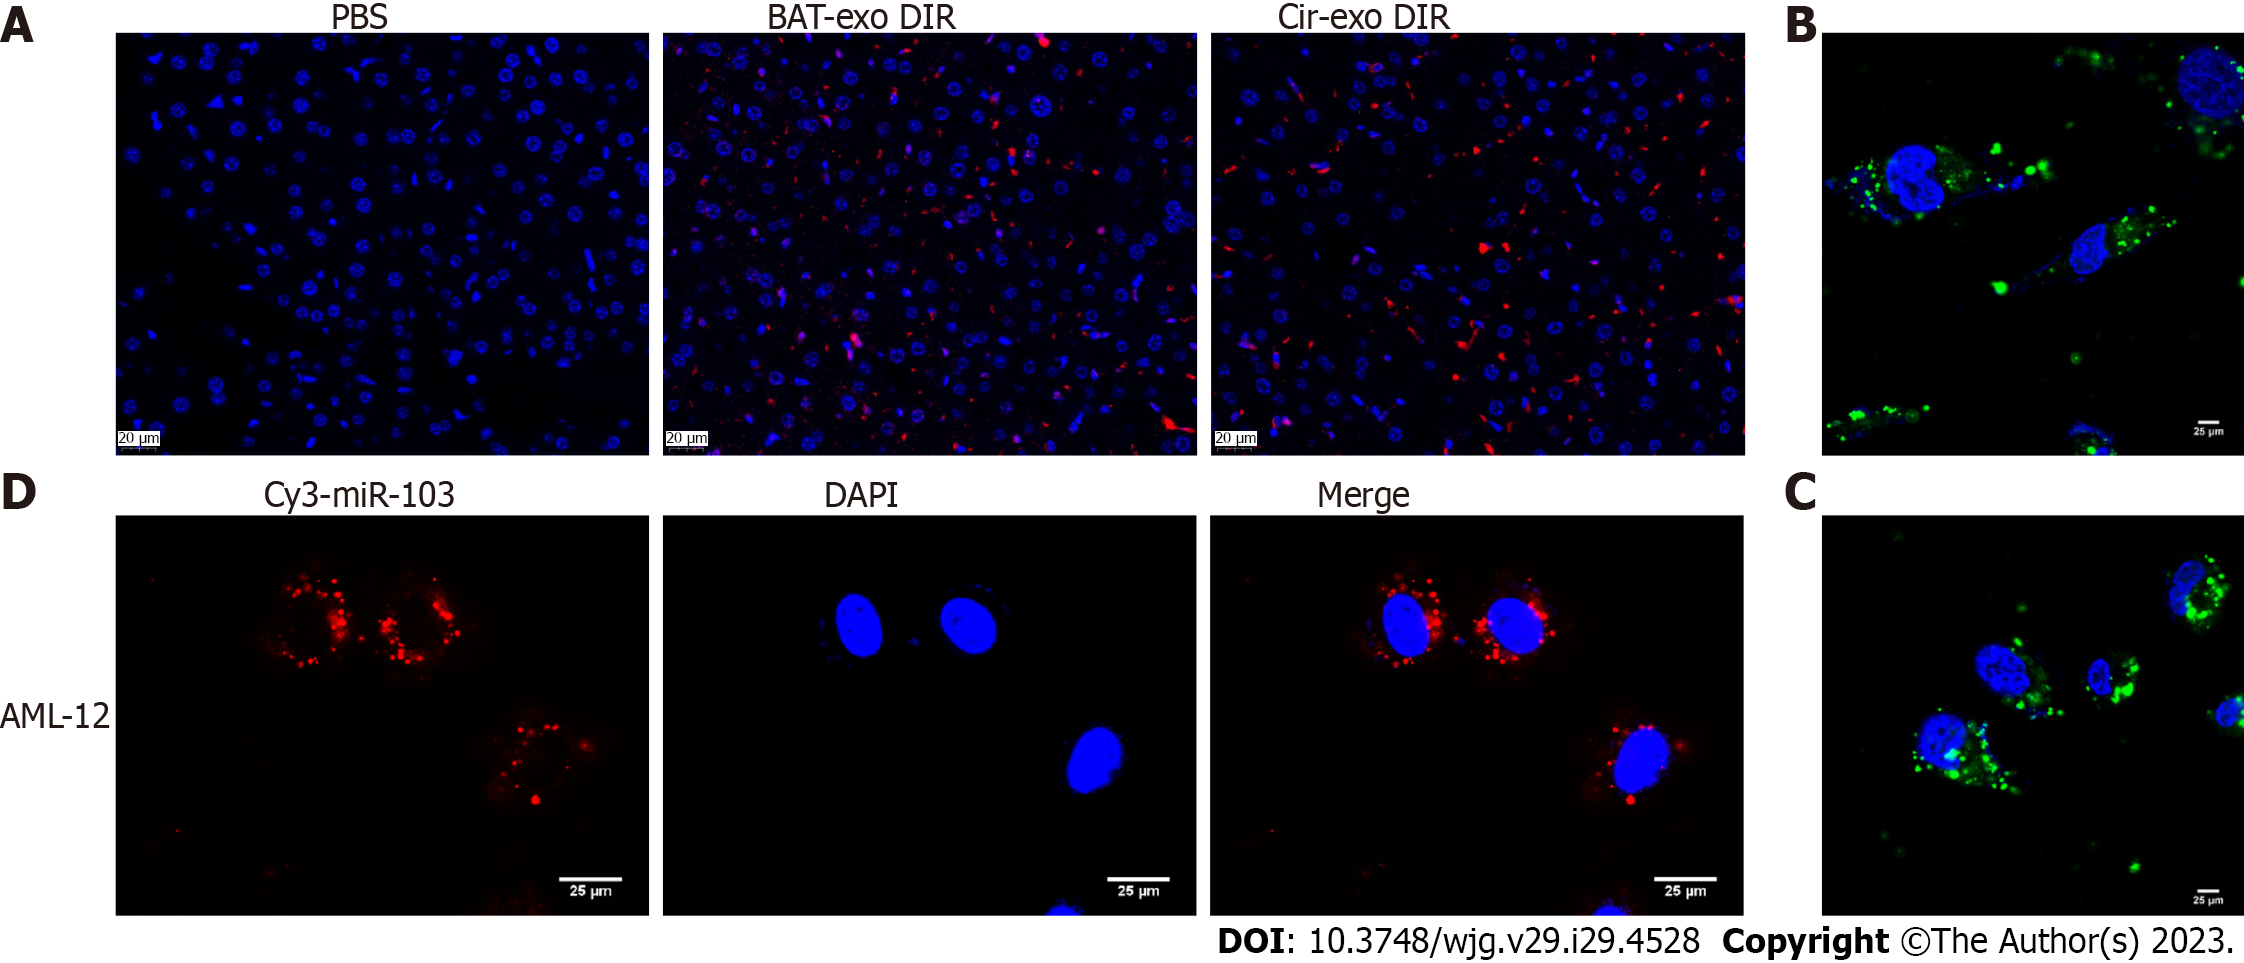
Figure 4 MiR-103 transfers from adipocytes to hepatocytes.
A: The fluorescence of liver tissue of mice injected with adipose tissue (AT)-exosomes or phosphate buffered saline; B: AT exosomes can be absorbed into alpha mouse liver 12 (AML-12) cells; C: Circulating exosomes can be absorbed into AML-12 cells; D: Transewell assay confirmed that miR-103 could be transferred from adipocytes to AML-12 cells. BAT: Brown adipose tissue; Exo: Exosomes; DIR: 1,1-dioctadecyl-3,3,3,3-tetramethylindotricarbocyaine iodide; Cir: Circulating; PBS: Phosphate buffered saline; DAPI: 4’,6-diamidino-2-phenylindole; AML-12: Alpha mouse liver 12.
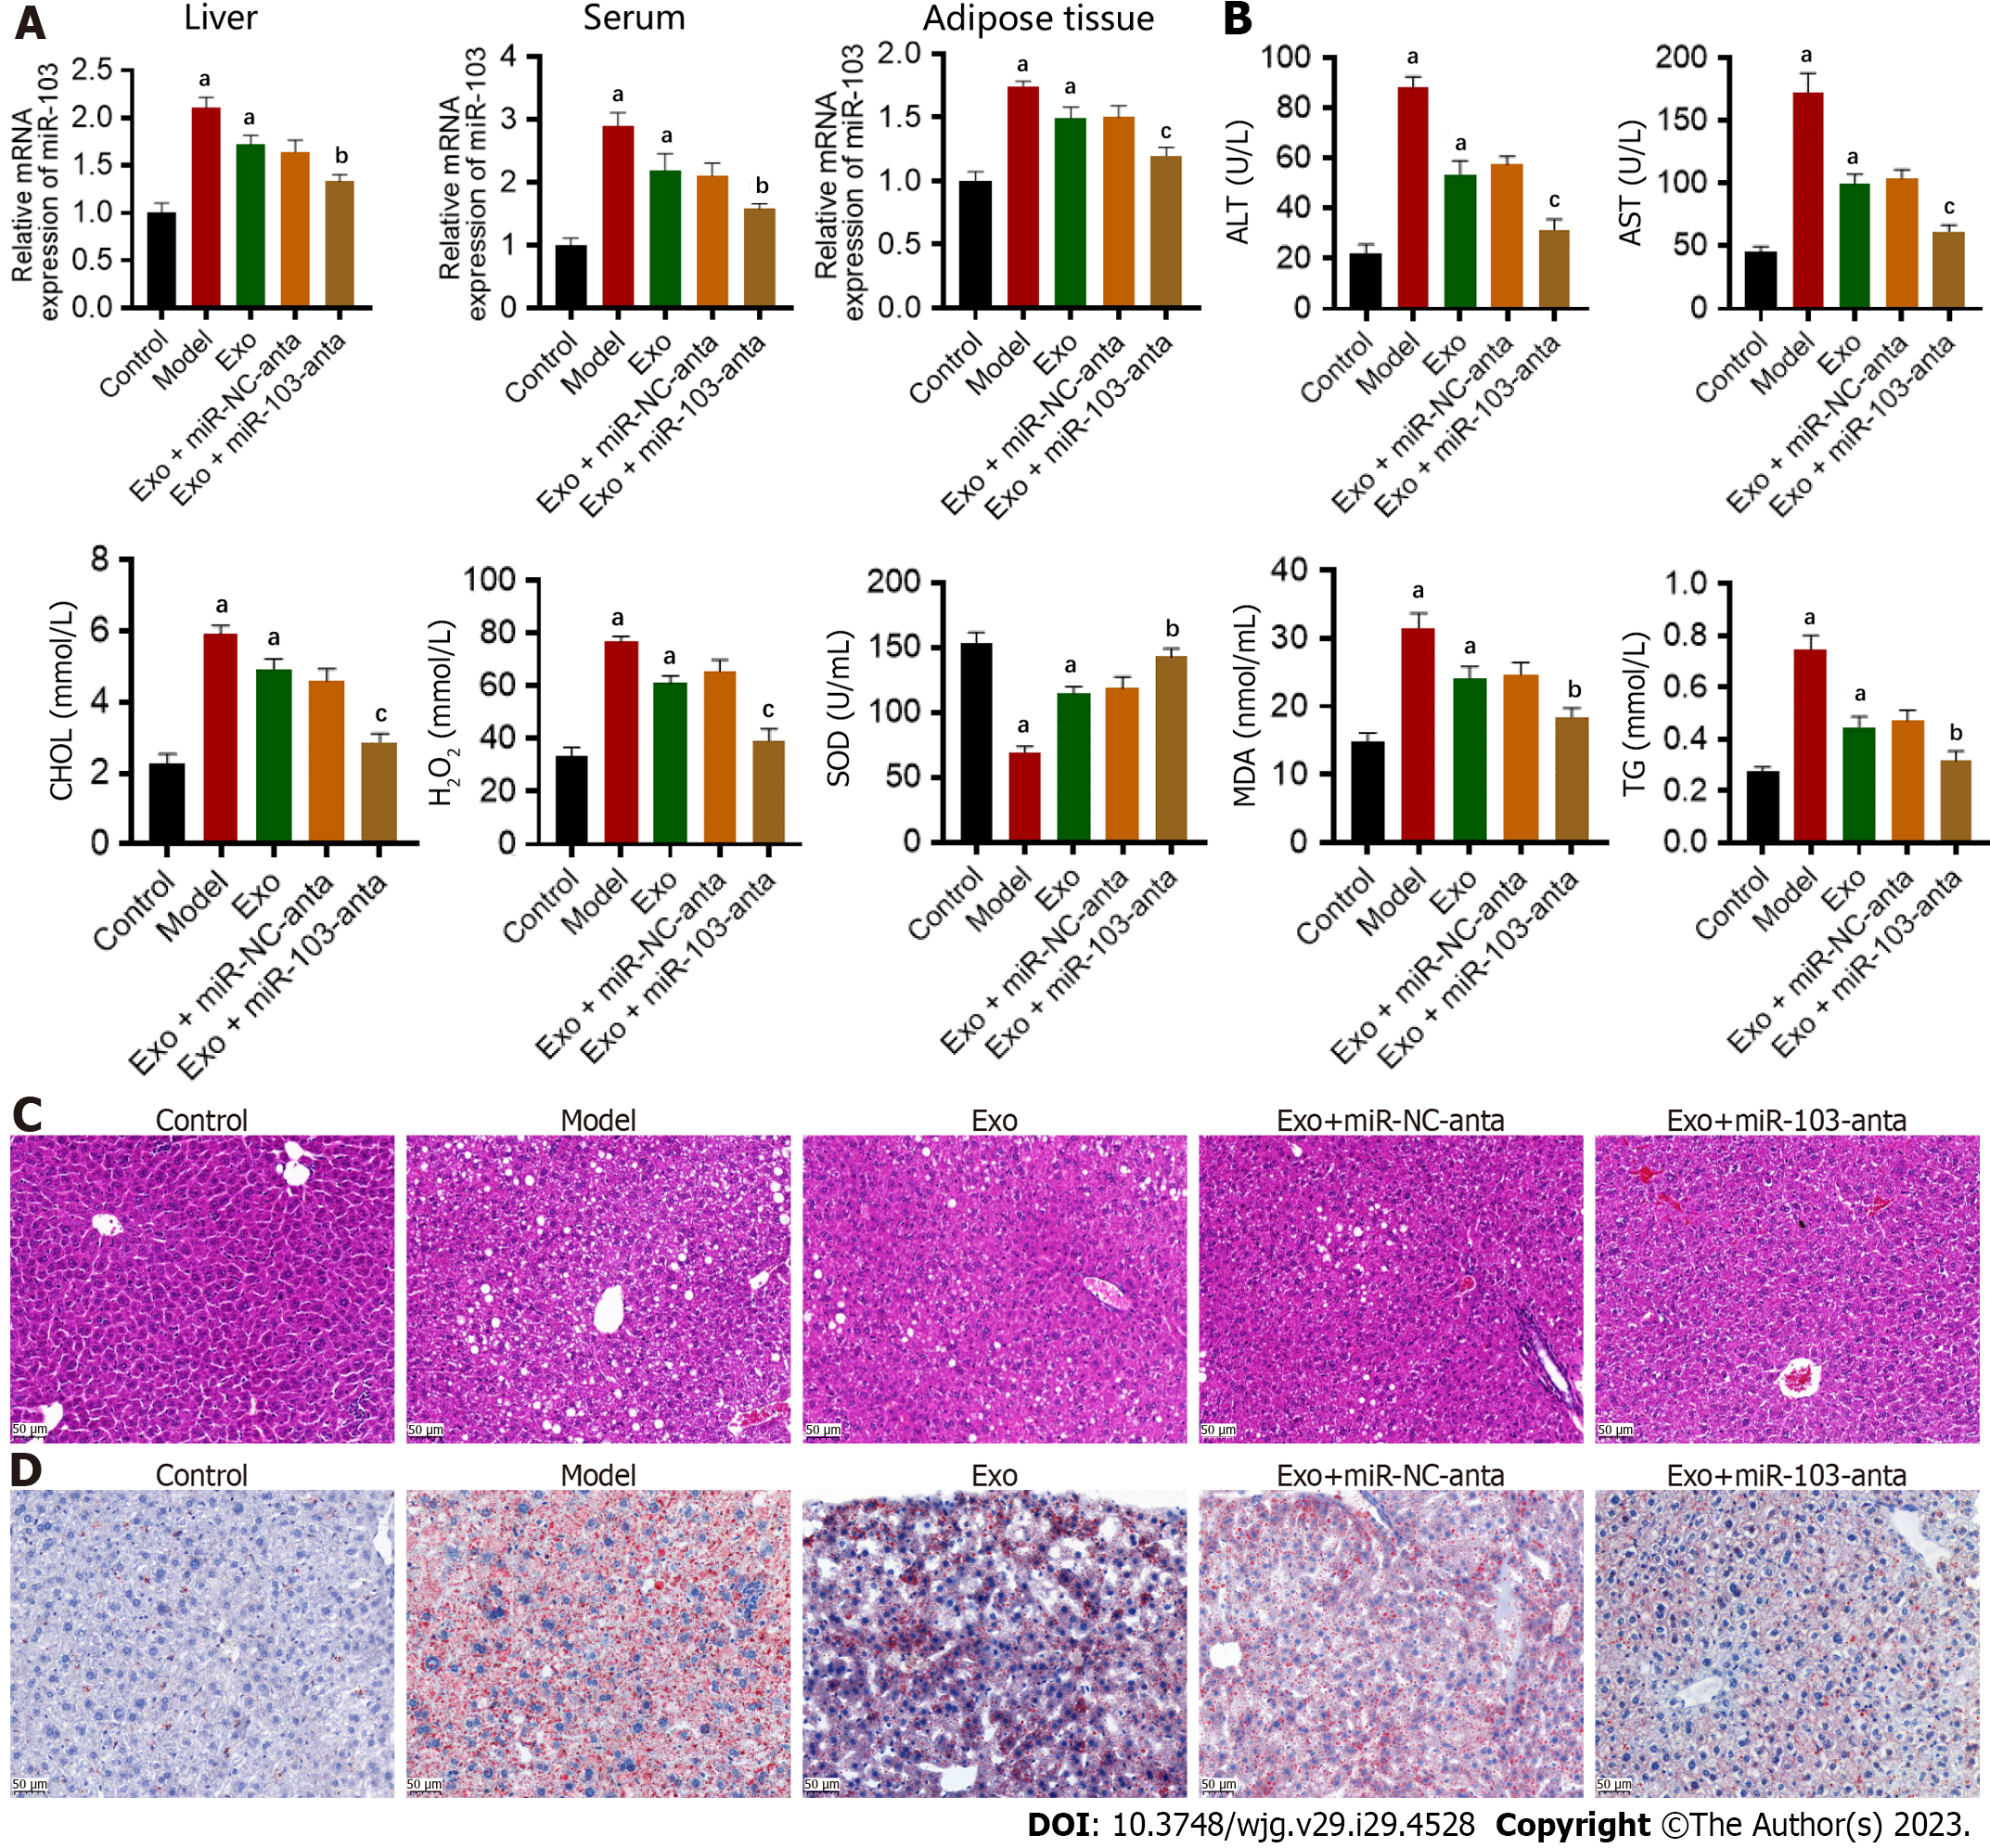
Figure 5 The effect of adipose tissue-derived exosomes miR-103 on the development of non-alcoholic steatohepatitis in mice.
A: The expression of miR-103 in the liver, serum, and adipose tissue; B: The results of ELISA to measure serum alanine aminotransferase, aspartate aminotransferase, total triglycerides, total cholesterol, superoxide dismutase, malondialdehyde, and H2O2; C: Hematoxylin and eosin staining of mice liver from different groups; D: Oil-red staining of mice liver from different groups. aP < 0.01 vs control; bP < 0.05 vs exosomes; cP < 0.01 vs exosomes. Exo: Exosomes; NC: Negative control; ALT: Alanine aminotransferase; AST: Aspartate aminotransferase; TG: Total triglycerides; CHOL: Cholesterol; SOD: Superoxide dismutase; MDA: Malondialdehyde.
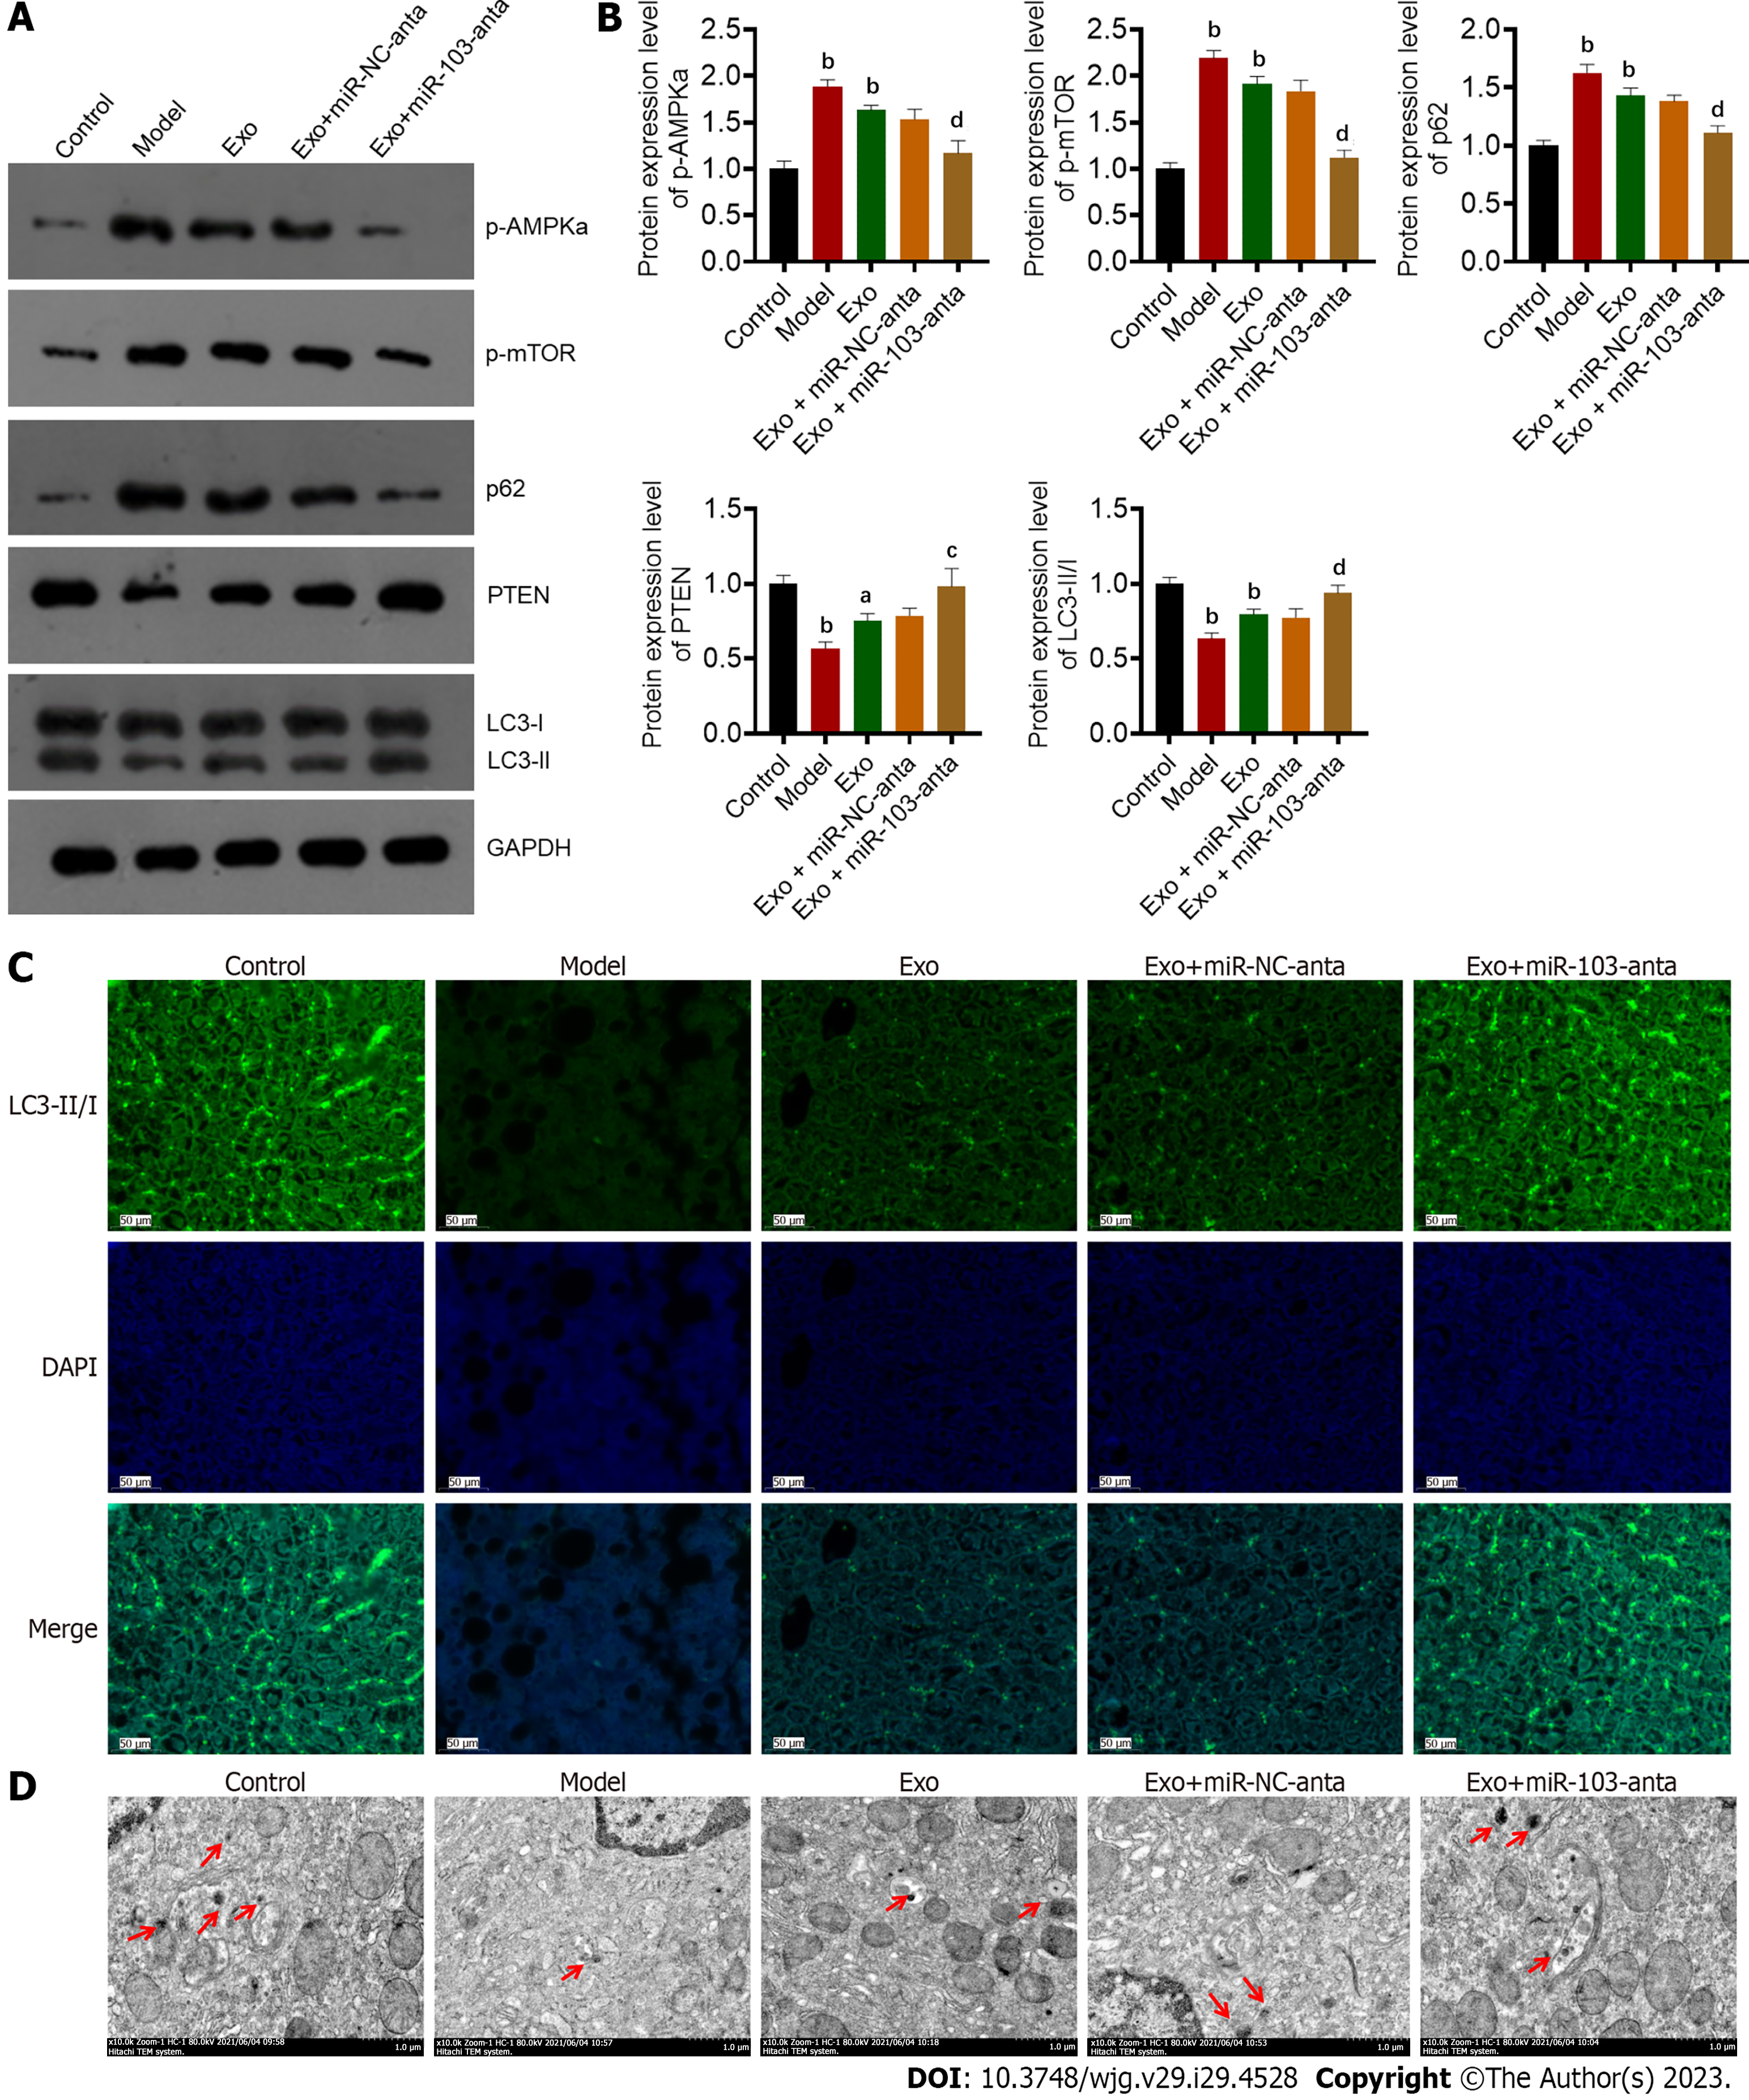
Figure 6 The effect of adipose tissue-derived exosomes miR-103 on autophagy in mice.
A and B: Western blotting detected the expression of the autophagy-related protein; C: The results of immunofluorescence staining to observe autophagosomes in the liver from different groups; D: Transmission electron microscopy images of autophagosomes (red arrowhead) in the liver from different groups. aP < 0.05 vs control; bP < 0.01 vs control; cP < 0.05 vs exosomes; dP < 0.01 vs exosomes. Exo: Exosomes; PTEN: Phosphatase and tensin homolog; DAPI: 4’,6-diamidino-2-phenylindole; mTOR: Mammalian target of rapamycin; NC: Negative control.
Figure 7 The hypothesis of obesity-induced non-alcoholic steatohepatitis.
The increased adipocyte tissue will secret more adipose tissue (AT)-derived exosomes, which include various contents, and miR-103 is our focus. The increased AT-derived exosomes miR-103 could be absorbed by hepatocytes and further regulate non-alcoholic steatohepatitis progression by affecting the autophagy process by targeting phosphatase and tensin homolog gene. AT: Adipose tissue; NASH: Non-alcoholic steatohepatitis; Exo: Exosomes; PTEN: Phosphatase and tensin homolog.
- Citation: Lu MM, Ren Y, Zhou YW, Xu LL, Zhang MM, Ding LP, Cheng WX, Jin X. Antagonizing adipose tissue-derived exosome miR-103-hepatocyte phosphatase and tensin homolog pathway alleviates autophagy in non-alcoholic steatohepatitis: A trans-cellular crosstalk. World J Gastroenterol 2023; 29(29): 4528-4541
- URL: https://www.wjgnet.com/1007-9327/full/v29/i29/4528.htm
- DOI: https://dx.doi.org/10.3748/wjg.v29.i29.4528


