Copyright
©The Author(s) 2023.
World J Gastroenterol. Jul 14, 2023; 29(26): 4186-4199
Published online Jul 14, 2023. doi: 10.3748/wjg.v29.i26.4186
Published online Jul 14, 2023. doi: 10.3748/wjg.v29.i26.4186
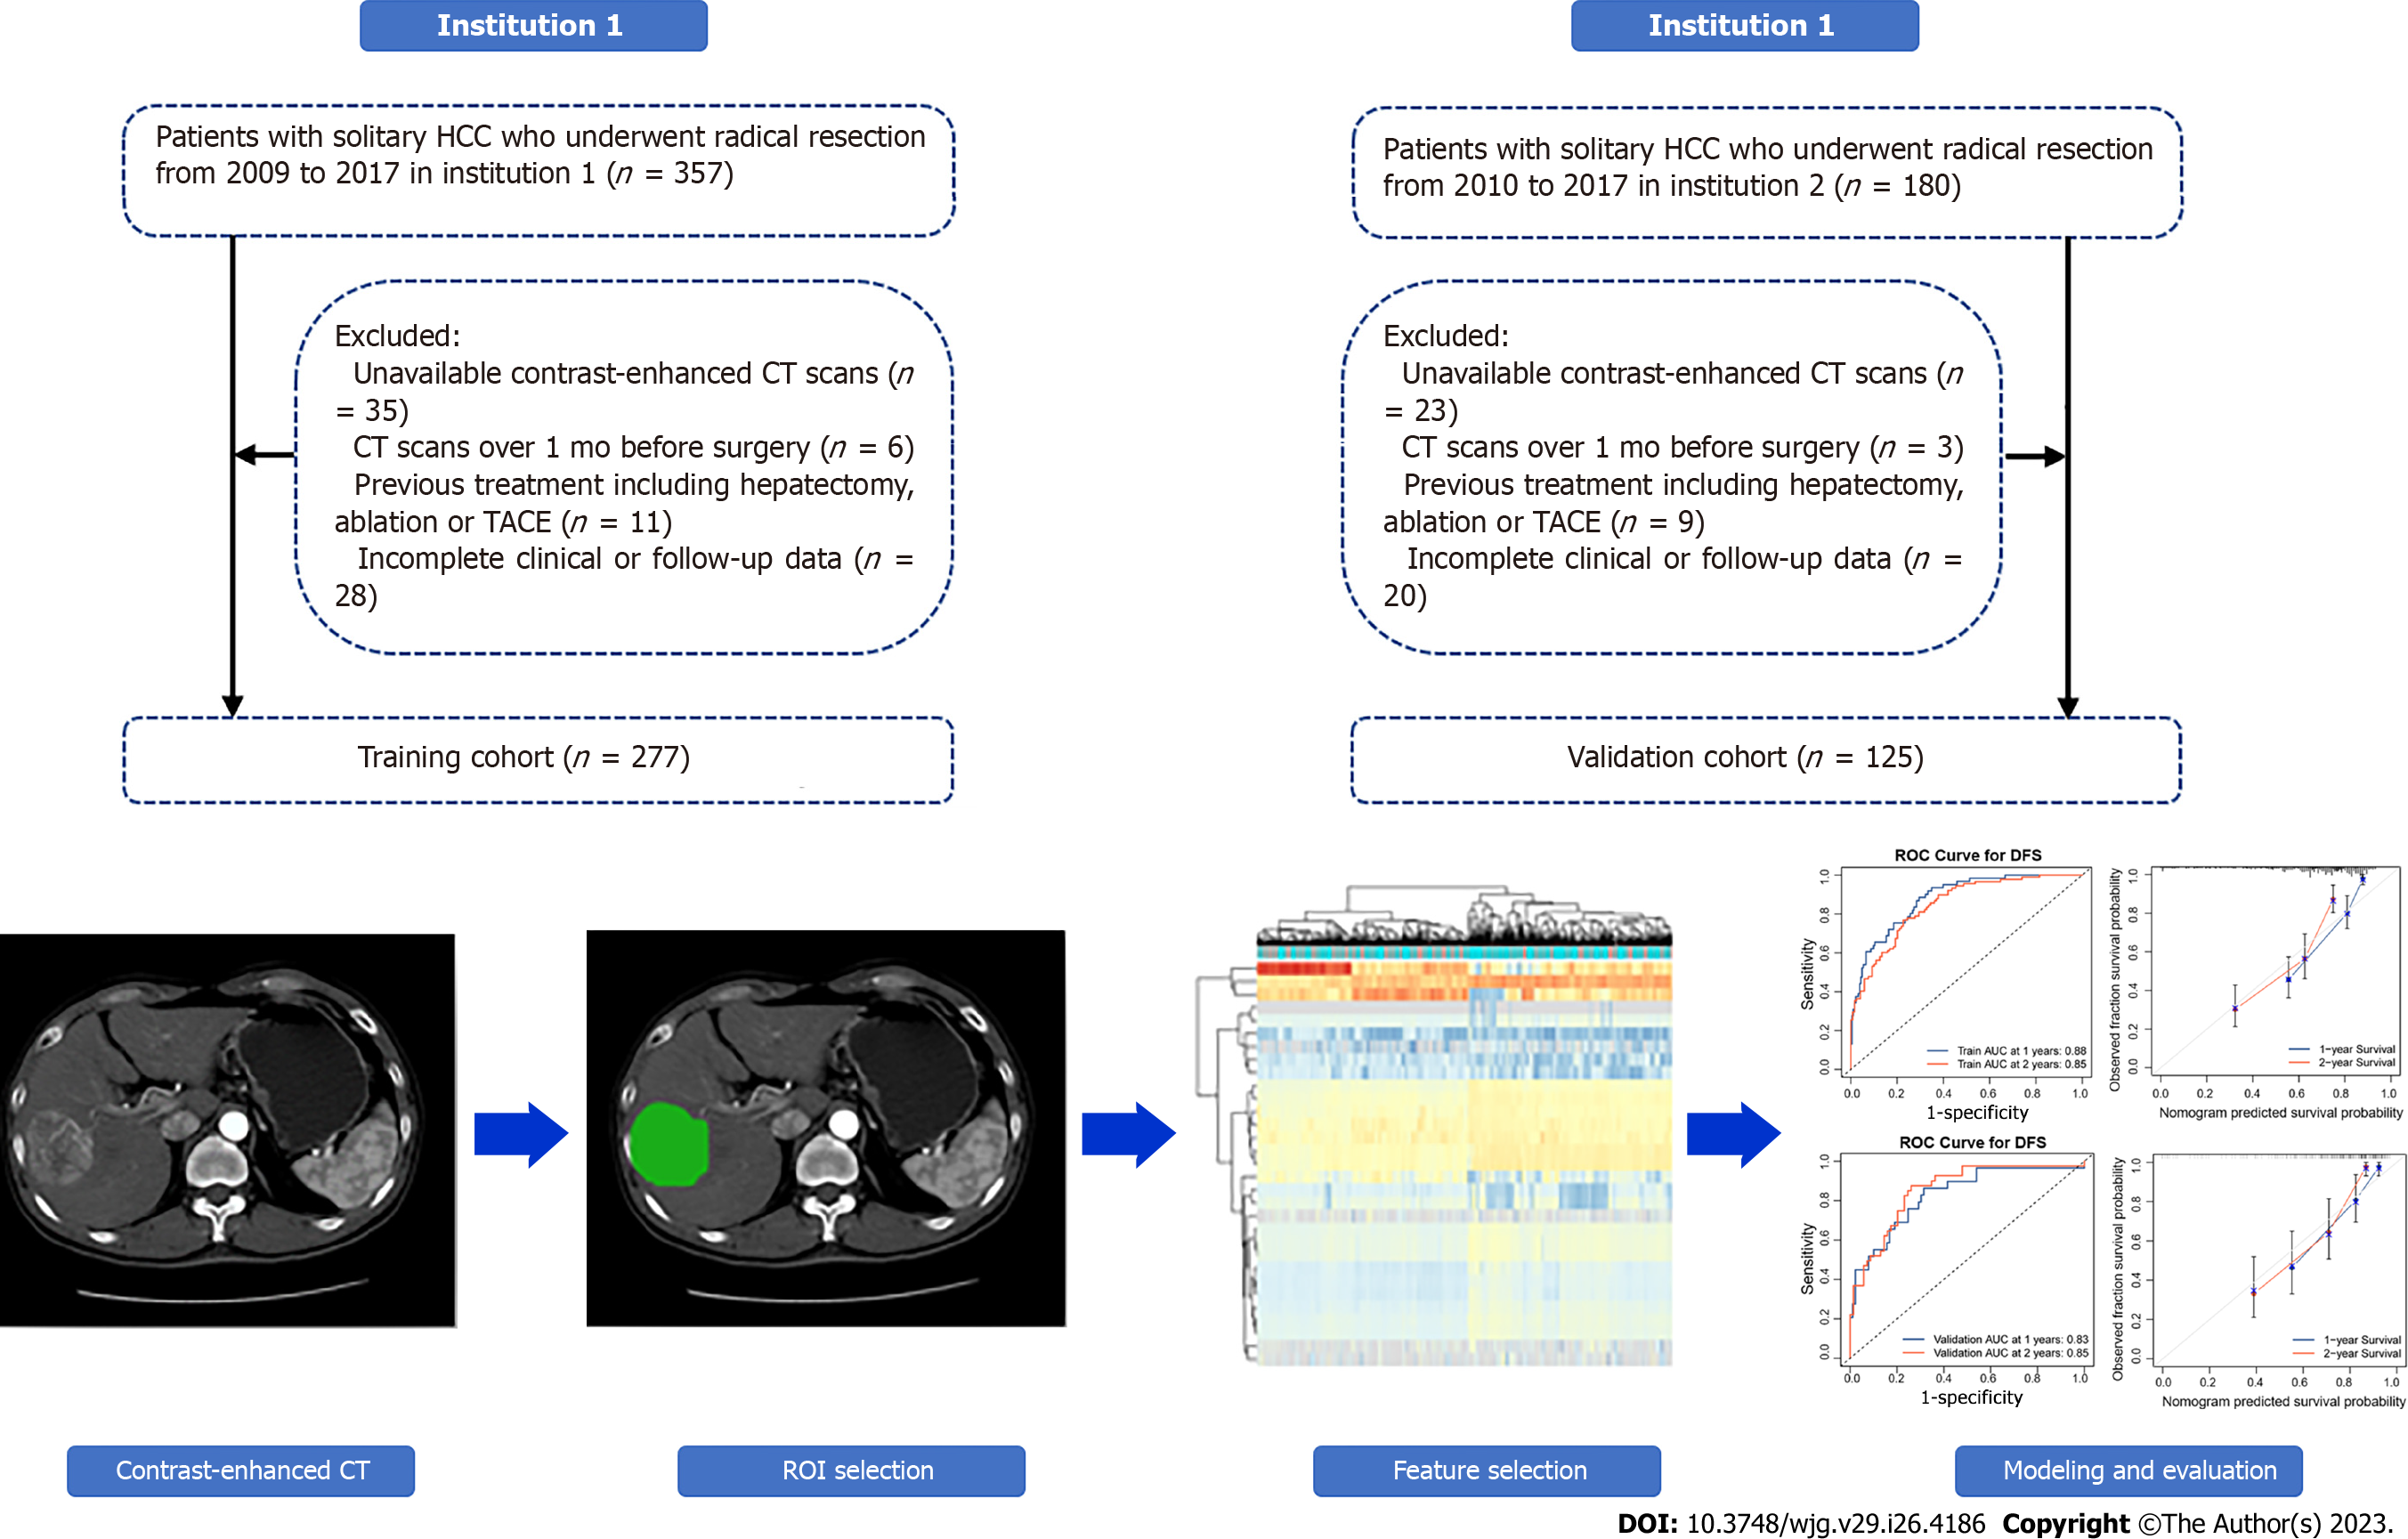
Figure 1 Flowchart of the study cohorts.
HCC: Hepatocellular carcinoma; CT: Computed tomography; TACE: Transarterial chemoembolization; ROI: Region of interest.
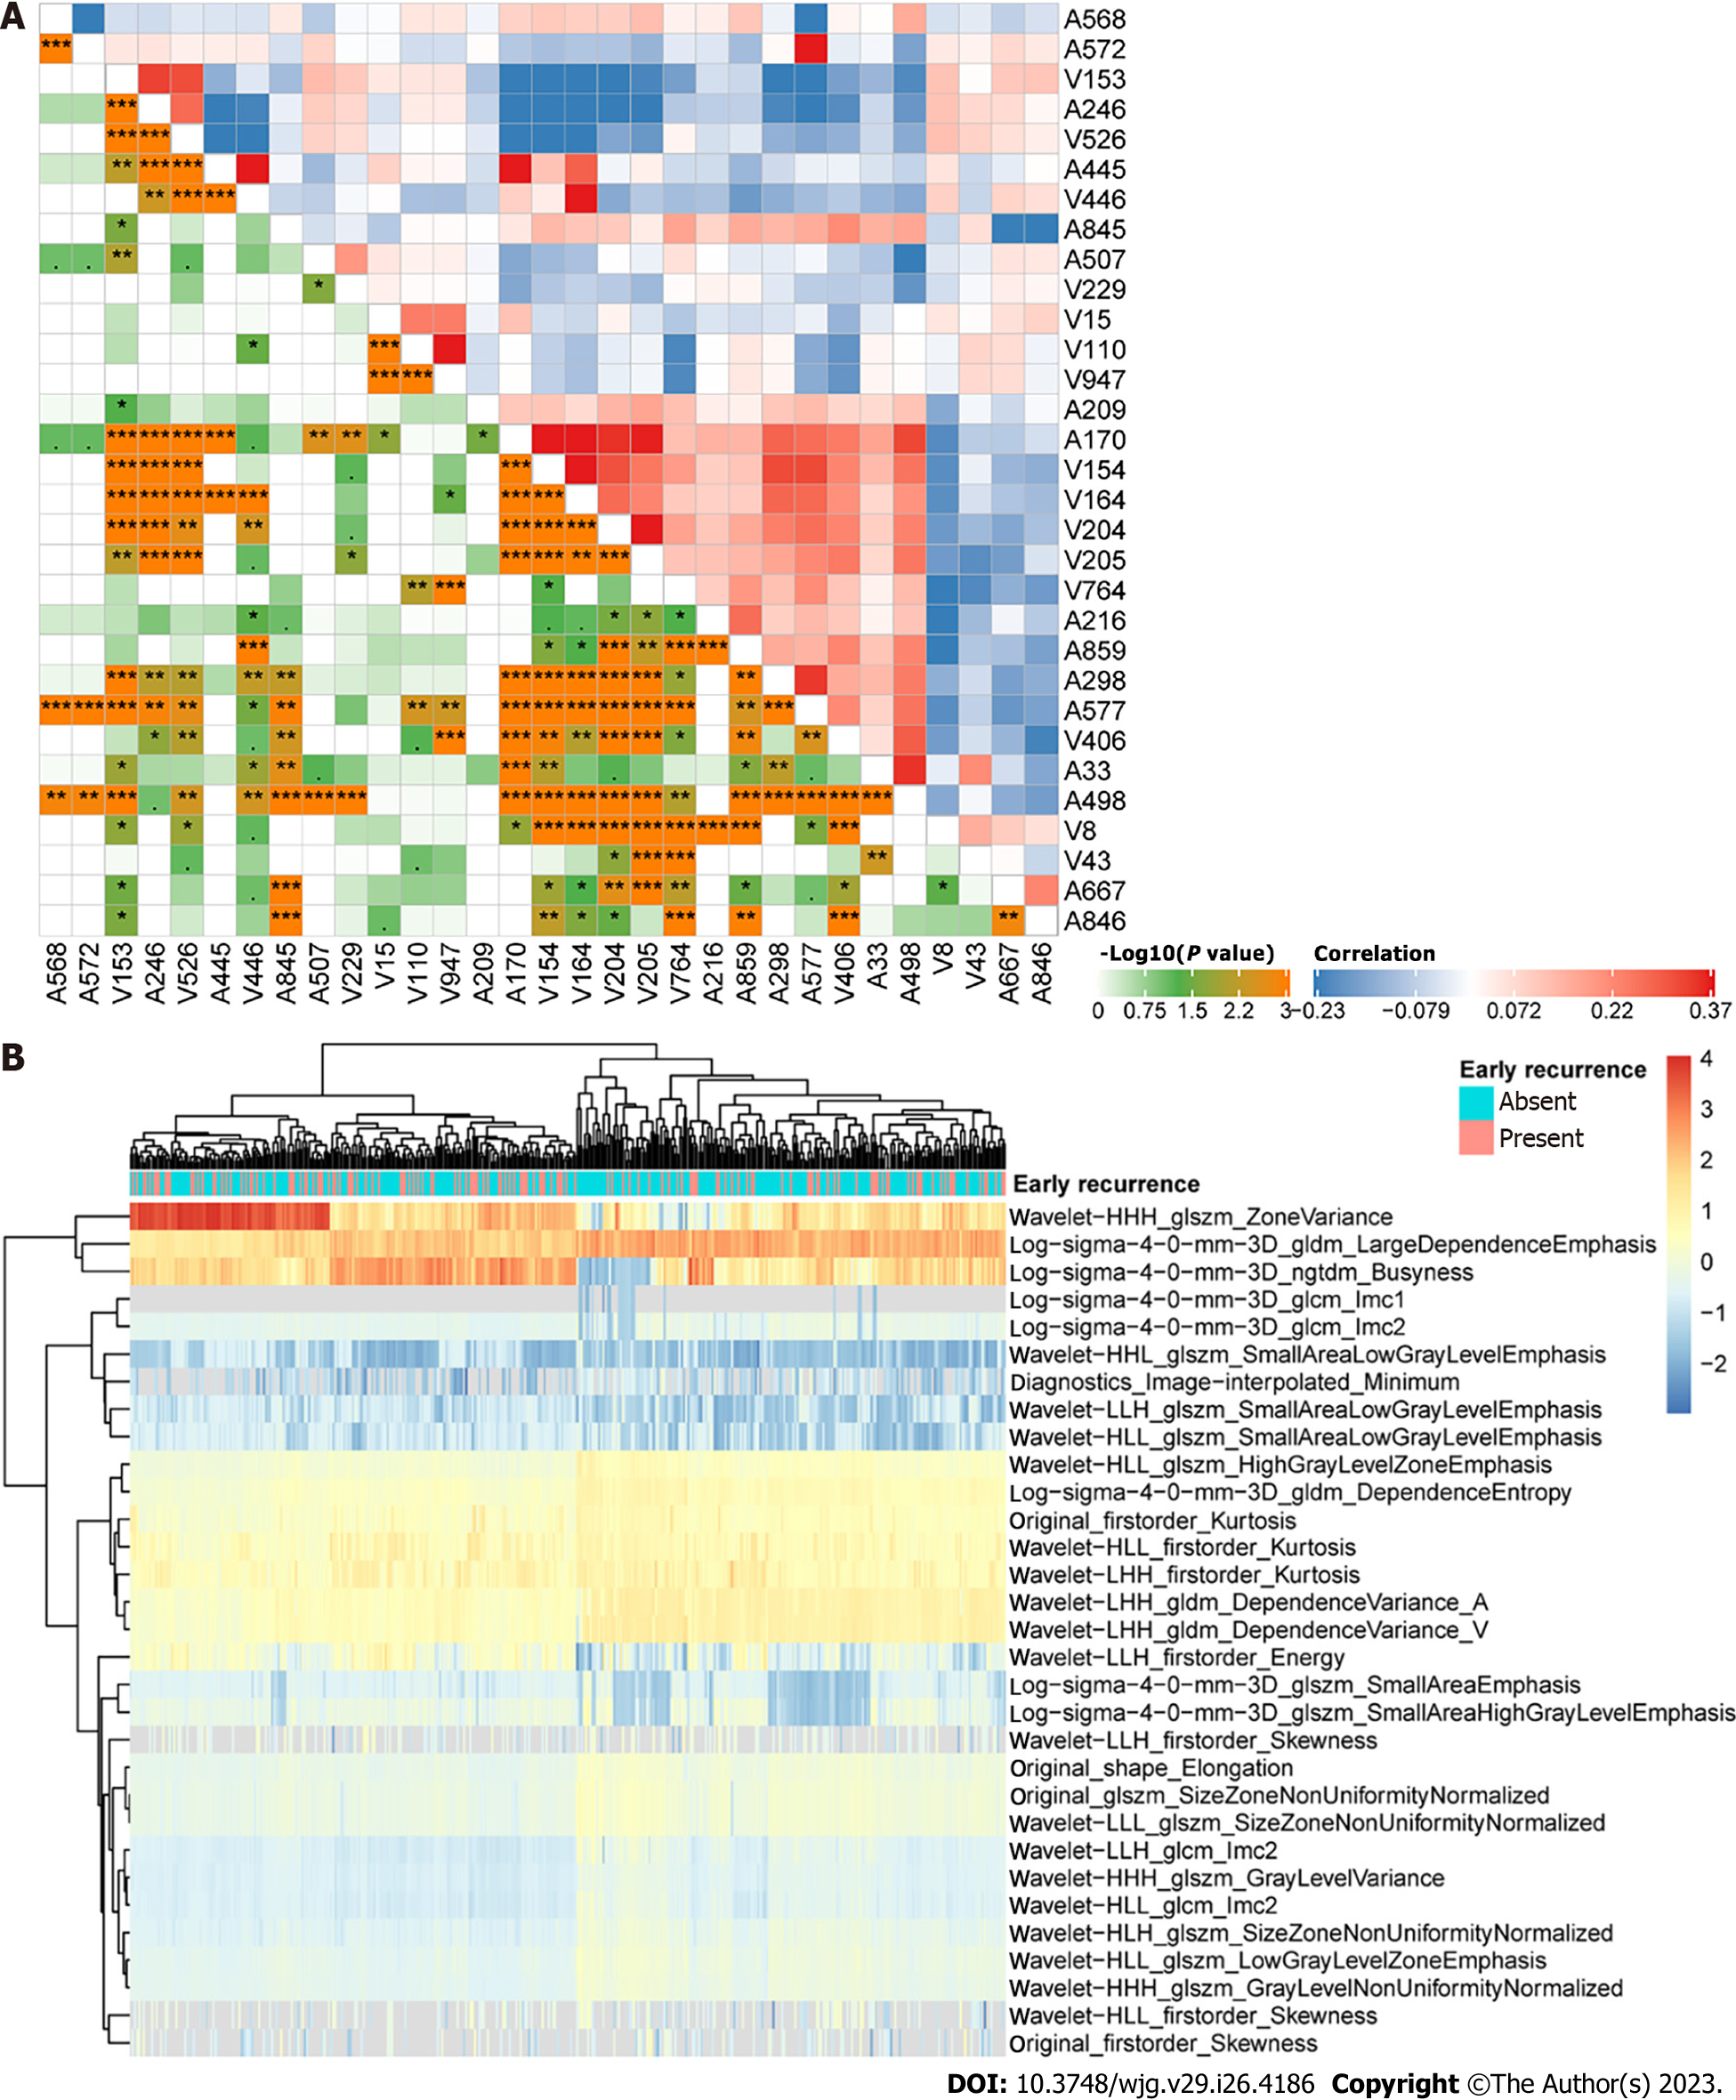
Figure 2 Correlation and distribution of early recurrence-related radiomics features.
A: Correlation of the radiomics features. The red mark represents a positive correlation, while the blue mark represents a negative correlation; B: Heatmap and clustering analysis of the radiomics features. ROC: Receiver operating characteristic; RFS: Recurrence-free survival; AUC: Area under curve.
Figure 3 Capacity of the radiomics score to distinguish early recurrence.
A: Correlation of the rad-score between the nonearly recurrence and early recurrence groups; B: Receiver operating characteristic curves of the radiomics score to predict recurrence-free survival in the training and validation cohorts.
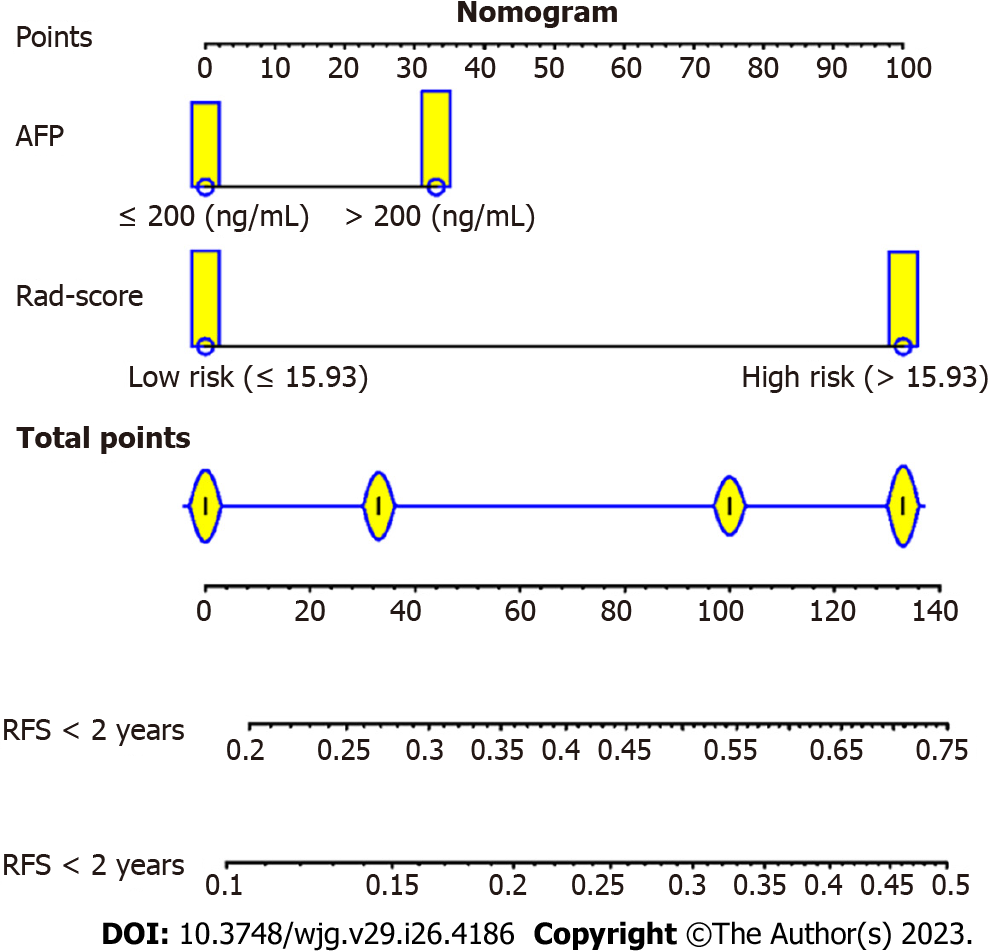
Figure 4 A radiomics and clinical combined model is built based on the radiomics score and preoperative alpha-fetoprotein.
According to the total score of each indicator, the recurrence rate corresponding to the total score is the nomogram-predicted rate. AFP: Alpha-fetoprotein; RFS: Recurrence-free survival.
Figure 5 Evaluation of the radiomics model to predict early recurrence.
A: Receiver operating characteristic (ROC) curves to predict 1- and 2-year recurrence-free survival (RFS) in the training cohort; B: ROC curves to predict 1- and 2-year RFS in the validation cohort; C: Calibration curves of the 1- and 2-year RFS in the training cohort; D: Calibration curves of the 1- and 2-year RFS in the validation cohort; E: Decision curve analysis of the combined model in the training cohort; F: Decision curve analysis of the combined model in the validation cohort. ROC: Receiver operating characteristic; RFS: Recurrence-free survival; AUC: Area under curve.
Figure 6 Cumulative rates of early recurrence and survival rates of hepatocellular carcinoma.
A: Risk accumulation curve of recurrence-free survival (RFS) in the training cohort; B: Survival curve of overall survival (OS) in the training cohort; C: Risk accumulation curve of RFS in the validation cohort; D: Survival curve of OS in the validation cohort; E and F: Risk accumulation curve of RFS in the alpha-fetoprotein (AFP)-negative group in the training and validation cohorts; G and H: Risk accumulation curve of RFS in the AFP-positive group in the training and validation cohorts. AFP: Alpha fetoprotein.
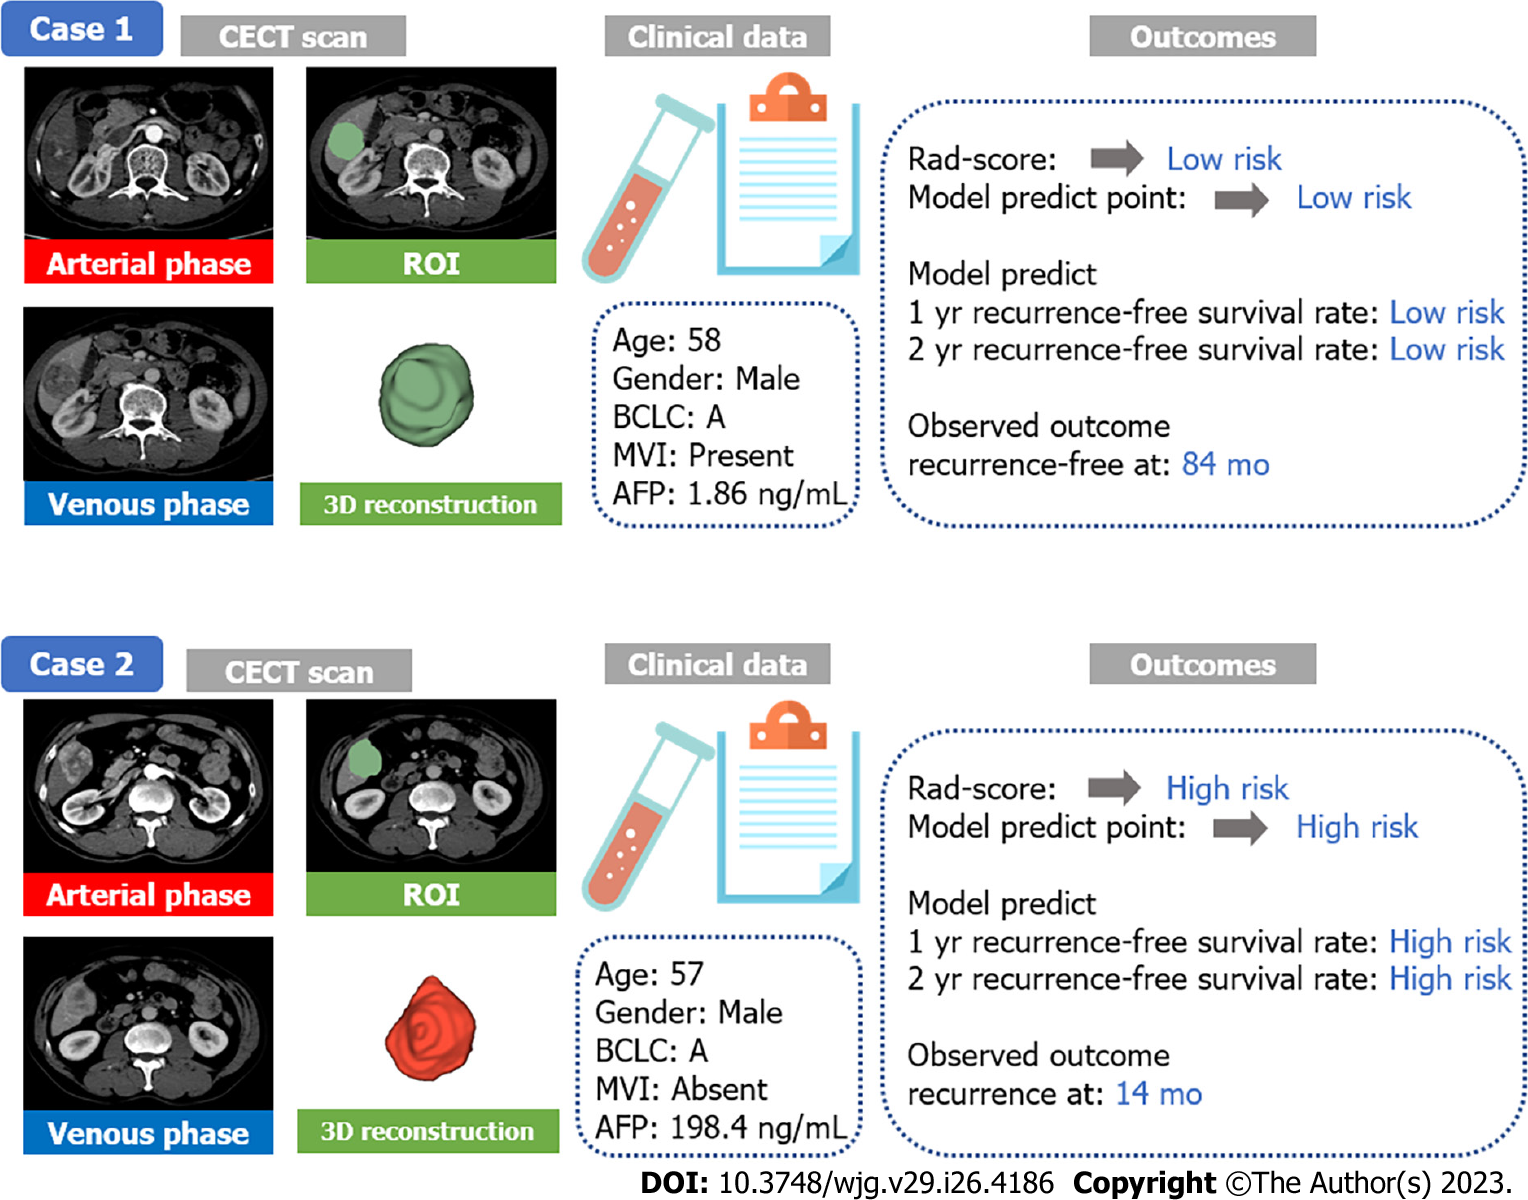
Figure 7 Representative case reports.
AFP: Alpha-fetoprotein; BCLC: Barcelona Clinic Liver Cancer; CECT: Contrast-enhanced computed tomography; MVI: Microvascular invasion; ROI: Regions of interest.
- Citation: Li SQ, Su LL, Xu TF, Ren LY, Chen DB, Qin WY, Yan XZ, Fan JX, Chen HS, Liao WJ. Radiomics model based on contrast-enhanced computed tomography to predict early recurrence in patients with hepatocellular carcinoma after radical resection. World J Gastroenterol 2023; 29(26): 4186-4199
- URL: https://www.wjgnet.com/1007-9327/full/v29/i26/4186.htm
- DOI: https://dx.doi.org/10.3748/wjg.v29.i26.4186


