Copyright
©The Author(s) 2023.
World J Gastroenterol. Jun 21, 2023; 29(23): 3622-3644
Published online Jun 21, 2023. doi: 10.3748/wjg.v29.i23.3622
Published online Jun 21, 2023. doi: 10.3748/wjg.v29.i23.3622
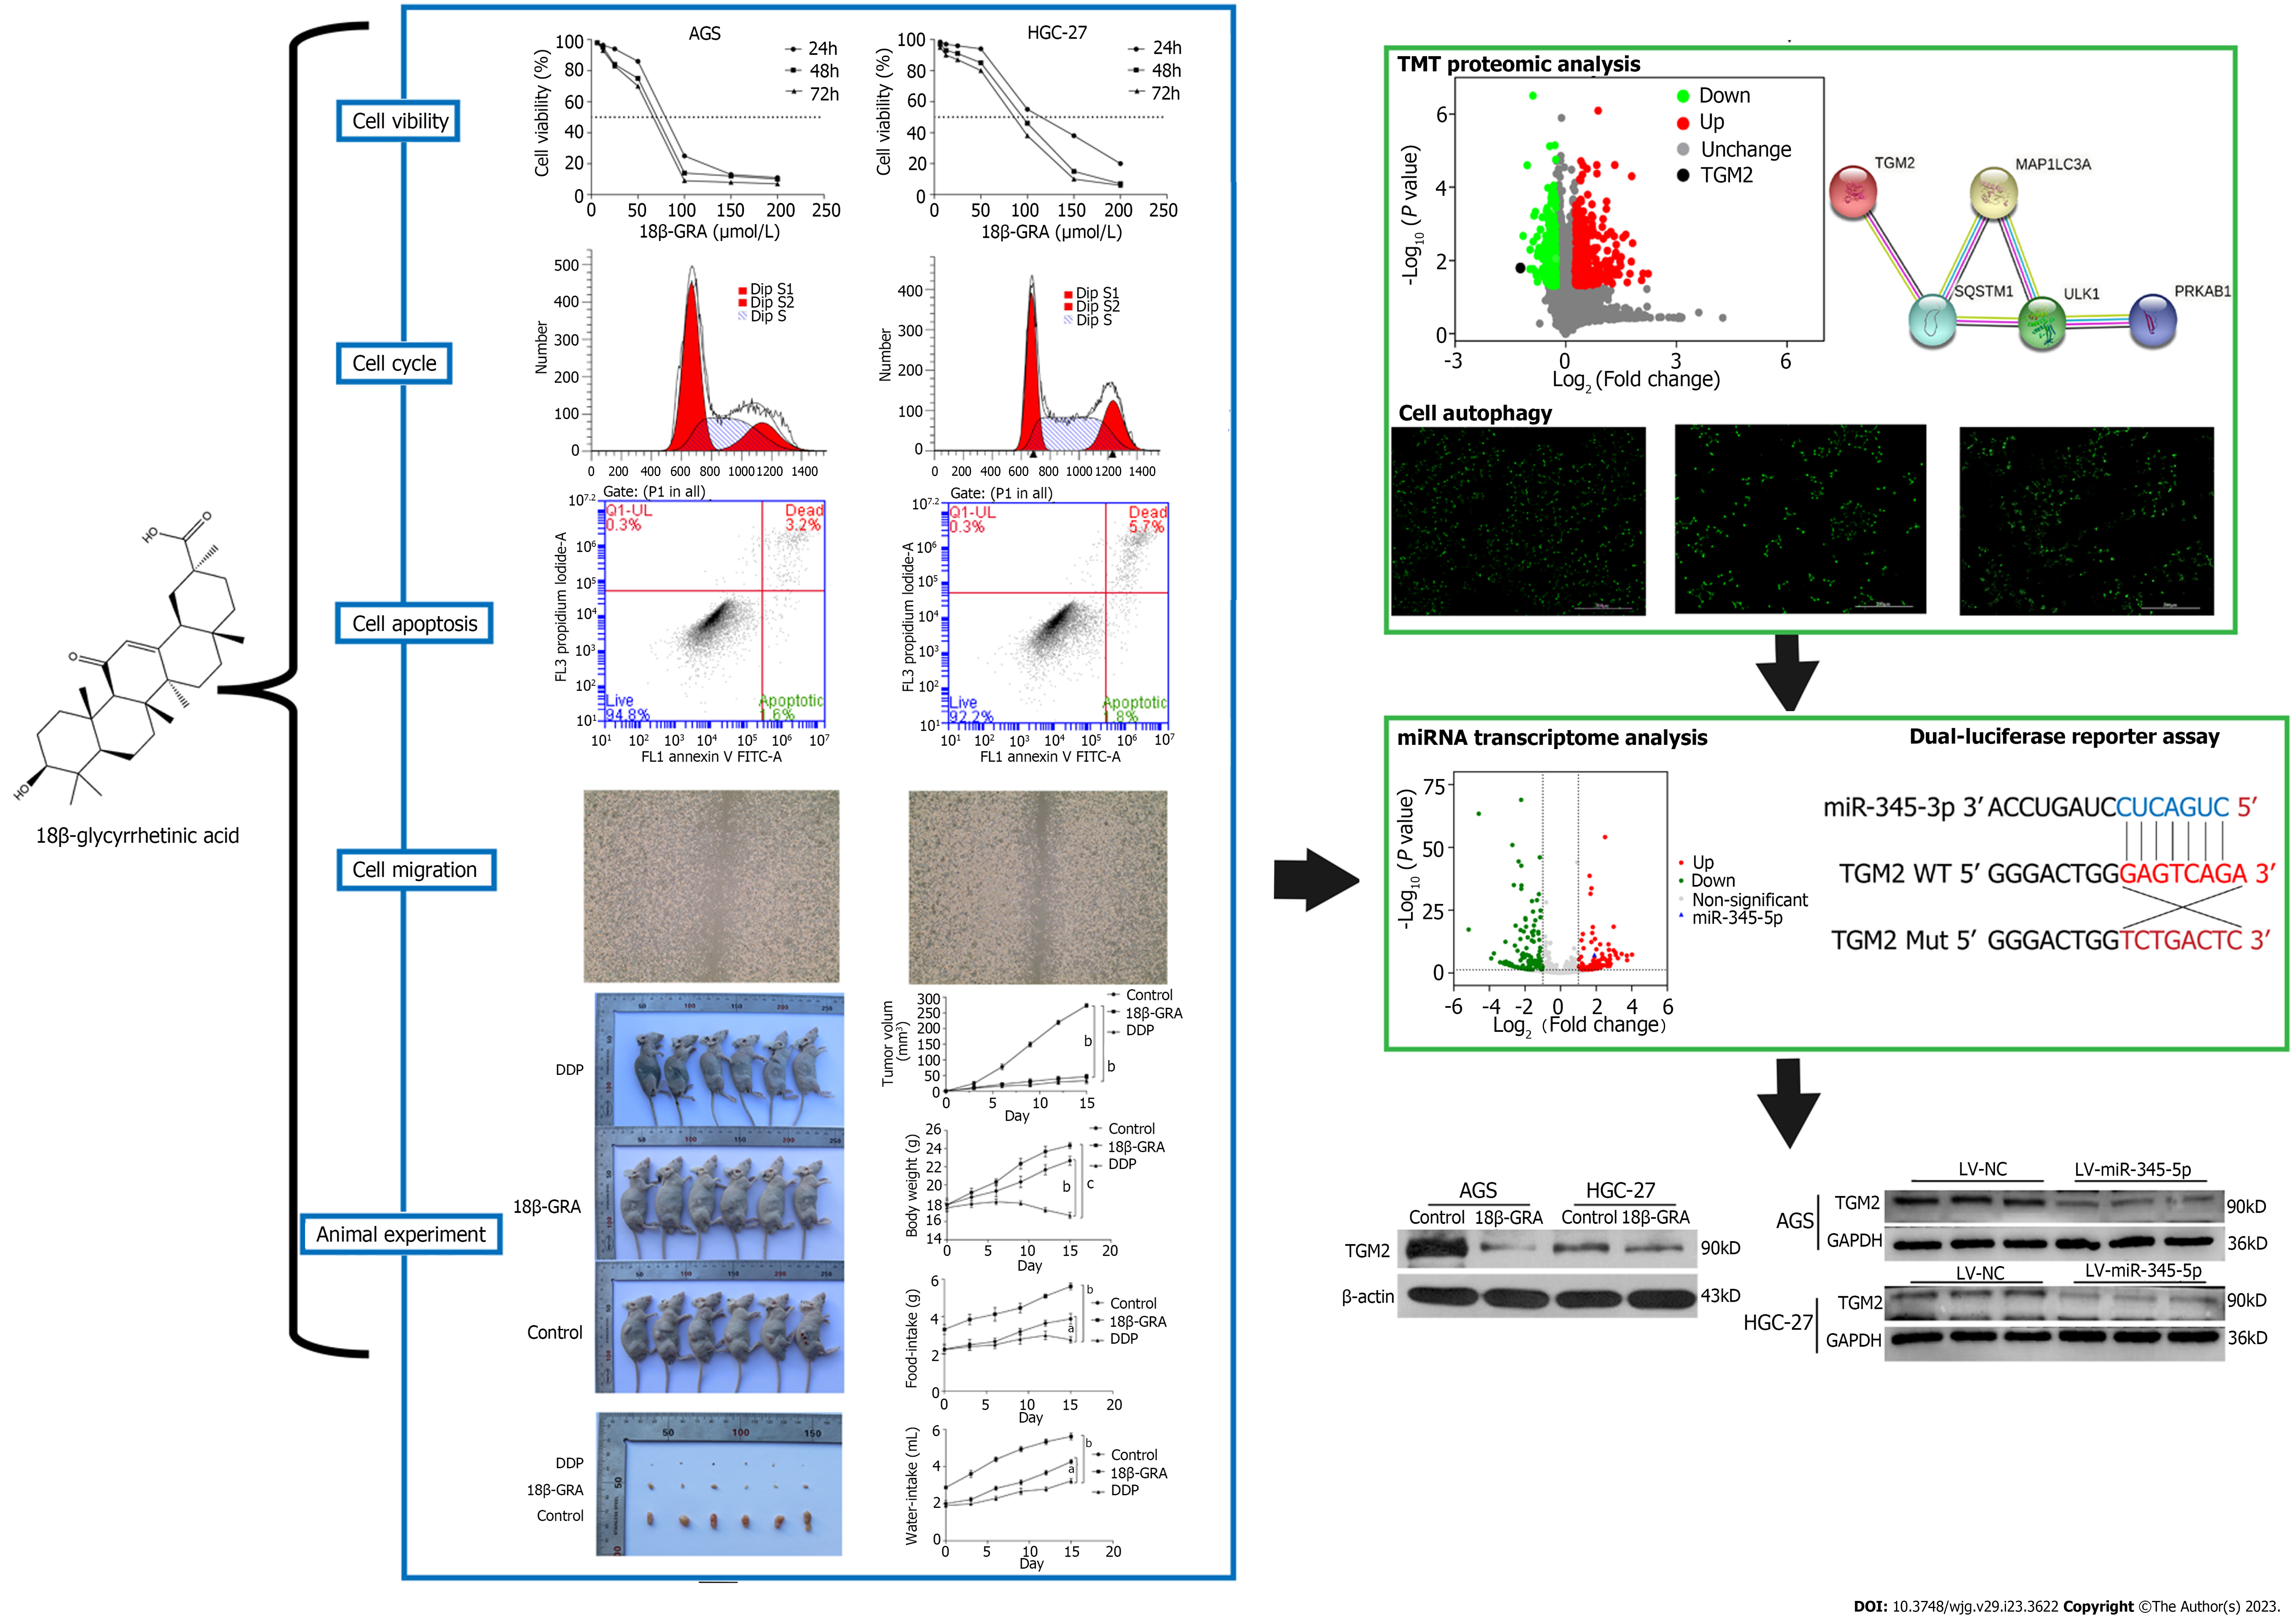
Figure 1 Flow chart.
In this study, we revealed 18β-glycyrrhetinic acid (18β-GRA)’s effect on gastric cancer (GC) cells phenotype and tumor formation in nude mice, and 18β-GRA’s effect on GC cells autophagy. We used TMT proteomic analysis and the STRING database to predict the differentially expressed autophagy-related proteins and their interactions. Later, we verified the link between miR-345-5p and TGM2 using a dual-luciferase reporter assay. Quantitative real-time polymerase chain reaction was used to detect expression of miR-345-5p, western blot was used to detect autophagy-related proteins, and lentivirus transfection technique verified the effect of miR-345-5p on TGM2. LV-NC: Empty lentiviral vector.
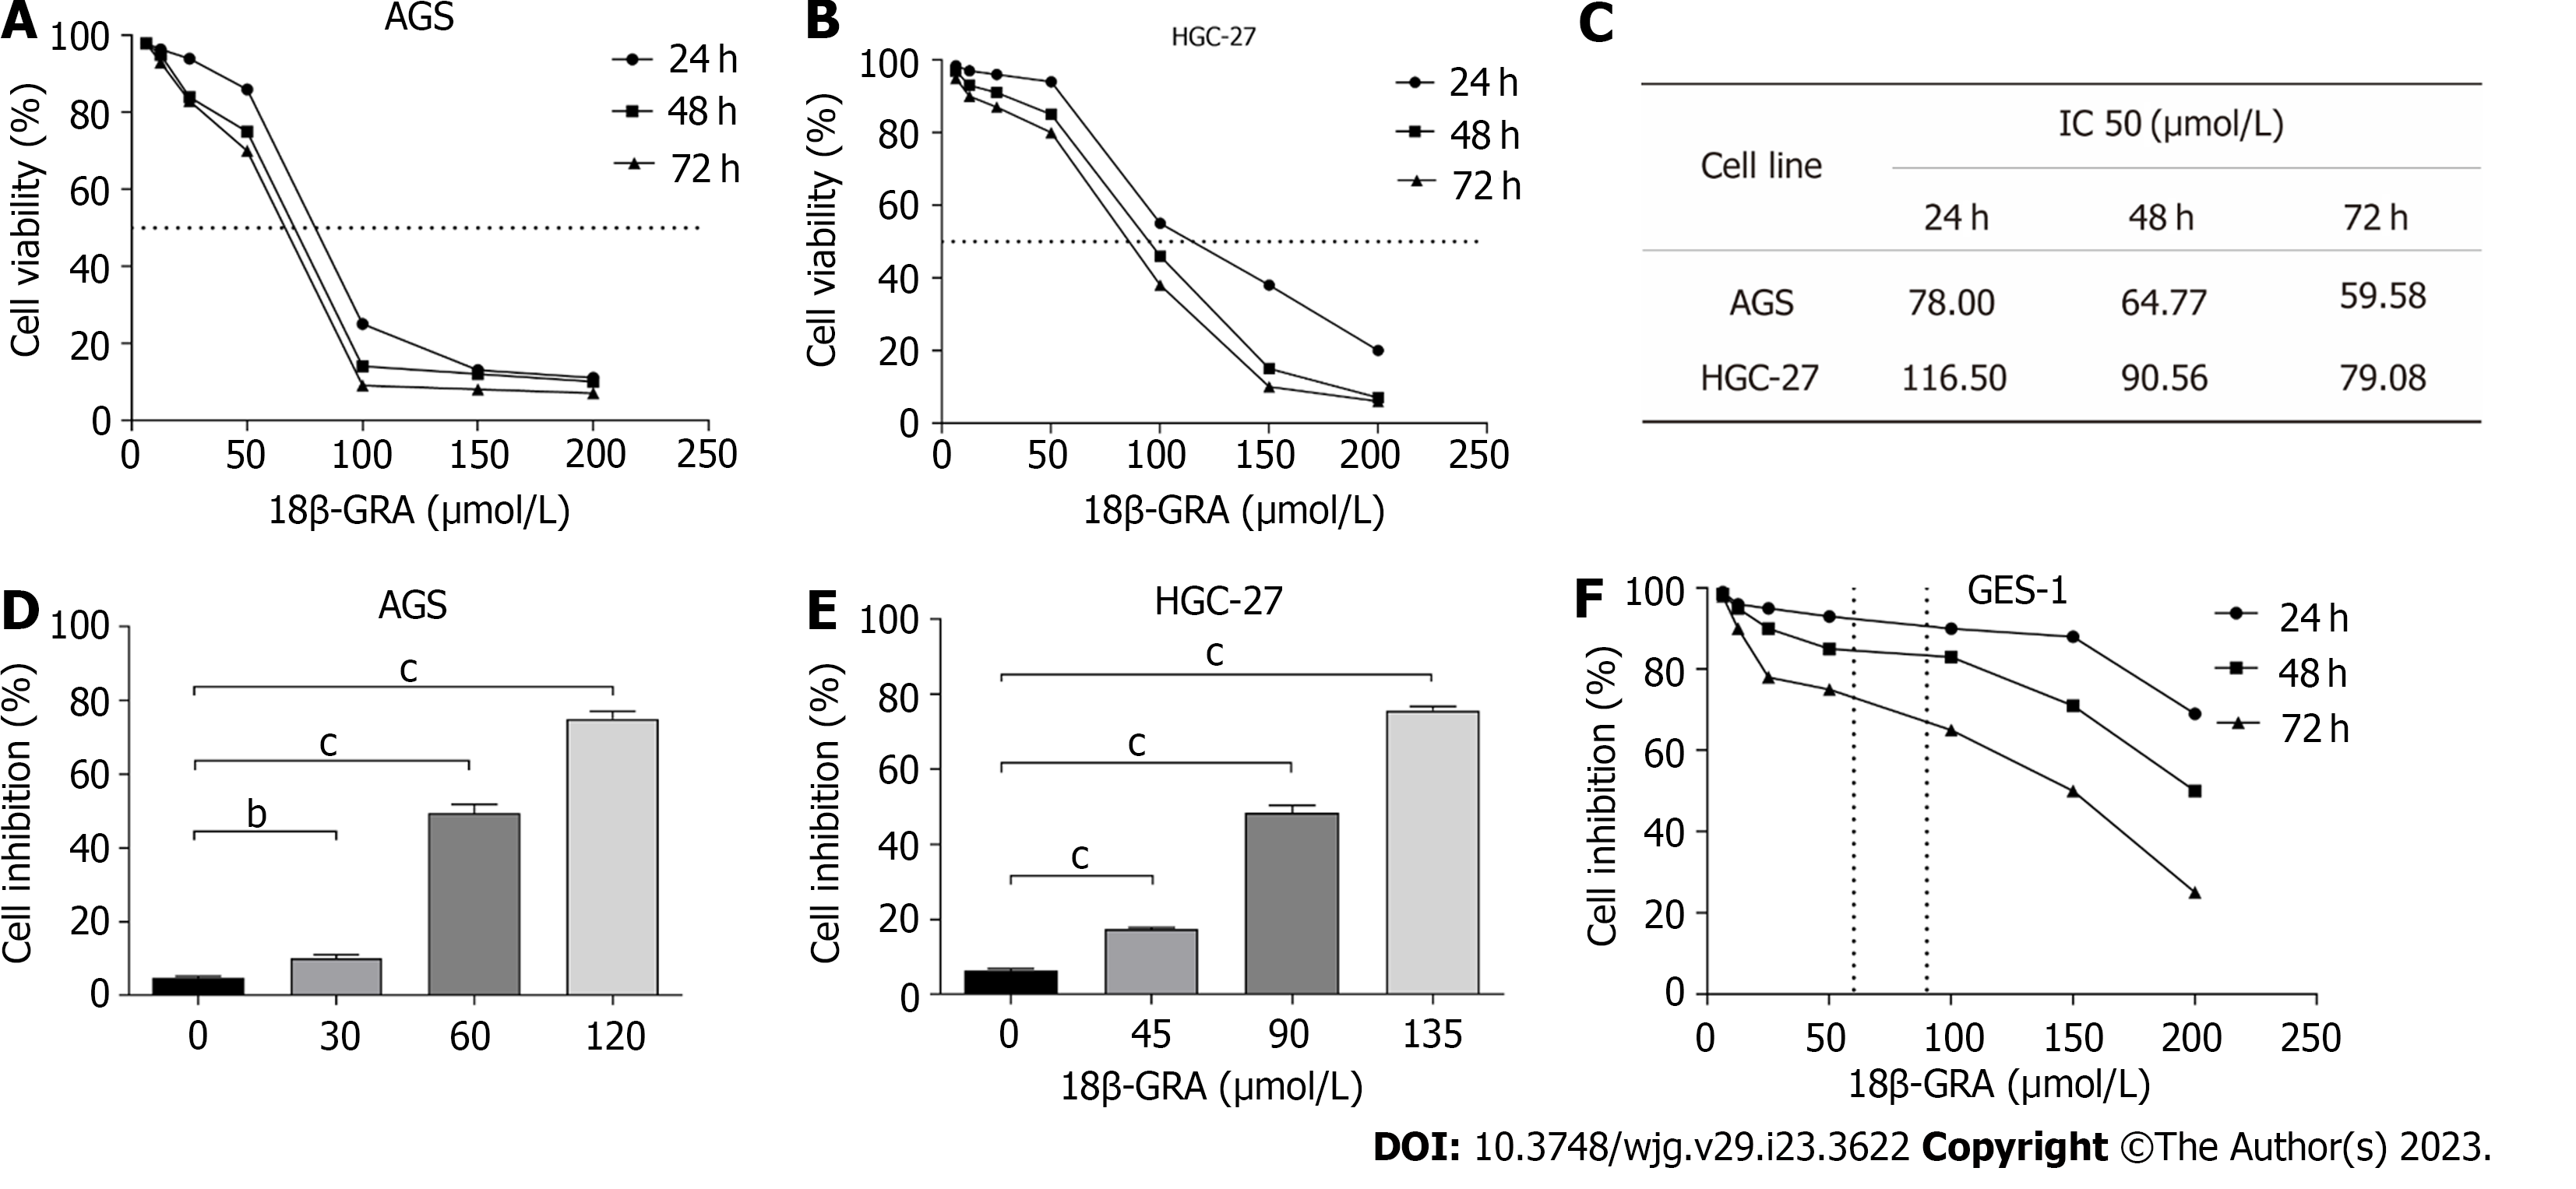
Figure 2 Effect of 18β-glycyrrhetinic acid on cell viability of GES-1, AGS and HGC-27 cells were detected by CCK-8 assay.
A: Effect of 18β-glycyrrhetinic acid (18β-GRA) on cell viability of AGS cells; B: Effect of 18β-GRA on cell viability of HGC-27 cells; C: IC50 value of AGS and HGC-27 cells were treated with 18β-GRA for 24, 48 and 72 h; D: Effect of low, medium and high doses of 18β-GRA on cell viability of AGS cells; E: Effect of low, medium and high doses of 18β-GRA on cell viability of HGC-27 cells; F: Effect of 18β-GRA on cell viability of GES-1 cells. All data are from three independent samples. The data is represented as the mean ± SD. aP < 0.05, bP < 0.01, cP < 0.001. 18β-GRA: 18β-glycyrrhetinic acid.
Figure 3 Effect of 18β-glycyrrhetinic acid on cell cycle and cell apoptosis of AGS and HGC-27 cells.
A: Effect of 18β-glycyrrhetinic acid (18β-GRA) on AGS cells cycle; B: Statistical results of AGS cell cycle; C: Effect of 18β-GRA on HGC-27 cells cycle; D: Statistical results of HGC-27 cells cycle; E: Effect of 18β-GRA on AGS cells apoptosis; F: Statistical results of AGS cells apoptosis; G: Effect of 18β-GRA on HGC-27 cells apoptosis; H: Statistical results of HGC-27 cells apoptosis. All data are from three independent samples. The data is represented as the mean ± SD. aP < 0.05, bP < 0.01, cP < 0.001. 18β-GRA: 18β-glycyrrhetinic acid.
Figure 4 Effect of 18β-glycyrrhetinic acid on cell wound healing of AGS and HGC-27 cells.
A: Effect of 18β-glycyrrhetinic acid (18β-GRA) on the wound healing of AGS cells; B: Statistical results of the wound healing in AGS cells; C: Effect of 18β-GRA on wound healing of HGC-27 cells; D: Statistical results of the wound healing in HGC-27 cells. All data are from three independent samples. The data is represented as the mean ± SD. cP < 0.001. 18β-GRA: 18β-glycyrrhetinic acid.
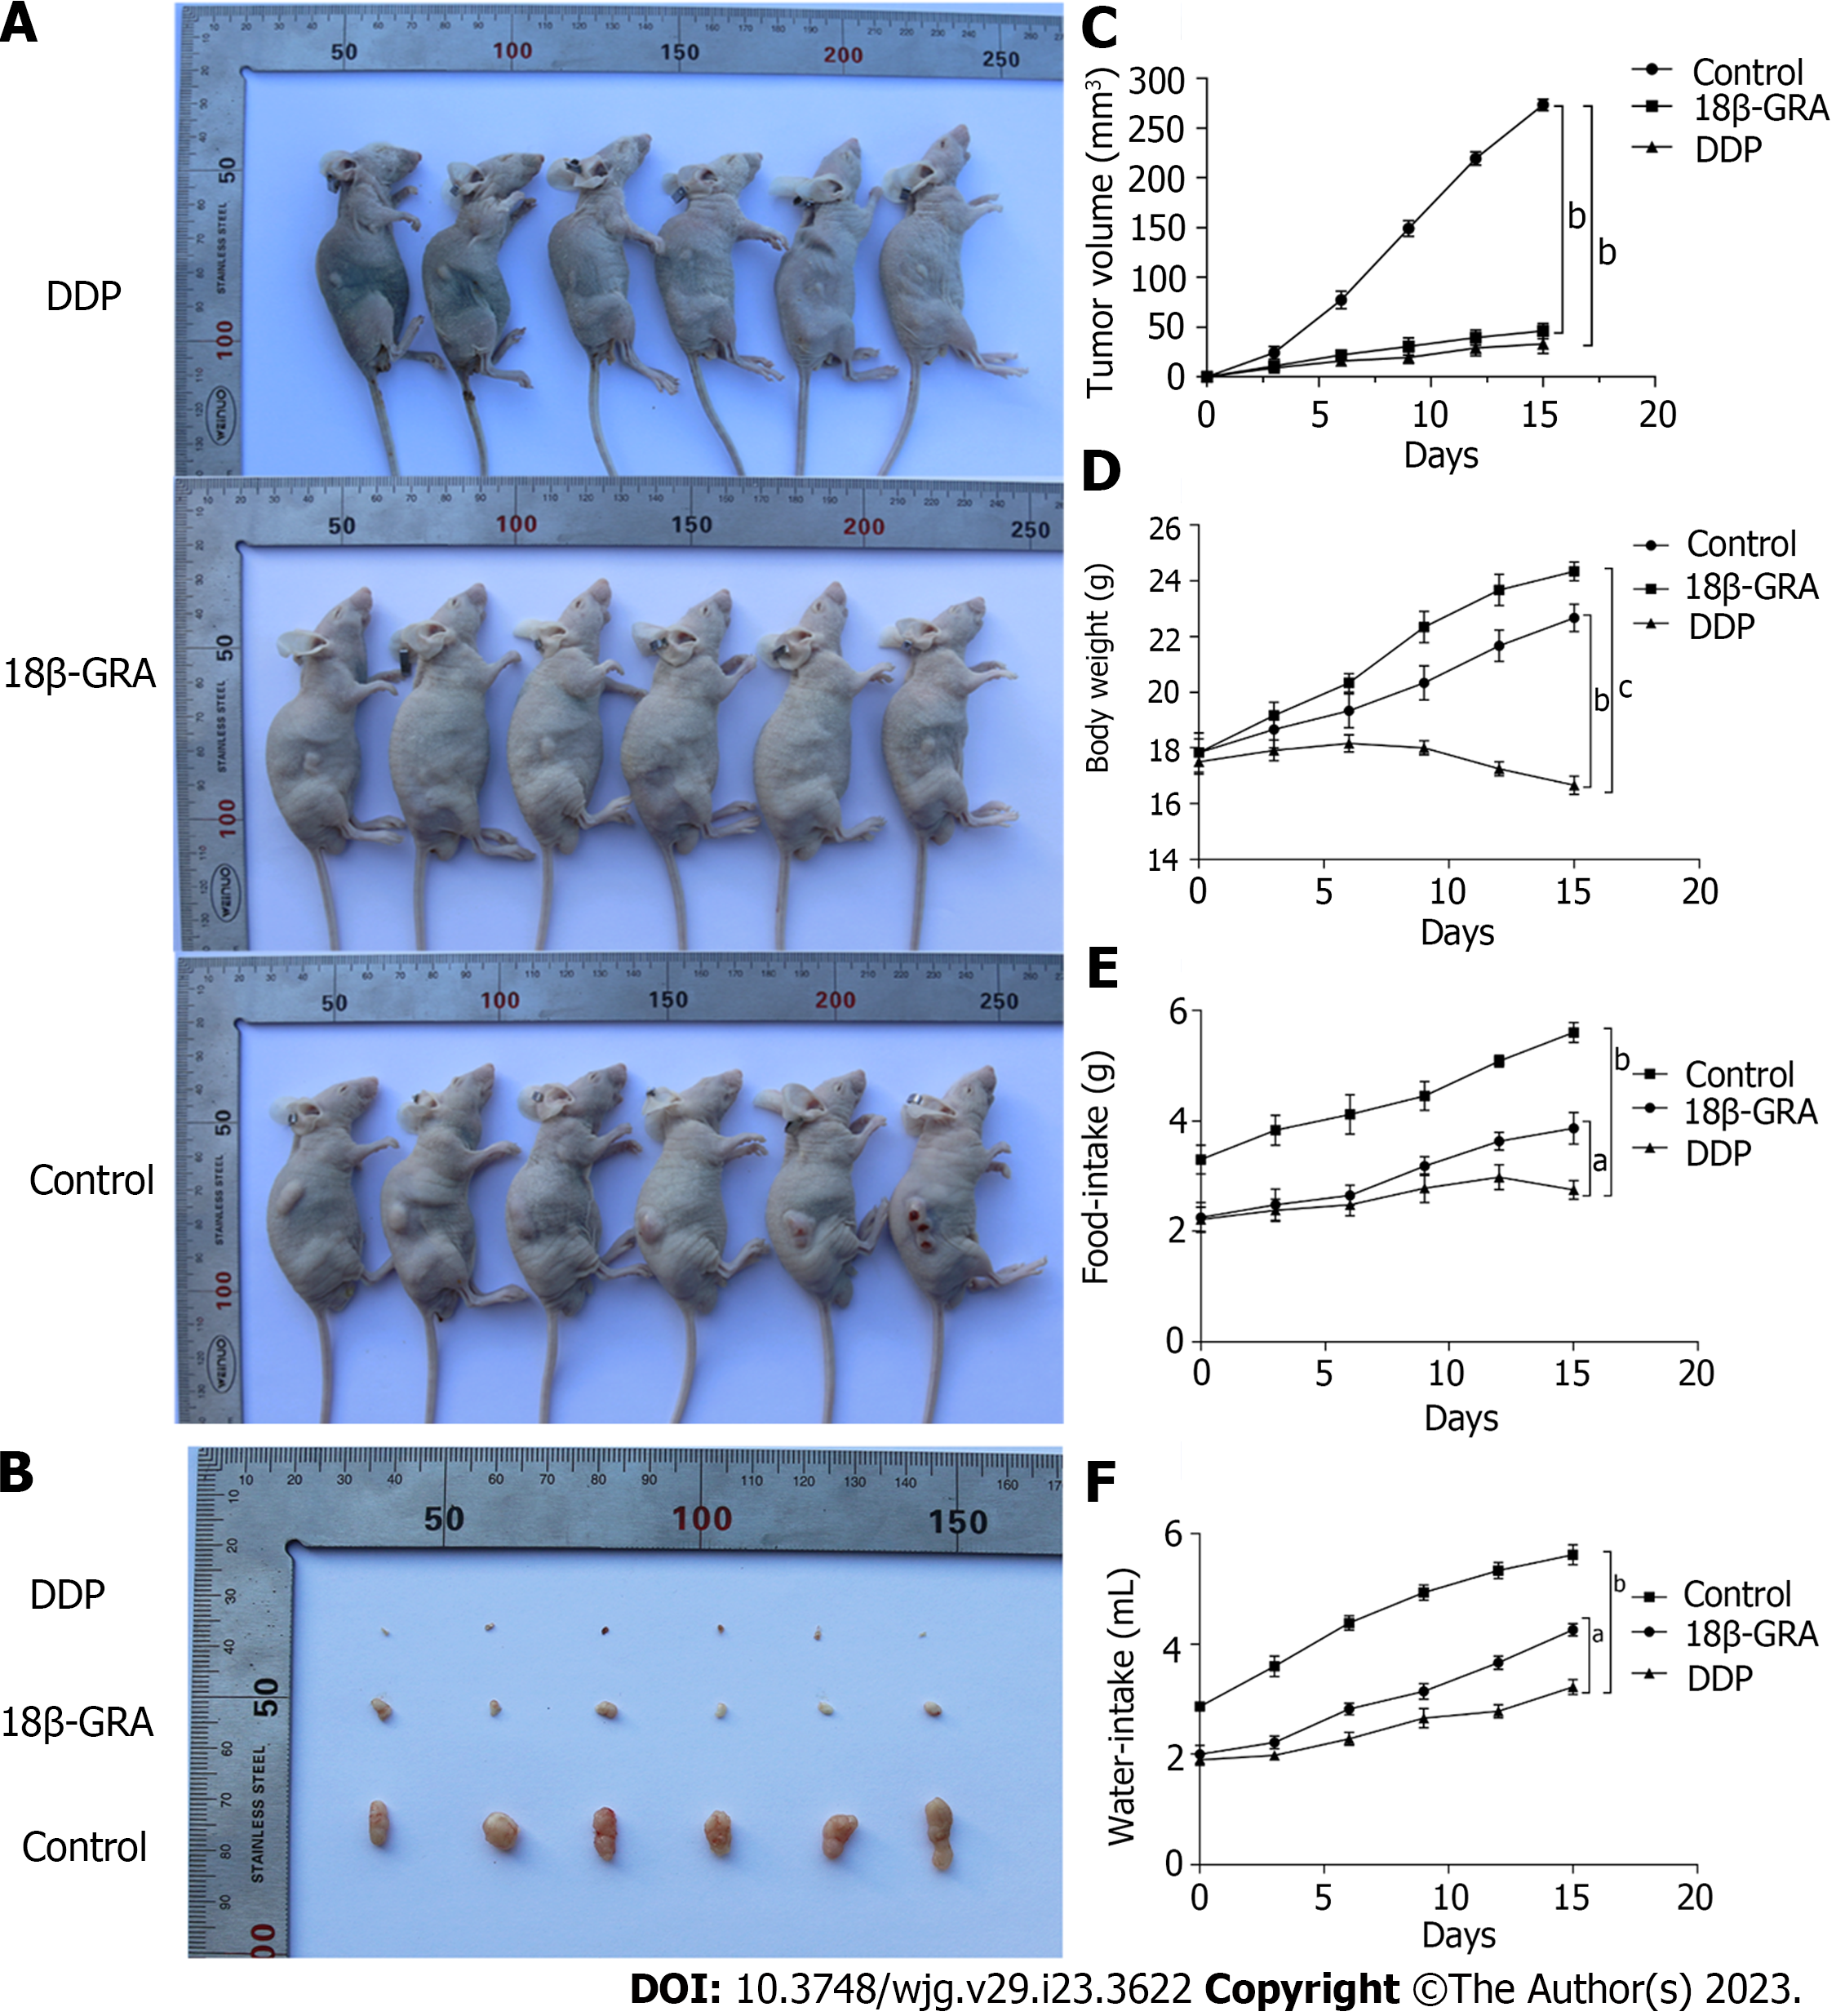
Figure 5 Effect of 18β-glycyrrhetinic acid on subcutaneous tumor growth in BALB/c nude mice.
A: Comparison of back tumor in the cisplatin (DDP), 18β-glycyrrhetinic acid (18β-GRA) and control groups; B: Comparison of back tumor volume in the DDP, 18β-GRA and control groups; C: Effect of tumor volume growth in the DDP, 18β-GRA and control groups; D: Effect of body weight in the DDP, 18β-GRA and control groups; E: Effect of water-intake in the DDP, 18β-GRA and control groups; F: Effect of food-intake in the DDP, 18β-GRA and control groups. The data is represented as the mean ± SD. aP < 0.05, bP < 0.01, cP < 0.001. 18β-GRA: 18β-glycyrrhetinic acid; DDP: Cisplatin.
Figure 6 The results of TMT proteomic analysis and MDC staining assay.
A: TMT proteomic analysis of differentially expressed proteins (DEPs) volcano map; B: Gene Ontology (GO) enrichment analysis of DEPs. The Y axis denotes the GO functional classification enriched of DEPs, and the X axis denotes the -Log10 of the P value of Fisher’s exact test of the significance of the enrichment; C: Kyoto Encyclopedia of Genes and Genomes (KEGG) pathway enrichment analysis. The Y axis denotes the categories of KEGG pathways. The X axis is the -Log10 of the p value of Fisher’s exact test of the significance of enrichment; D: GO annotation analysis of DEPs; E: Subcellular localization analysis; F: Protein domain enrichment analysis; G: Proteins cluster analysis; H: Protein-protein interaction network diagram of TGM2 and autophagy marker proteins; I: The MDC staining results of AGS cells treated with different concentrations of 18β-glycyrrhetinic acid (18β-GRA); J: Statistical results of the MDC staining in AGS cells; K: The MDC staining results of HGC-27 cells treated with different concentrations of 18β-GRA; L: Statistical results of the MDC staining in HGC-27 cells. All data are from three independent samples. The data is represented as the mean ± SD. aP < 0.05, bP < 0.01, cP < 0.001. DEPs: Differentially expressed proteins; GO: Gene Ontology; KEGG: Kyoto Encyclopedia of Genes and Genomes; 18β-GRA: 18β-glycyrrhetinic acid.
Figure 7 Effect of 18β-glycyrrhetinic acid on the protein expression levels of TGM2, p62, LC3II, ULK1 and AMPK in AGS and HGC-27 cells.
All data are from three independent samples. The data is represented as the mean ± SD. bP < 0.01 cP < 0.001. 18β-GRA: 18β-glycyrrhetinic acid.
Figure 8 MicroRNAs transcriptomic analysis and dual-luciferase reporter assay.
A: MicroRNAs (miRNAs) transcriptomics analysis of differentially expressed miRNAs; B: Effect of 18β-glycyrrhetinic acid (18β-GRA) with different concentrations of miR-345-5p expression level in AGS cells; C: Effect of 18β-GRA with different concentrations of miR-345-5p expression level in HGC-27 cells; D: Complementary binding sites of miR-345-5p and TGM2; E: Elevated expression of miR-345-5p suppressed the luciferase value of the TGM2-wild-type reporter but not that under the mutant reporter. All data are from three independent samples. The data is represented as the mean ± SD. aP < 0.05, bP < 0.01, cP < 0.001. 18β-GRA: 18β-glycyrrhetinic acid; WUT: Mutant; WT: Wild type; NC: Empty lentiviral vector.
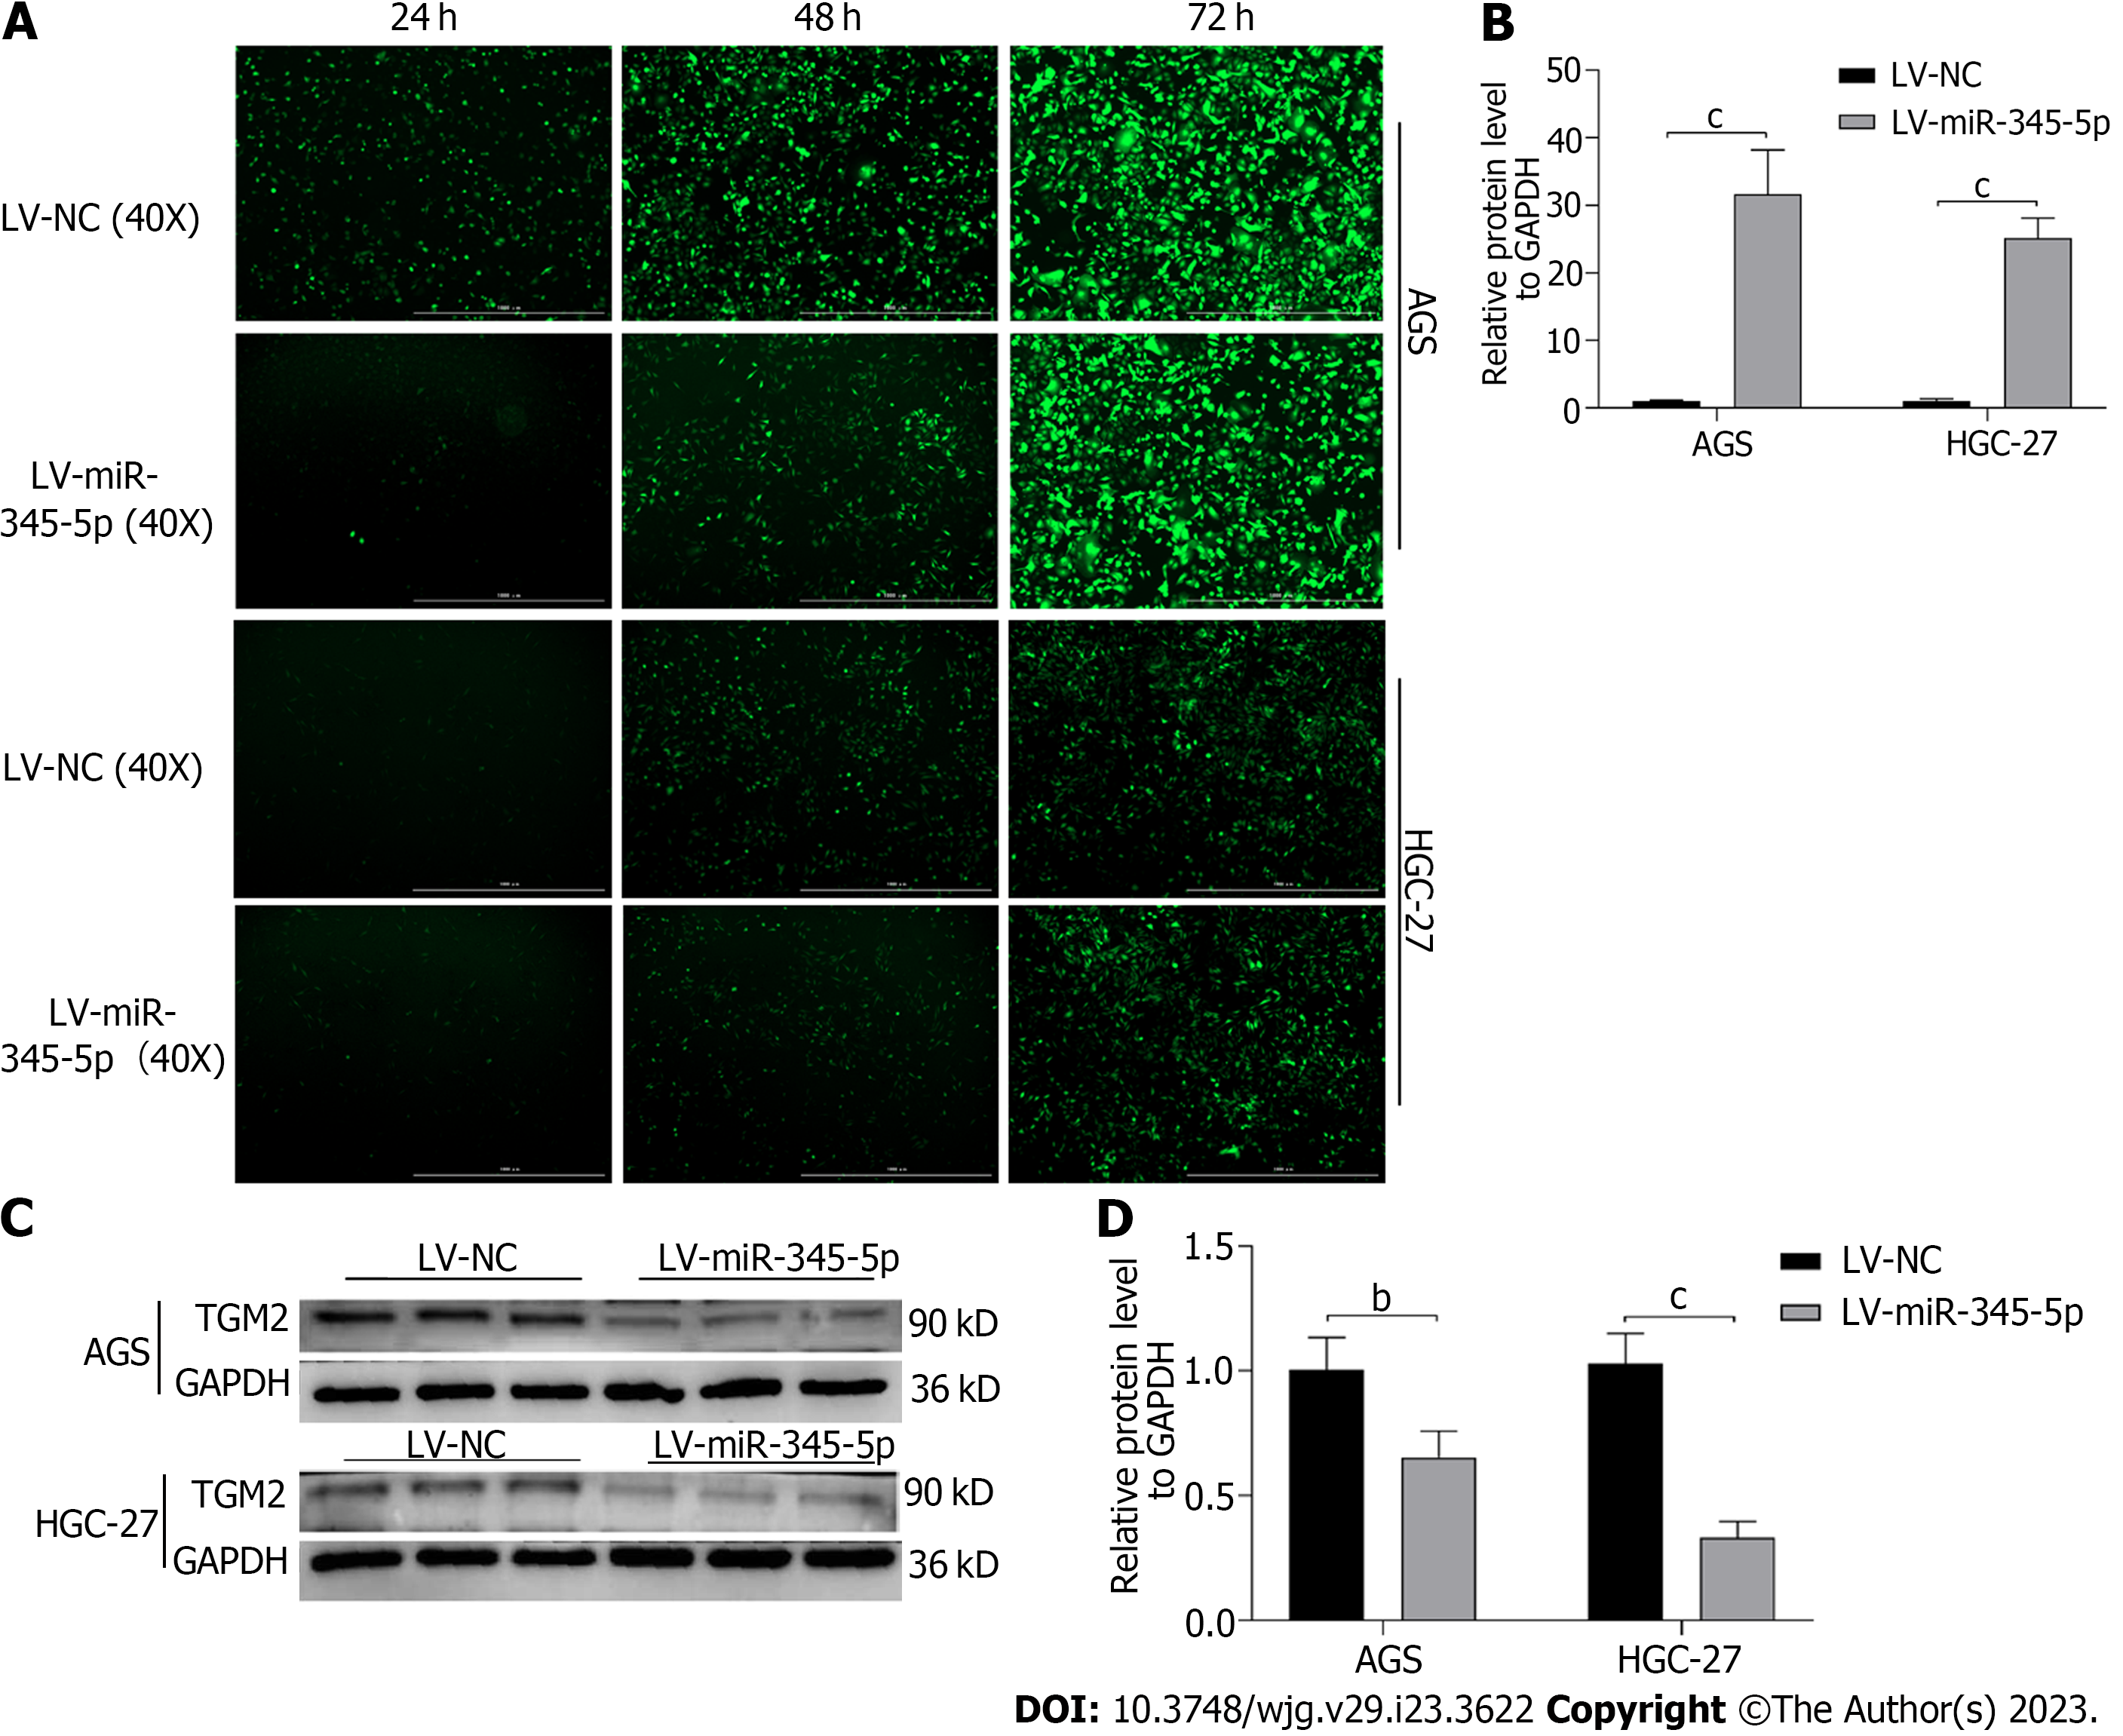
Figure 9 Overexpression of miR-345-5p can inhibit TGM2.
A: Transfection efficiency of lentiviral vector; B: The expression level of miR-345-5p in lentivirus transfected AGS and HGC-27 cells; C: Effect of miR-345-5p overexpression on TGM2; D: Statistical results of the effect of miR-345-5p overexpression on TGM2. All data are from three independent samples. The data is represented as the mean ± SD. bP < 0.01, cP < 0.001. LV-NC: Empty lentiviral vector.
Figure 10 Effect of miR-345-5p overexpression on AGS and HGC-27 cells.
A: Effect of miR-345-5p overexpression on AGS cells viability; B: Effect of miR-345-5p overexpression on HGC-27 cells viability; C: Effect of miR-345-5p overexpression on cell apoptosis in AGS and HGC-27 cells; D: Statistical results of cell apoptosis; E: Effect of miR-345-5p overexpression on cell cycle in AGS and HGC-27 cells; F: Statistical results of cell cycle. All data are from three independent samples. The data is represented as the mean ± SD. aP < 0.05, bP < 0.01, cP < 0.001. LV-NC: Empty lentiviral vector.
Figure 11 Diagram of the mechanism of 18β-glycyrrhetinic acid therapy for gastric cancer cells.
18β-GRA: 18β-glycyrrhetinic acid; mTOR: Mammalian target of rapamycin; Bcl-2: B-cell lymphoma 2; NBR1: Neighbor of BRCA1 gene 1; PE: Phosphatidylethanolamine.
- Citation: Li X, Ma XL, Nan Y, Du YH, Yang Y, Lu DD, Zhang JF, Chen Y, Zhang L, Niu Y, Yuan L. 18β-glycyrrhetinic acid inhibits proliferation of gastric cancer cells through regulating the miR-345-5p/TGM2 signaling pathway. World J Gastroenterol 2023; 29(23): 3622-3644
- URL: https://www.wjgnet.com/1007-9327/full/v29/i23/3622.htm
- DOI: https://dx.doi.org/10.3748/wjg.v29.i23.3622


