Copyright
©The Author(s) 2023.
World J Gastroenterol. Jun 21, 2023; 29(23): 3606-3621
Published online Jun 21, 2023. doi: 10.3748/wjg.v29.i23.3606
Published online Jun 21, 2023. doi: 10.3748/wjg.v29.i23.3606
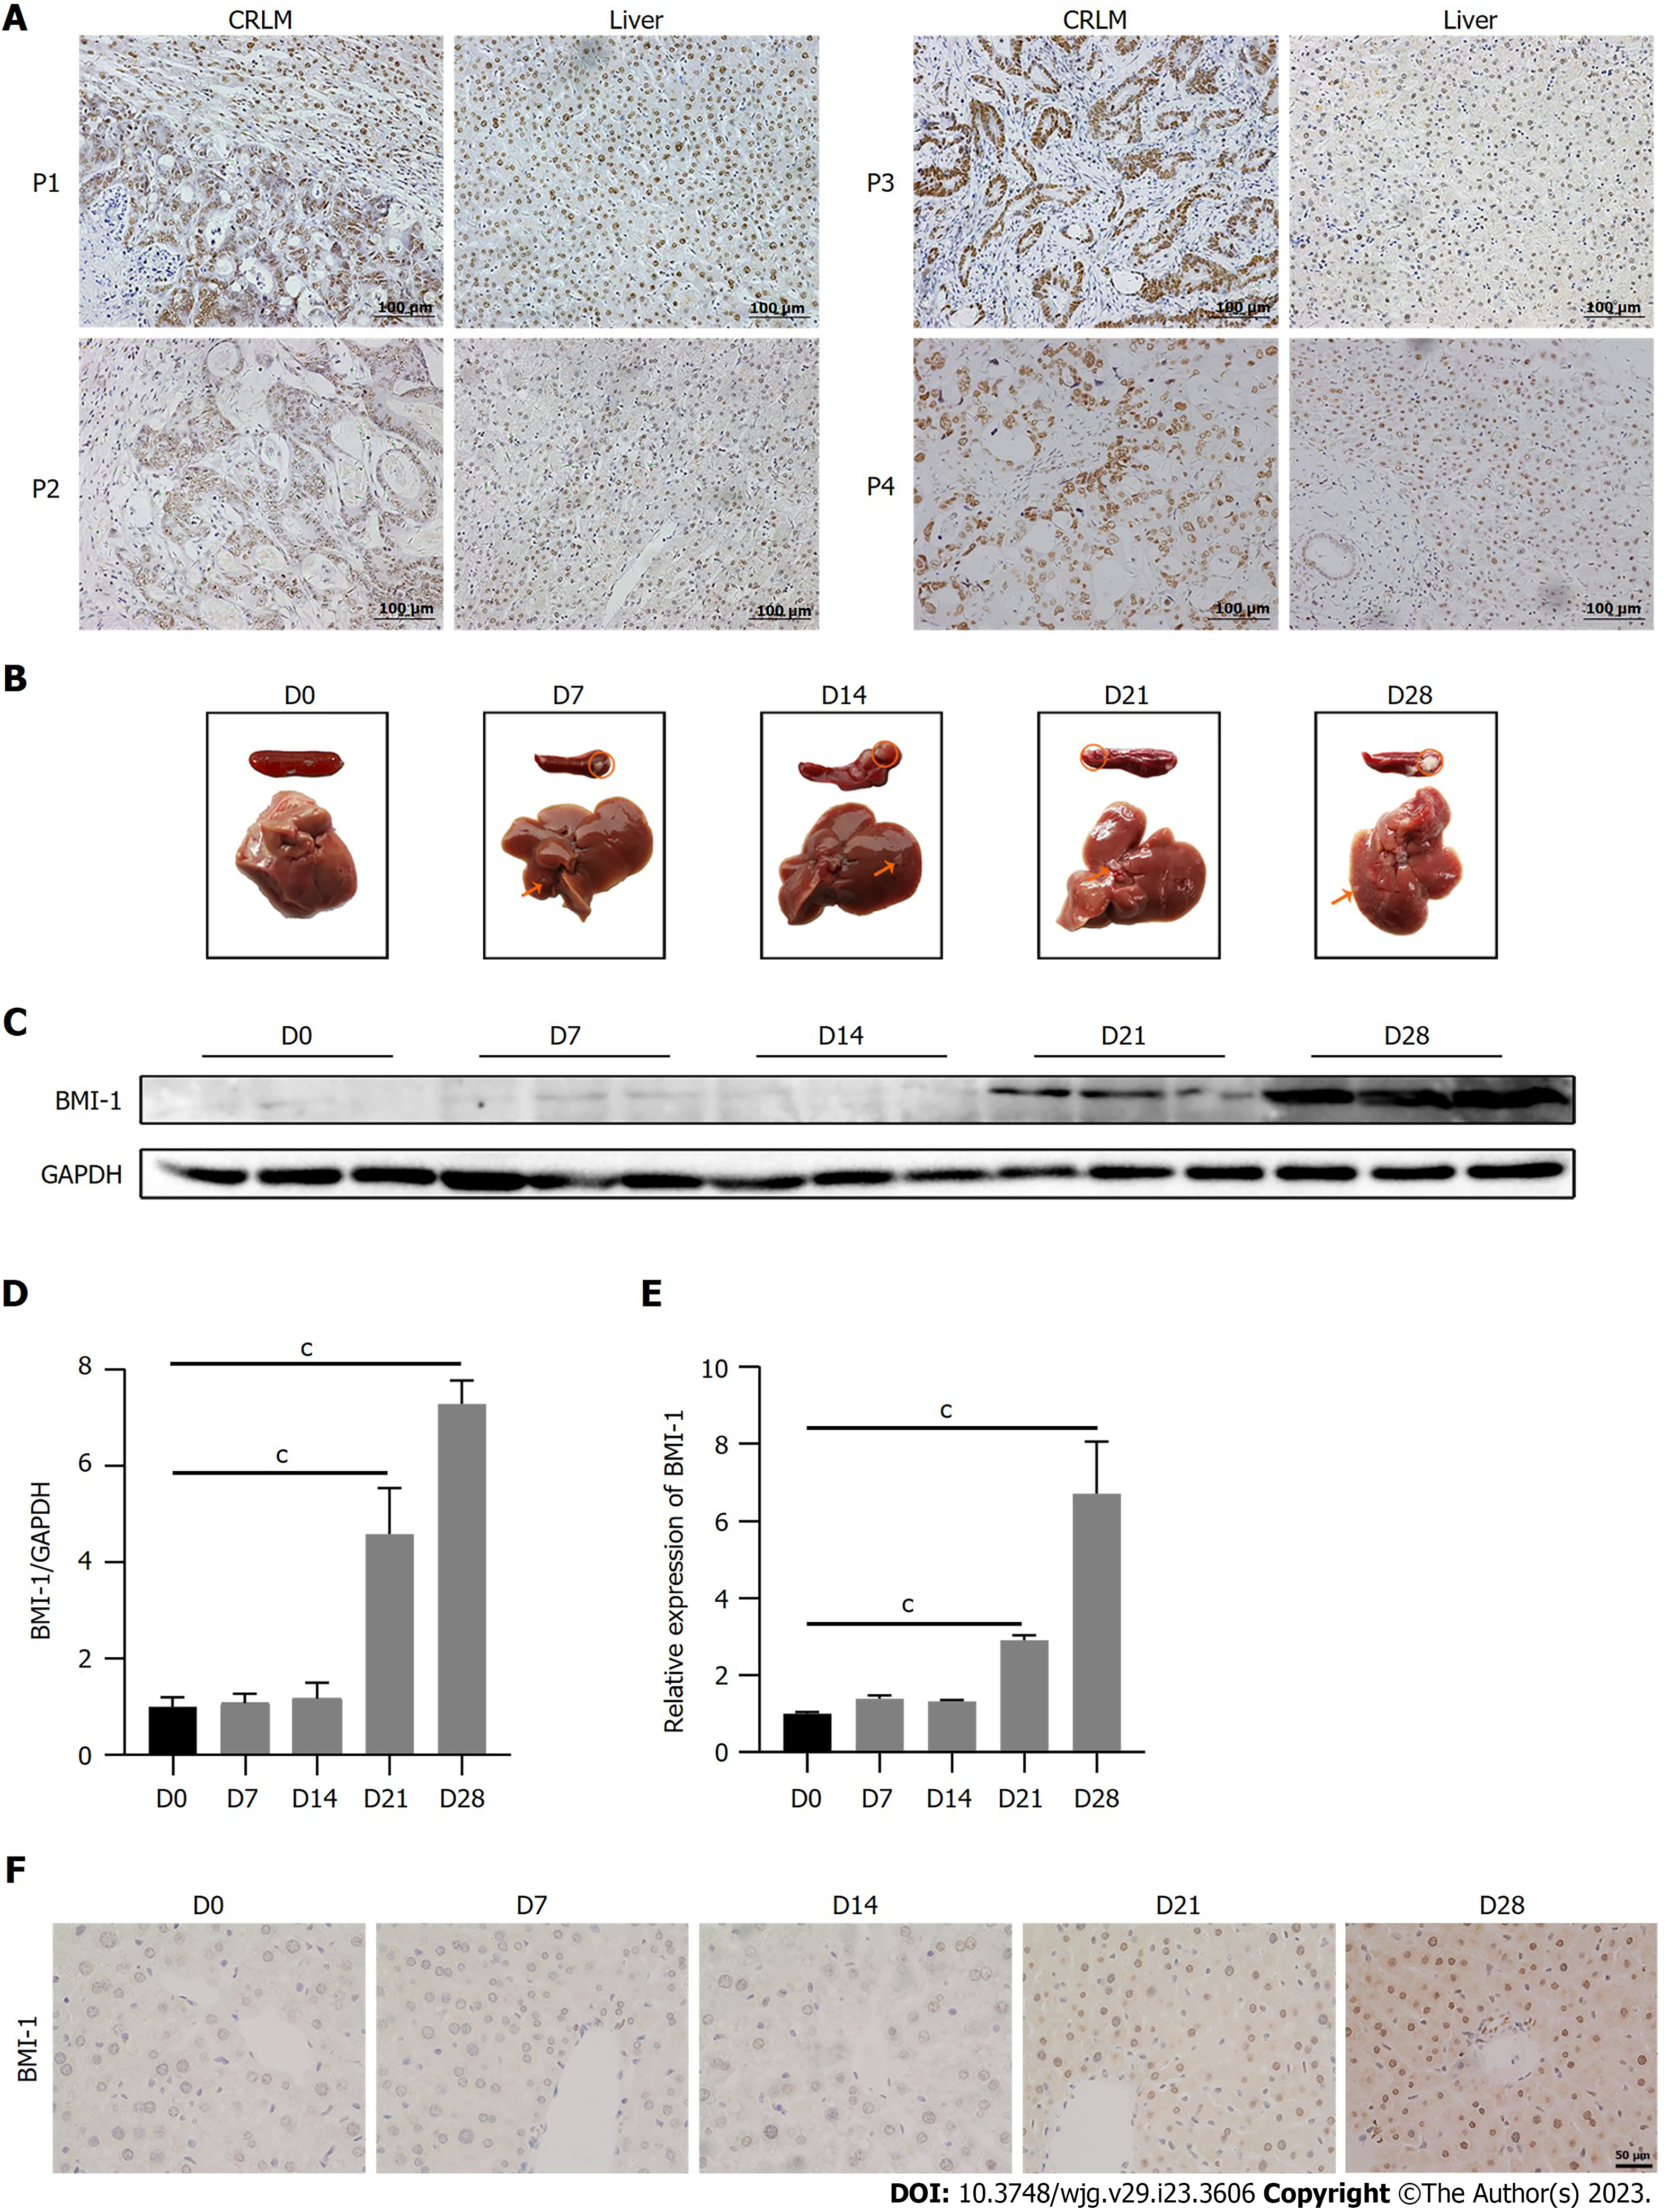
Figure 1 BMI-1 expression increases in liver cells during colorectal cancer liver metastasis.
A: Immunohistochemistry analysis of BMI-1 in liver metastasis and paired liver tissues of colorectal cancer liver metastasis (CRLM) patients; B: Spleens and livers of mice were photographed after intrasplenic injection of CT26 cells at the indicated times; C: Western blot analysis of BMI-1 expression in mouse livers (n = 3); D: Quantitative protein expression of BMI-1 normalized to glyceraldehyde-3-phosphate dehydrogenase (GAPDH) in mouse livers (n = 3); E: Quantitative polymerase chain reaction detection of BMI-1 expression in mouse livers (n = 3); cP < 0.001 vs D0; F: Immunohistochemistry confirmed that BMI-1 expression was increased in mouse livers during CRLM.
Figure 2 BMI-1 activates LX2 hepatic stellate cells.
A: Western blot analysis of BMI-1 and activated hepatic stellate cell (aHSC)-related markers (alpha smooth muscle actin [α-SMA], fibronectin and transforming growth factor beta 1) in control (LX2 NC) and LX2 BMI-1 HSCs; B: Quantitative polymerase chain reaction detection of matrix metalloproteinases (MMPs) and cytokines in LX2 HSCs, cP < 0.001; C: Immunofluorescence analysis showed that α-SMA and fibronectin expression levels were increased in LX2 BMI-1 HSCs. DAPI: 4',6-diamidino-2-phenylindole; IL: Interleukin; NC: Negative control.
Figure 3 Effects of BMI-1 overexpressed hepatic stellate cell conditioned medium on cell proliferation and migration of colorectal cancer cells.
A: Viability of HCT116 and DLD-1 cells cultured in conditioned medium (CM) from negative control (NC) LX2 (NC CM) or CM from BMI-1 overexpressed LX2 (BMI-1 CM) was confirmed by the Cell Counting Kit-8 assay; B: Colony formation assay of colorectal cancer (CRC) cells cultured in NC CM or BMI-1 CM; C: Wound healing assay of CRC cells cultured in NC CM or BMI-1 CM, the healing percentages were calculated at 24 h and 48 h; D: Transwell migration assay of CRC cells cultured in NC CM or BMI-1 CM, the numbers of cells which migrated were counted; E: Quantitative polymerase chain reaction assay of the expression of epithelial-mesenchymal transition (EMT)-related markers in CRC cells cultured in NC CM or BMI-1 CM; F: Western blot assays of the expression of EMT-related markers in CRC cells cultured in NC CM or BMI-1 CM; G: Immunofluorescence analysis showed that vimentin and Snail expression levels were increased in CRC cells cultured in BMI-1 CM. bP < 0.01, cP < 0.001 vs NC CM. DAPI: 4',6-diamidino-2-phenylindole.
Figure 4 BMI-1 conditioned medium induces activation of the transforming growth factor beta/SMAD pathway in colorectal cancer cells.
A: Quantitative polymerase chain reaction analysis showed no difference in the expression of SMAD2 and SMAD3 in colorectal cancer (CRC) cells cultured in conditioned medium (CM) from negative control NC) (NC CM) or CM from BMI-1 overexpressed LX2 (BMI-1 CM); B: Western blot assays of SMAD2, SMAD3, phosphorylated (p)-SMAD2, and p-SMAD3 expression levels in CRC cells cultured in NC CM or BMI-1 CM; C and D: Western blot analysis of the expression of SMAD pathway members and epithelial-mesenchymal transition-related proteins (Snail and vimentin) in CRC cells cultured in NC CM or BMI-1 CM with/without 0.5 μM SB-505124 treatment, the relative expression levels of the proteins were calculated and are shown in D. cP < 0.001.
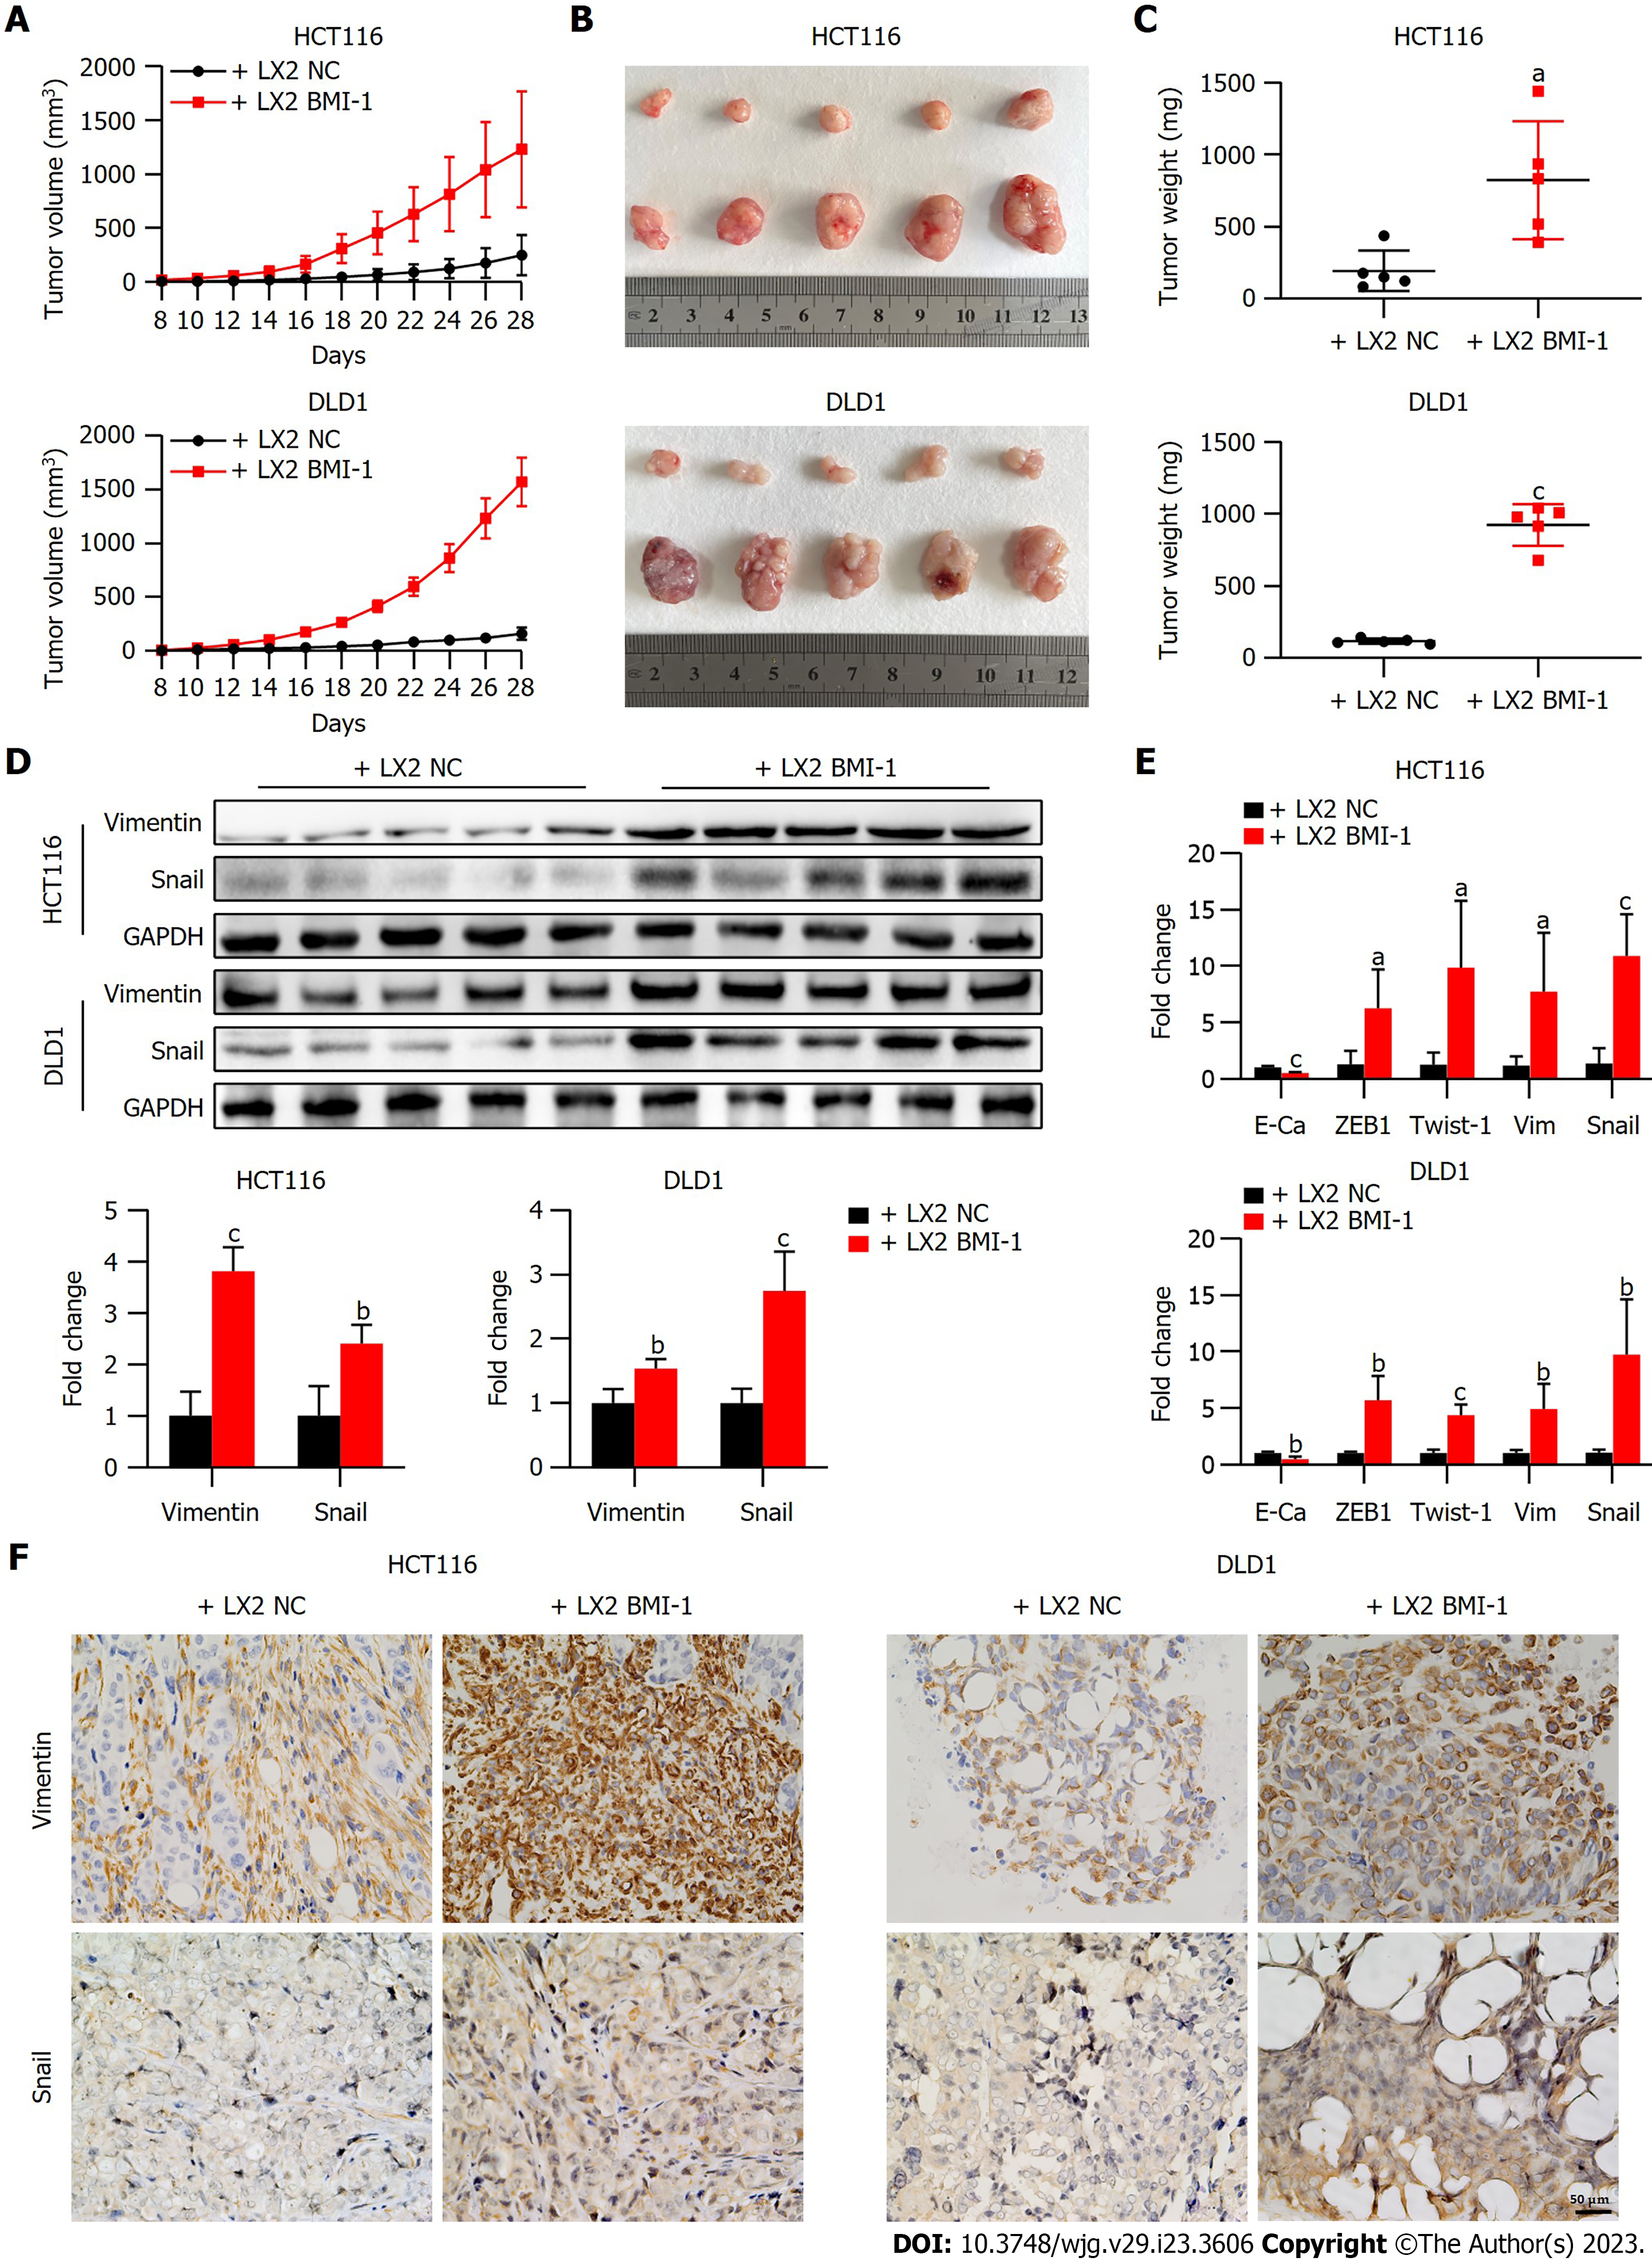
Figure 5 BMI-1 overexpressed LX2 promotes tumor growth of colorectal cancer in vivo.
A: Colorectal cancer cells (HCT116 or DLD-1) and LX2 cells (negative control [NC] or BMI-1 overexpressed) were co-implanted subcutaneously into the flanks of nude mice. After 7 d, tumor volume was measured every 2 d from 8 d to 28 d; B: Tumors were photographed at 28 d; C: Tumors were weighed (n = 5); D: Western blot assay of vimentin and Snail expression in mouse tumors in the different groups, and the fold changes were calculated; E: Quantitative polymerase chain reaction assay of the expression of epithelial-mesenchymal transition-related markers in mouse tumors in the different groups; F: Immunohistochemistry analysis of vimentin and Snail expression in mouse tumors. aP < 0.05, bP < 0.01, cP < 0.001 vs LX2 NC. GAPDH: Glyceraldehyde-3-phosphate dehydrogenase.
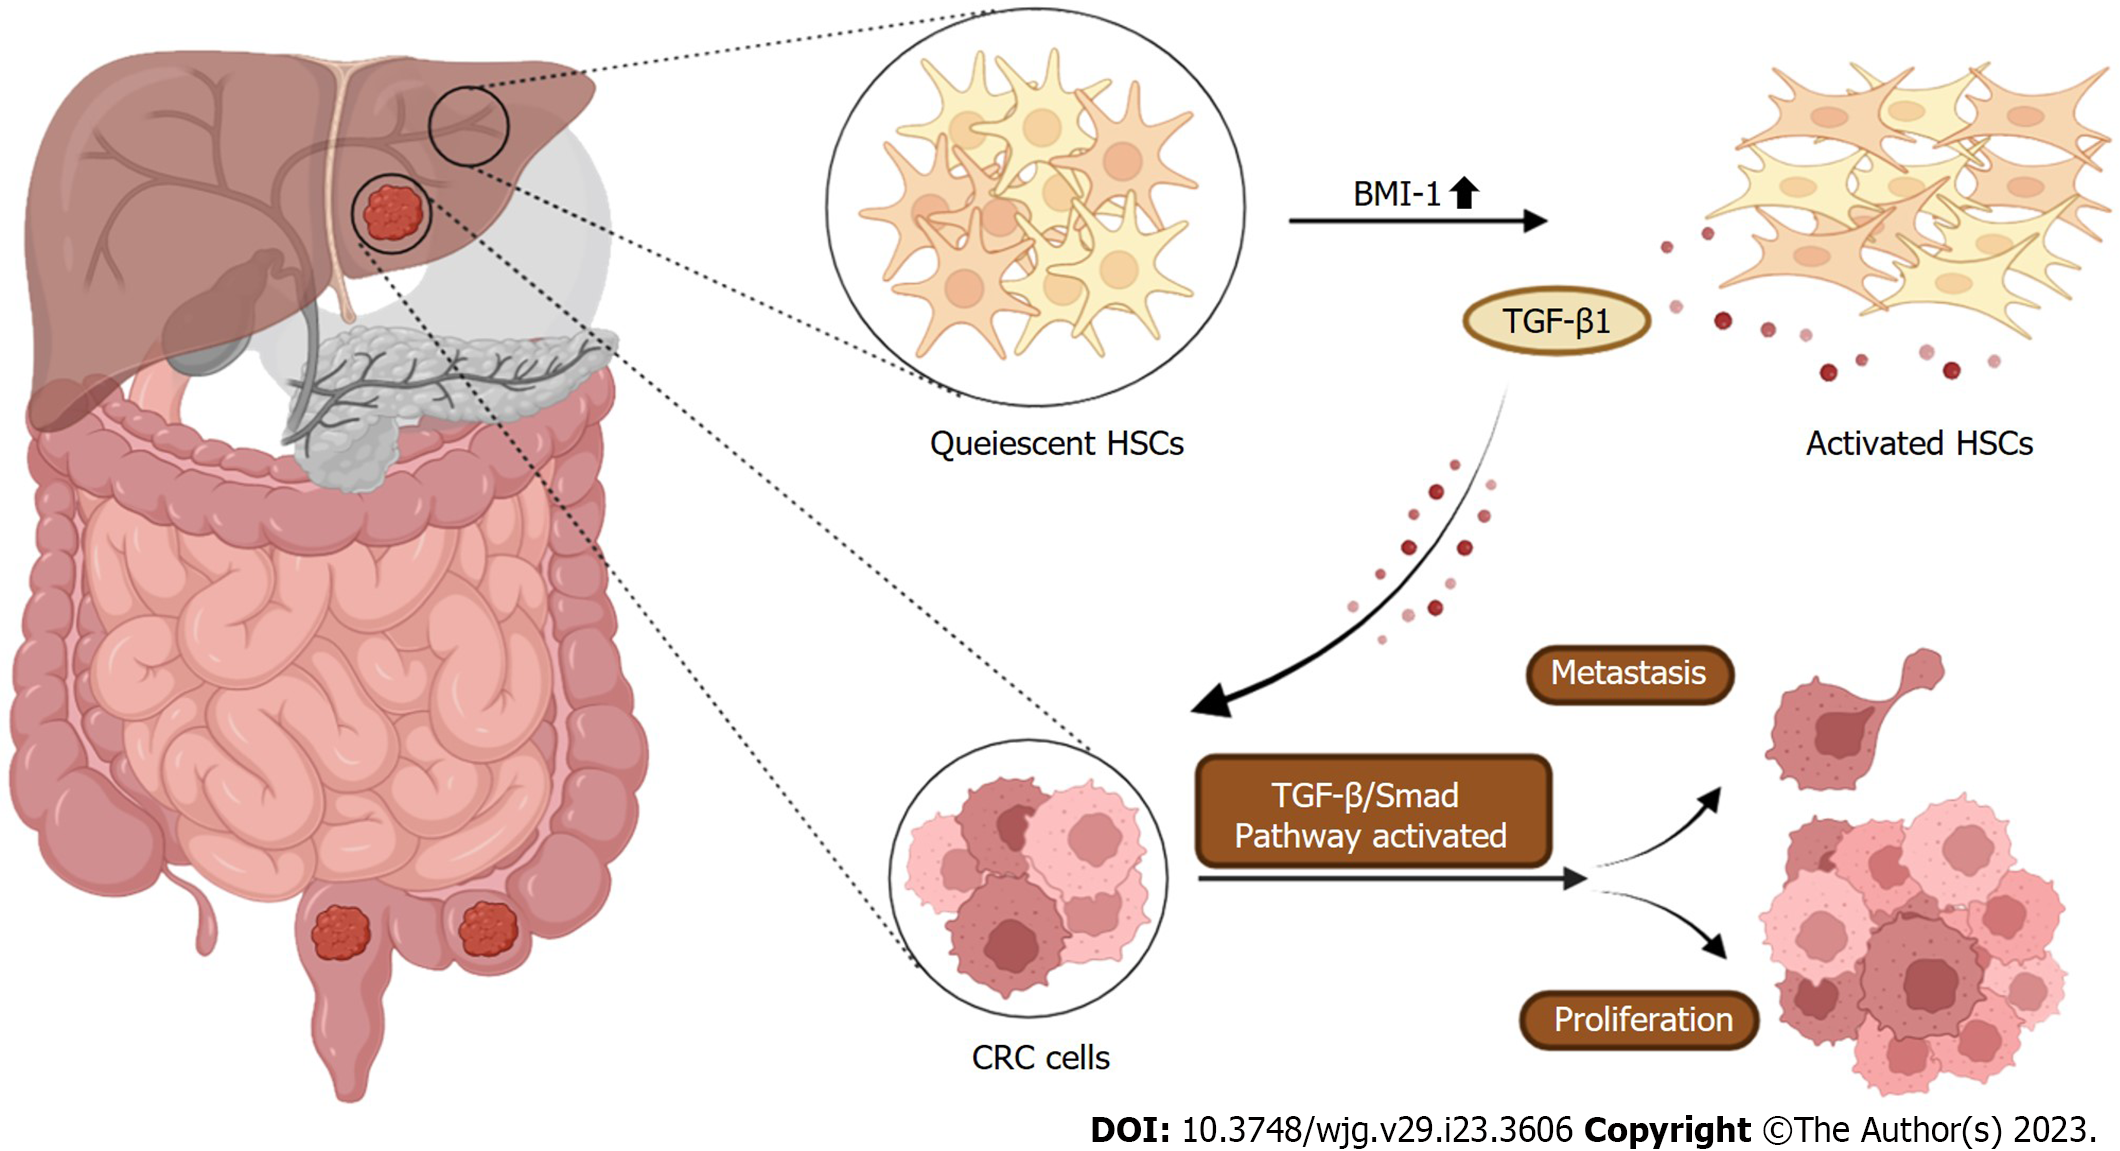
Figure 6 Schematic summary of BMI-1-activated hepatic stellate cells, which promote colorectal cancer cell epithelial-mesenchymal transition and liver metastasis.
CRC: Colorectal cancer; HSC: Hepatic stellate cell; TGF-β1: Transforming growth factor beta 1.
- Citation: Jiang ZY, Ma XM, Luan XH, Liuyang ZY, Hong YY, Dai Y, Dong QH, Wang GY. BMI-1 activates hepatic stellate cells to promote the epithelial-mesenchymal transition of colorectal cancer cells. World J Gastroenterol 2023; 29(23): 3606-3621
- URL: https://www.wjgnet.com/1007-9327/full/v29/i23/3606.htm
- DOI: https://dx.doi.org/10.3748/wjg.v29.i23.3606


