Copyright
©The Author(s) 2023.
World J Gastroenterol. Jun 14, 2023; 29(22): 3440-3468
Published online Jun 14, 2023. doi: 10.3748/wjg.v29.i22.3440
Published online Jun 14, 2023. doi: 10.3748/wjg.v29.i22.3440
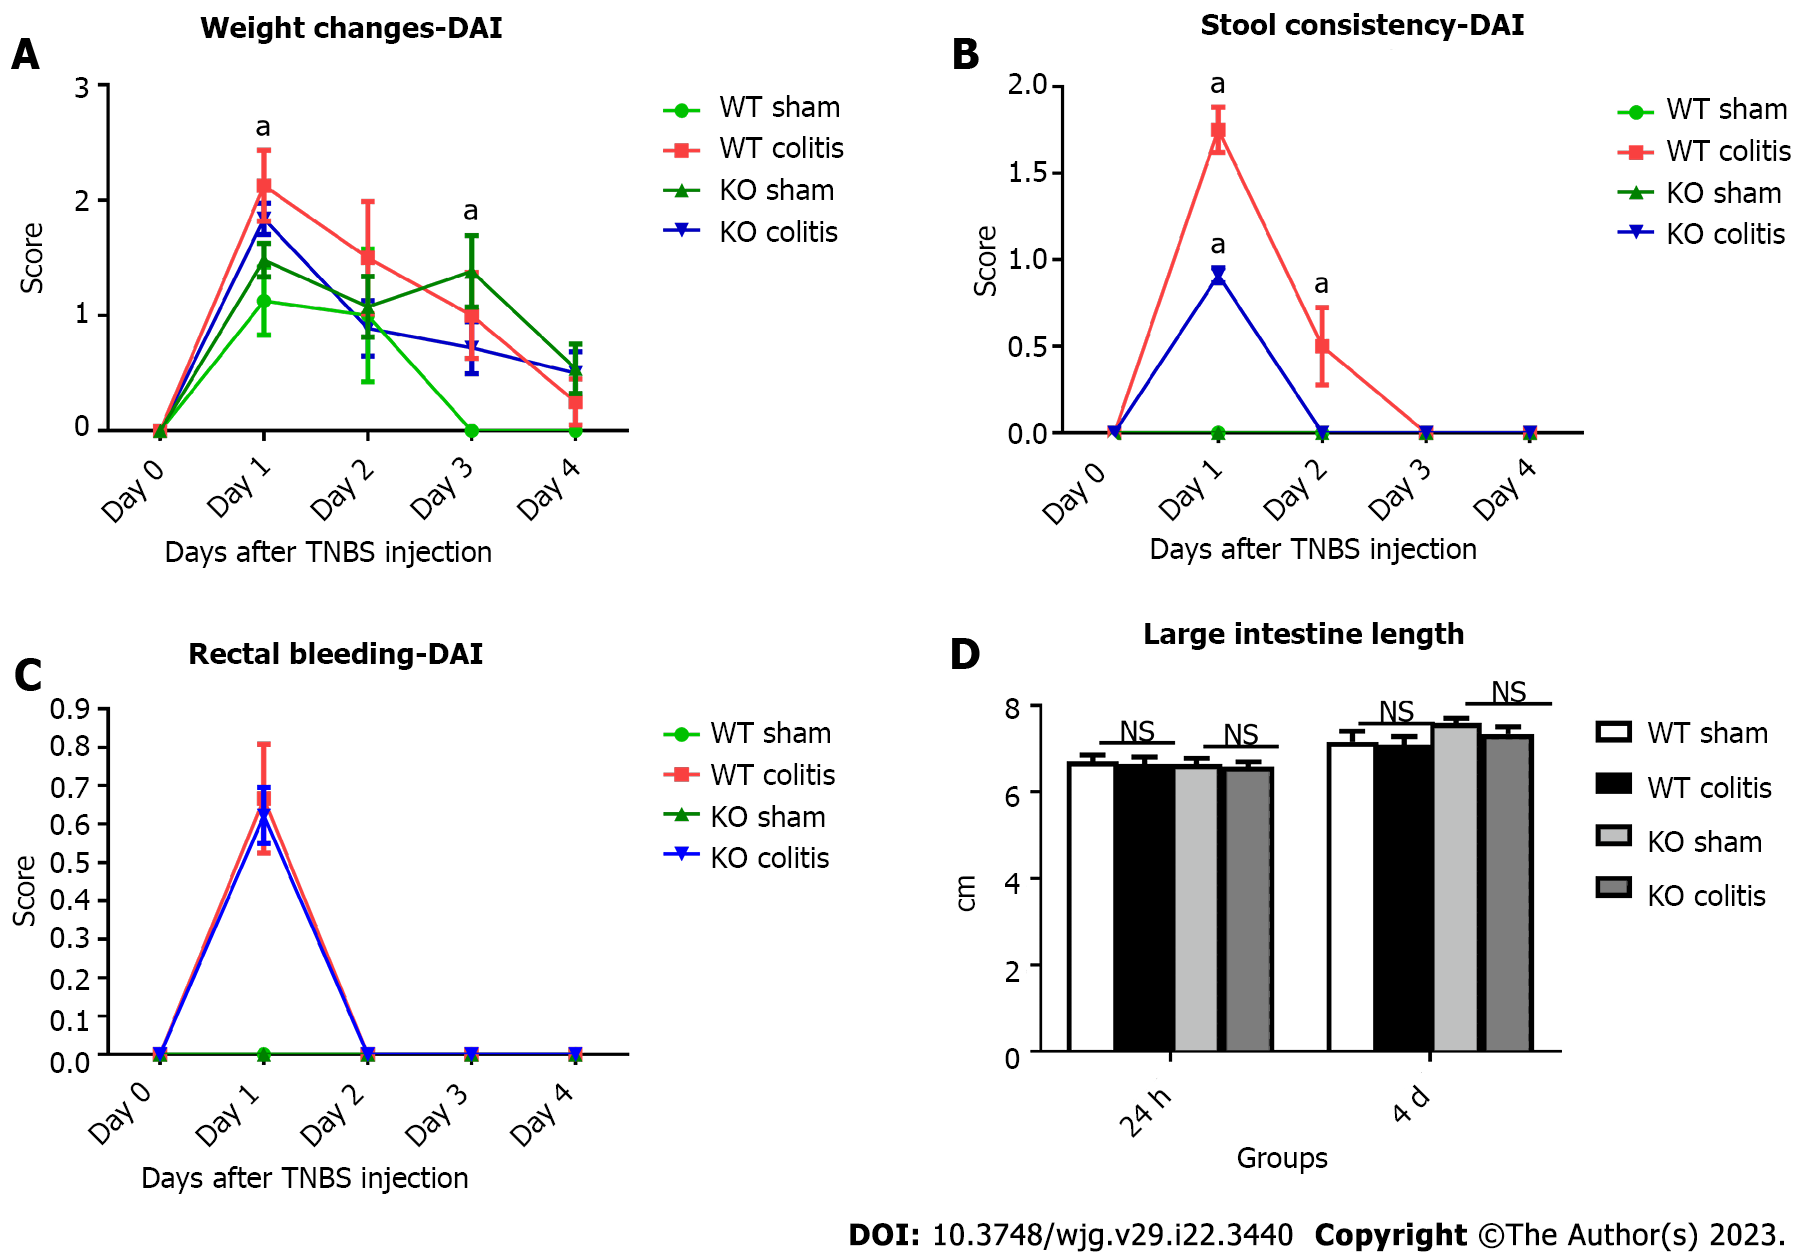
Figure 1 The disease activity index of wild-type and knockout mice was determined beginning the day of ulcerative colitis induction or intrarectal injection of 35% ethanol.
A: Changes in weight; B: Stool consistency; C: The presence of blood in the stool; D: Large intestine length was analyzed. DAI: Disease activity index; WT: Wild-type; KO: Knockout; TNBS: 2,4,6-trinitrobenzene sulfonic acid. The data are presented as the arithmetic mean ± SE. aP < 0.05 vs sham groups; NS: Not significant.
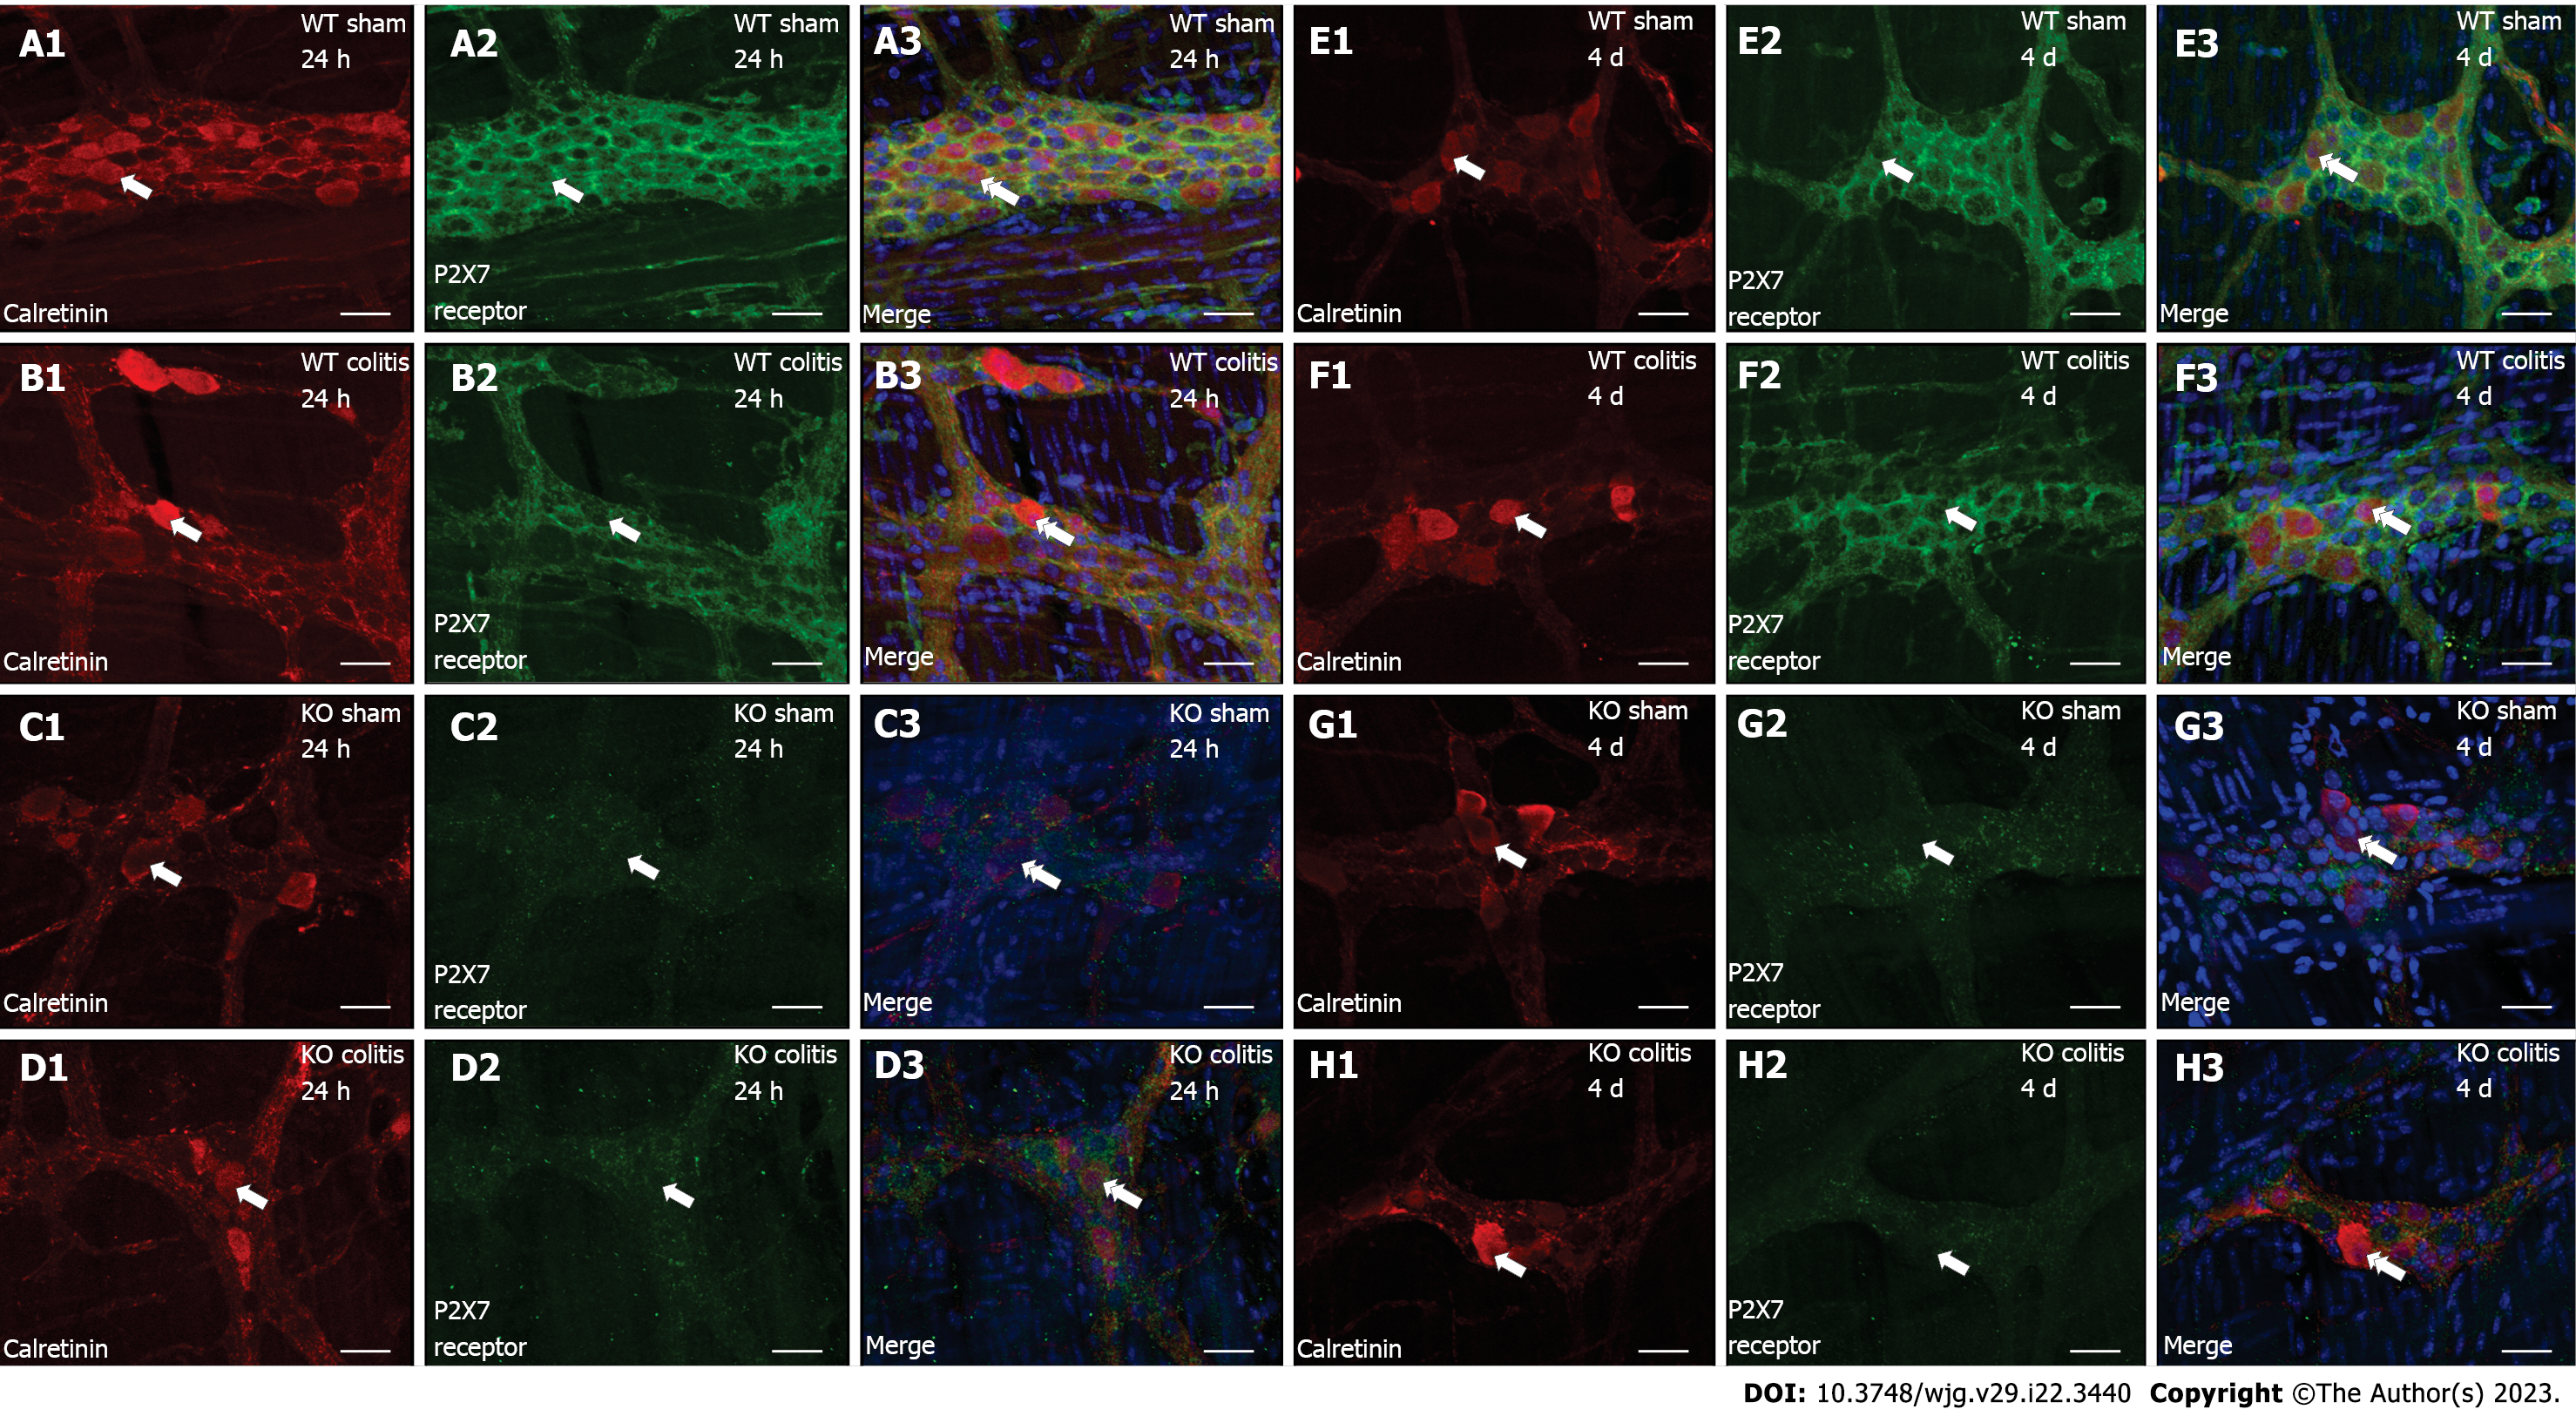
Figure 2 Colocalization of calretinin (red) with the P2X7 receptor (green) and DAPI (blue) in neurons in the myenteric plexus of the distal colon in mice.
A1-A3: Wild-type (WT) sham 24 h; B1-B3: WT colitis 24 h; C1-C3: Knockout (KO) sham 24 h; D1-D3: KO colitis 24 h; E1-E3: WT sham 4 d; F1-F3: WT colitis 4 d; G1-G3: KO sham 4 d; H1-H3: KO colitis 4 d groups. The single arrows indicate calretinin-ir (A1-H1) and P2X7 receptor-ir (A2-H2) neurons, and the double arrows indicate the colocalization of calretinin with the P2X7 receptor and DAPI (A3-H3). Scale bar = 30 µm. WT: Wild-type; KO: Knockout.
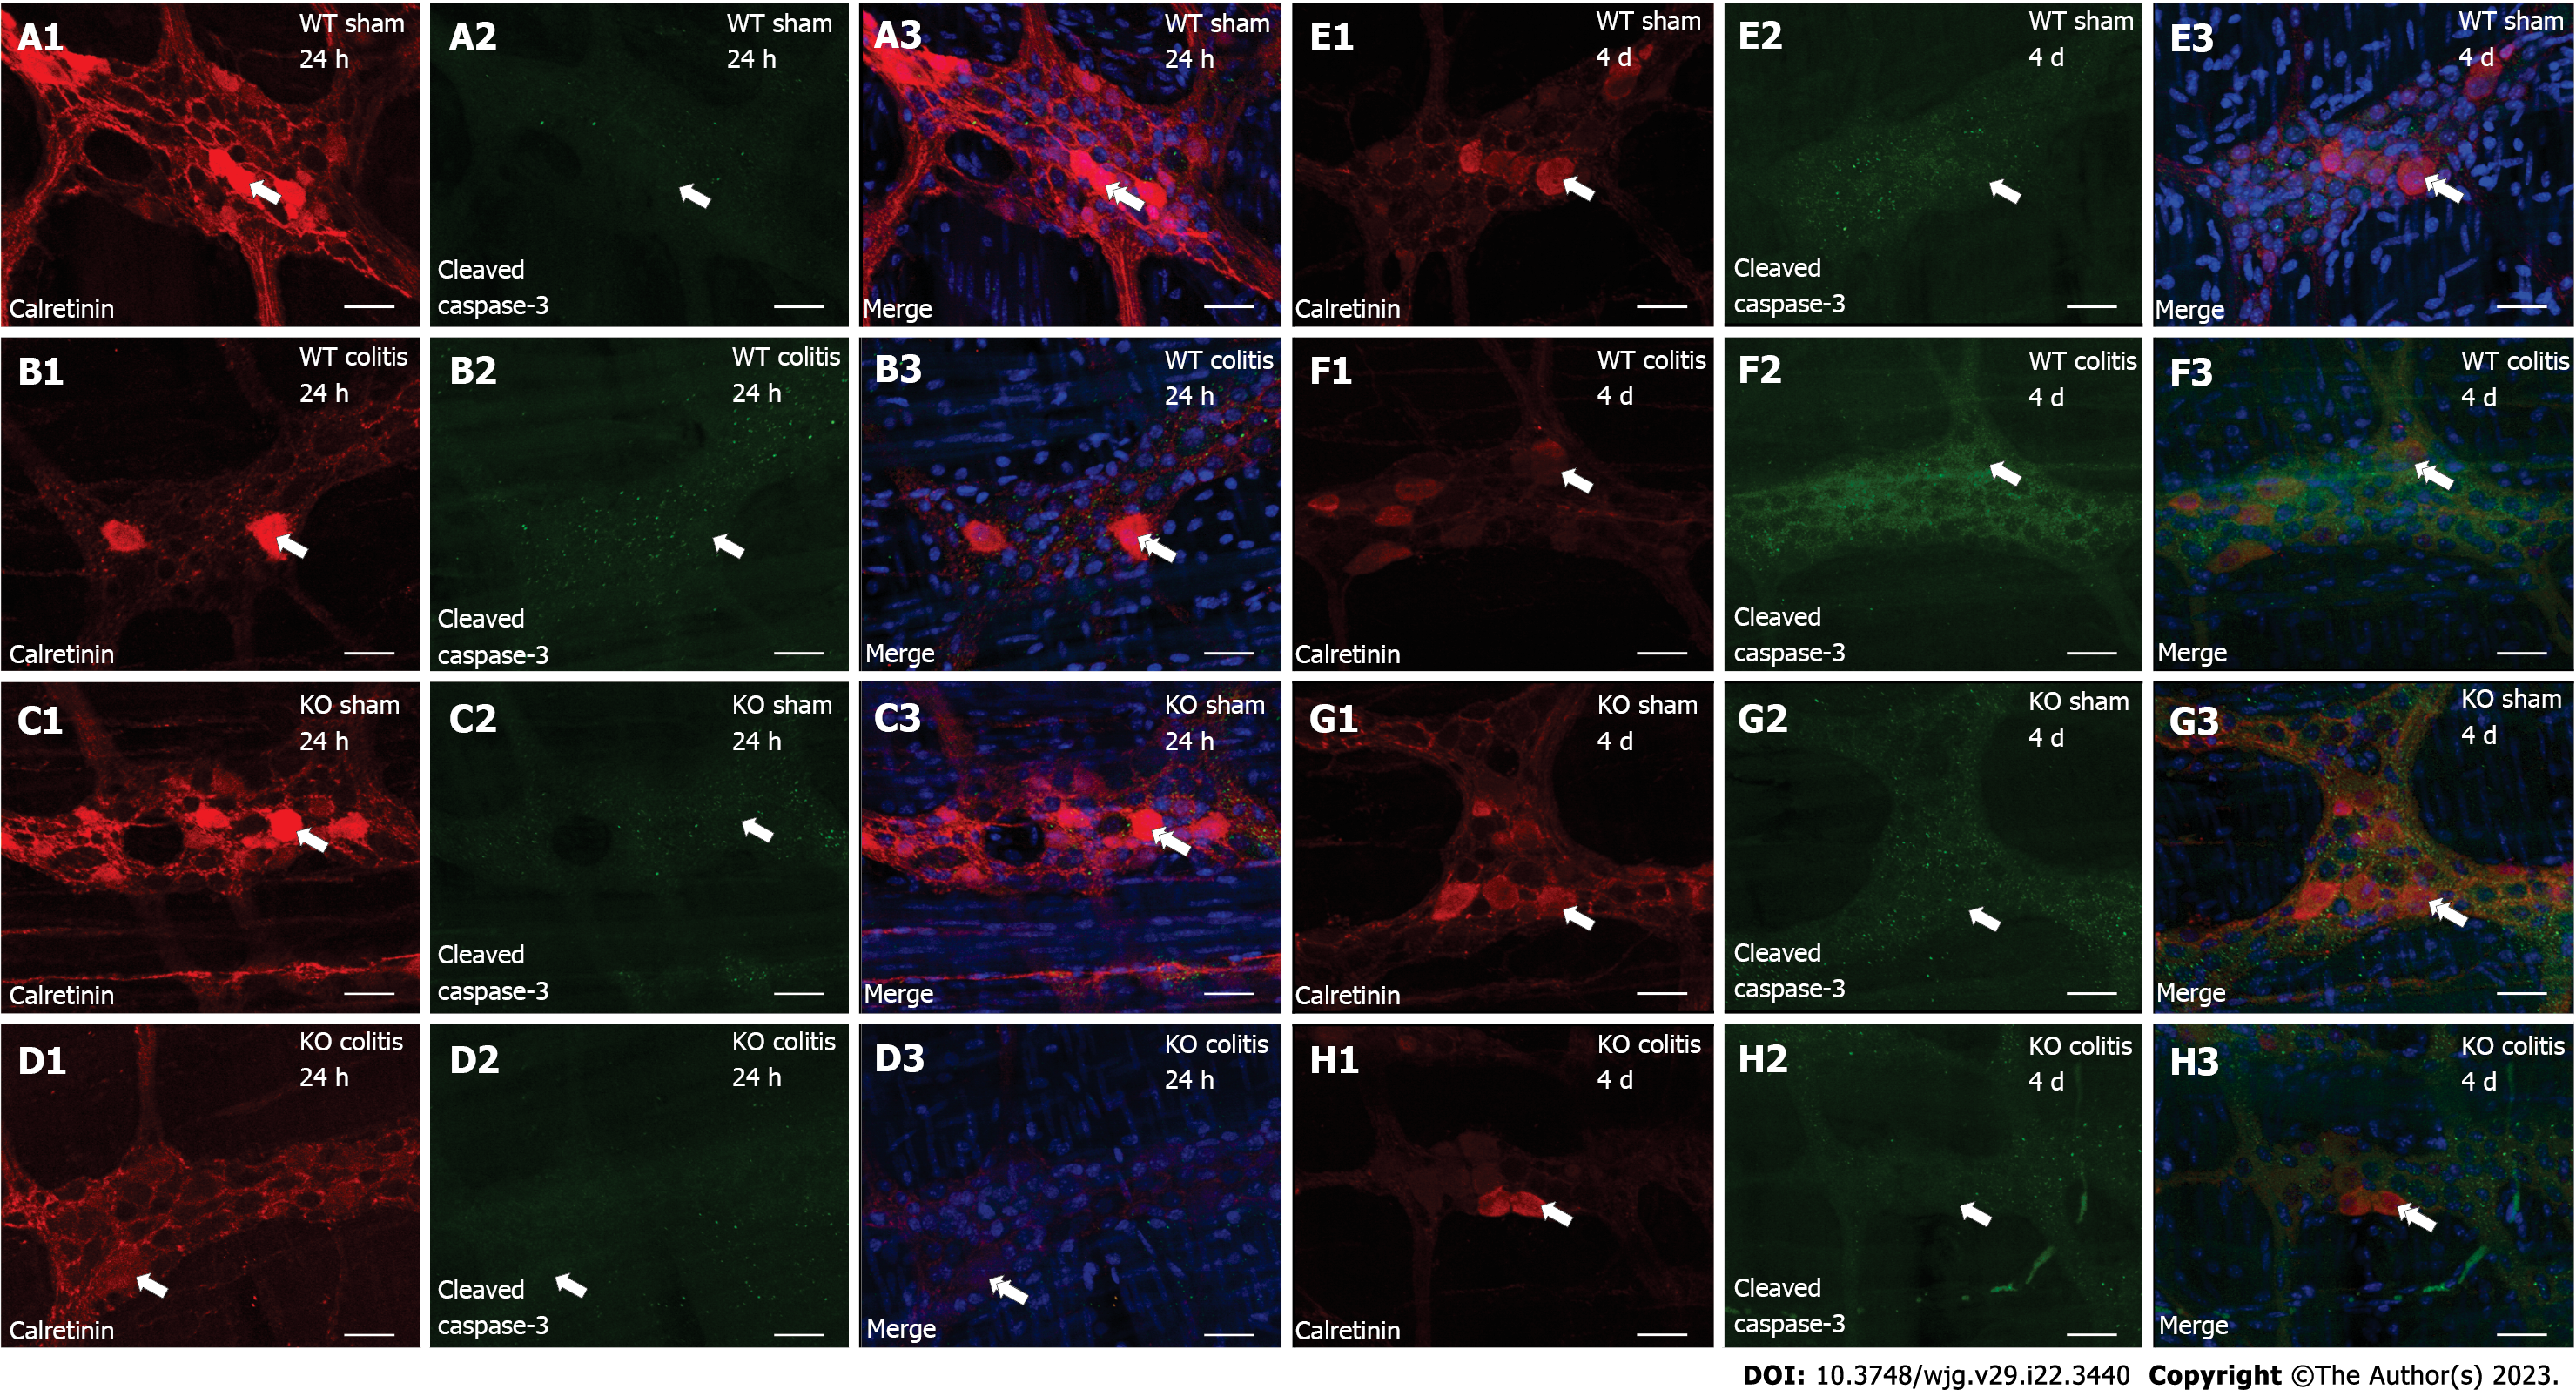
Figure 3 Colocalization of calretinin (red) with cleaved caspase-3 (green) and DAPI (blue) in neurons in the myenteric plexus of the distal colon in mice of different groups.
A1-A3: Wild-type (WT) sham 24 h; B1-B3: WT colitis 24 h; C1-C3: Knockout (KO) sham 24 h; D1-D3: KO colitis 24 h; E1-E3: WT sham 4 d; F1-F3: WT colitis 4 d; G1-G3: KO sham 4 d; and H1-H3: KO colitis 4 d groups. The single arrows indicate calretinin-ir (A1-H1) and cleaved caspase-3-ir (A2-H2) neurons, and the double arrows indicate the colocalization of calretinin with cleaved caspase-3 and DAPI (A3-H3). Scale bar = 30 µm. WT: Wild-type; KO: Knockout.
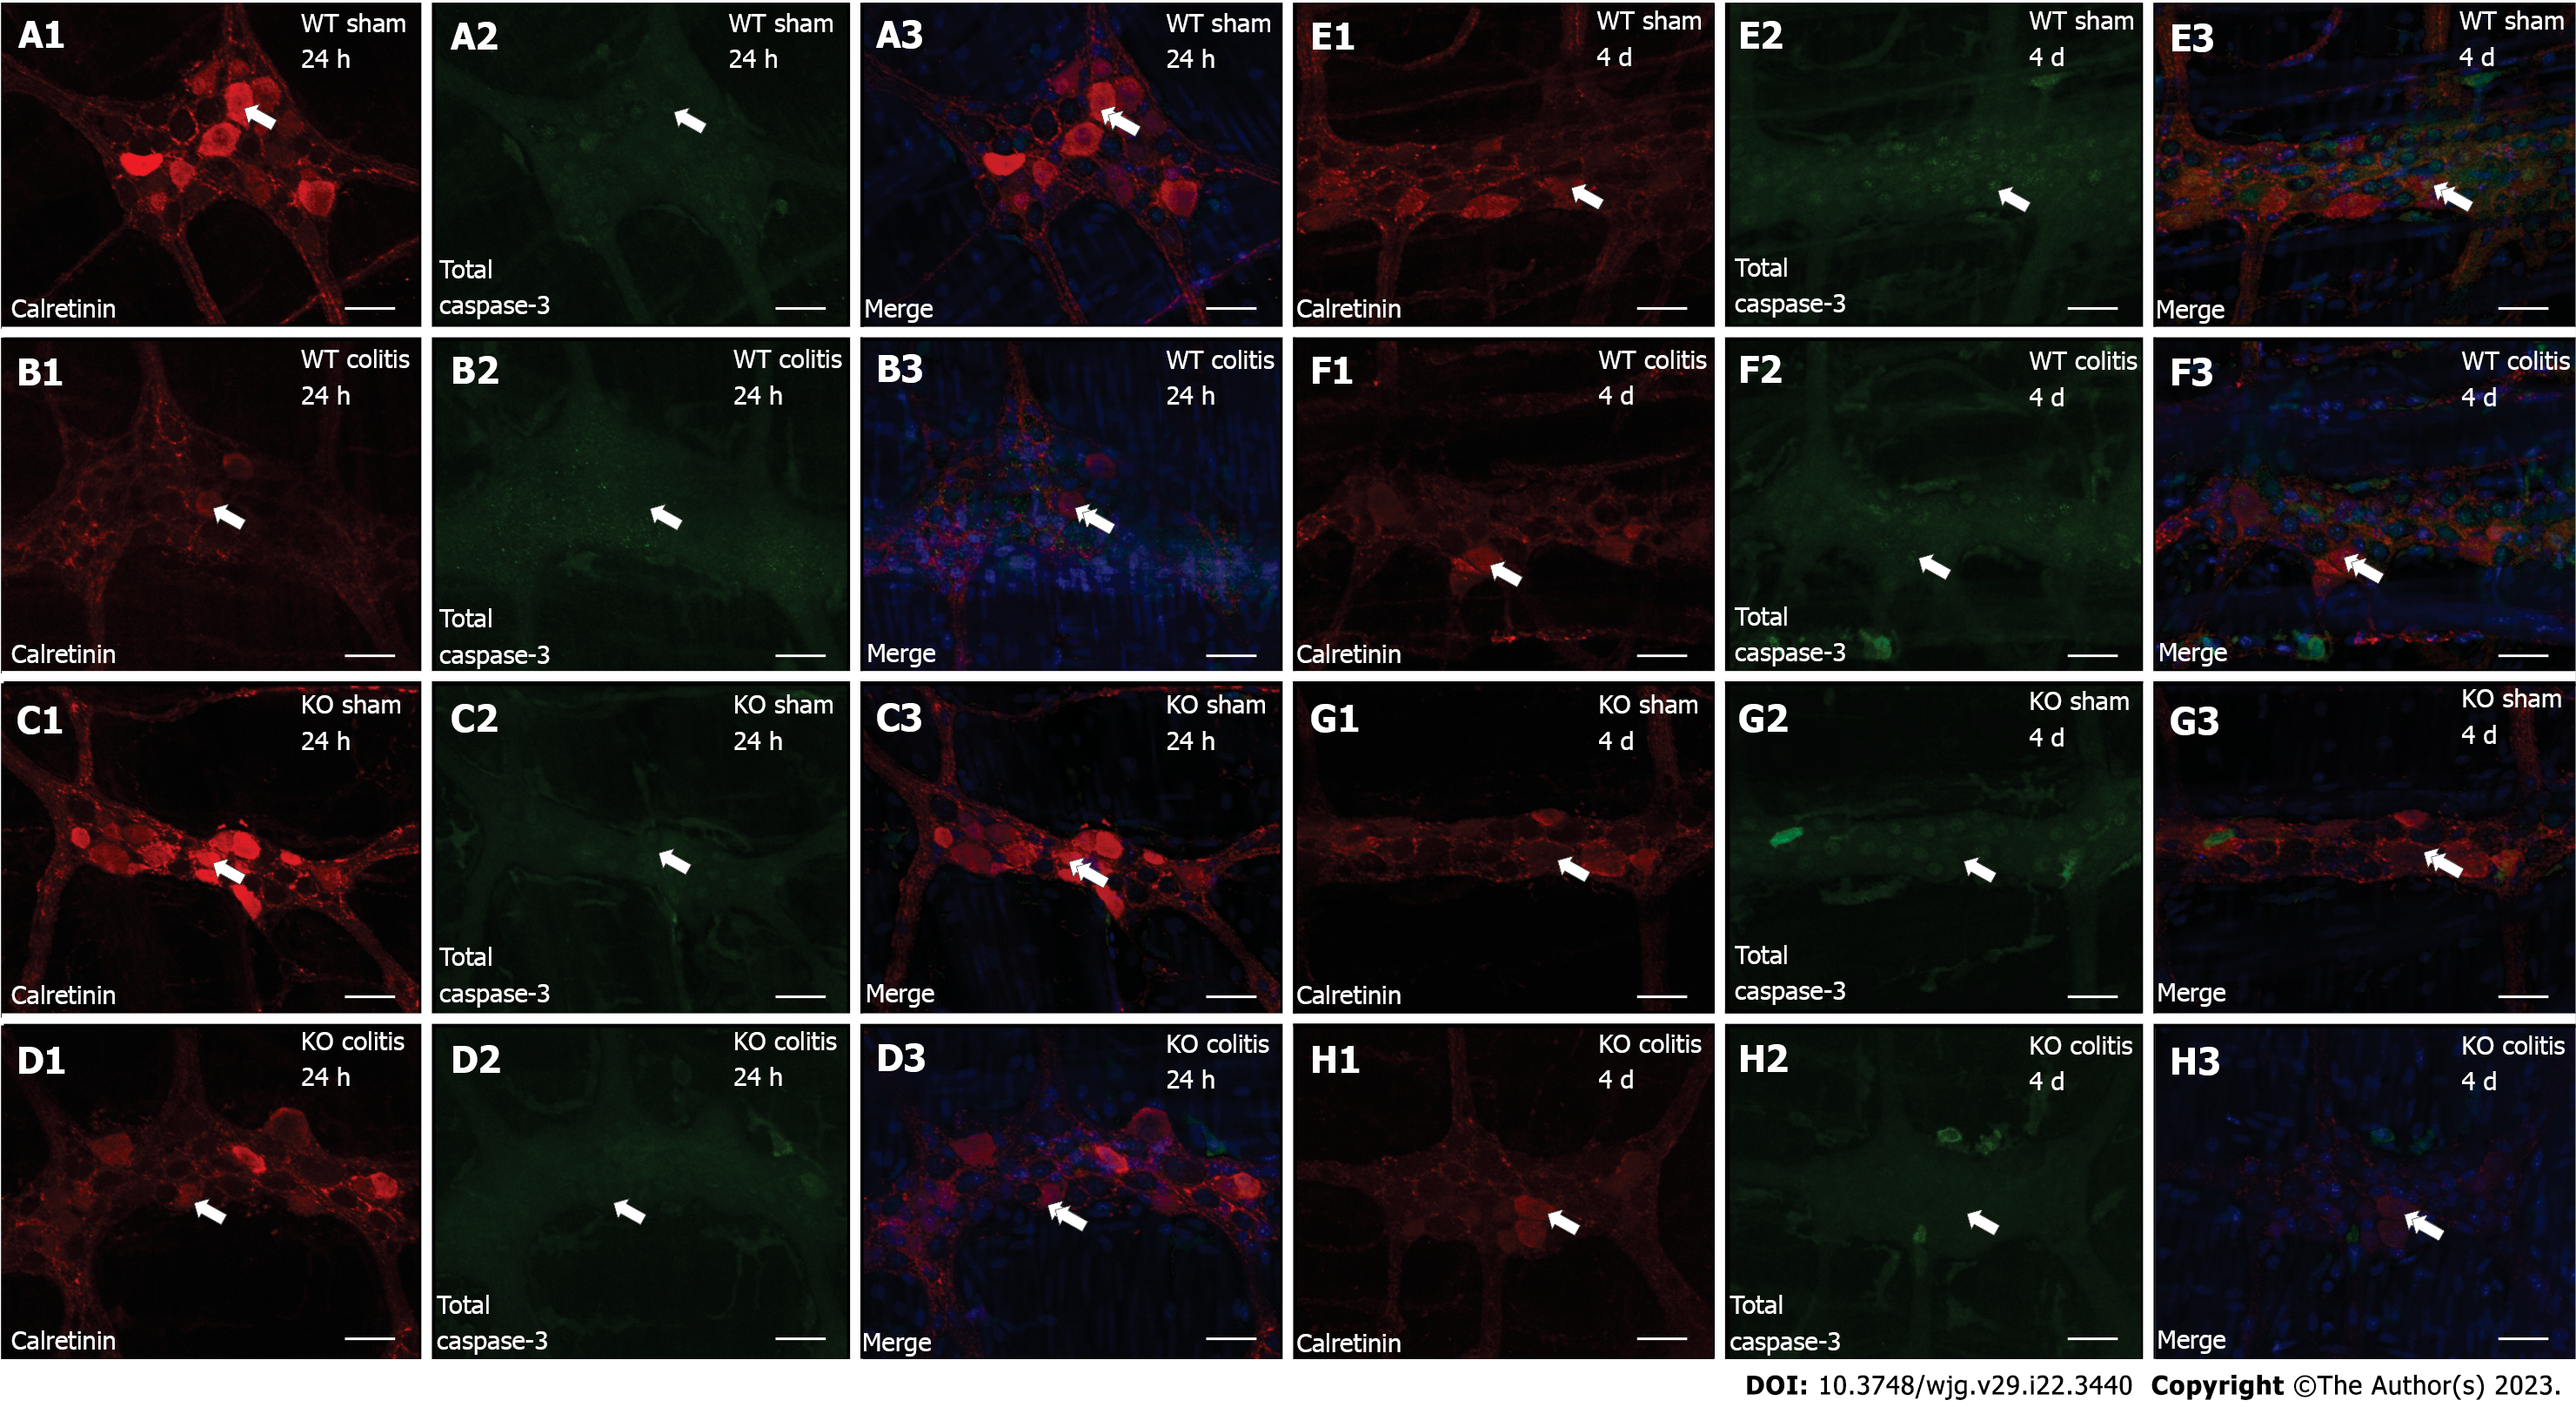
Figure 4 Colocalization of calretinin (red) with total caspase-3 (green) and DAPI (blue) in neurons in the myenteric plexus of the distal colon in mice of different groups.
A1-A3: Wild-type (WT) sham 24 h; B1-B3: WT colitis 24 h; C1-C3: Knockout (KO) sham 24 h; D1-D3: KO colitis 24 h; E1-E3: WT sham 4 d; F1-F3: WT colitis 4 d; G1-G3: KO sham 4 d; and H1-H3: KO colitis 4 d groups. The single arrows indicate calretinin-ir (A1-H1) and total caspase-3-ir (A2-H2) neurons, and the double arrows indicate the colocalization of calretinin with total caspase-3 and DAPI (A3-H3). Scale bar = 30 µm. WT: Wild-type; KO: Knockout.
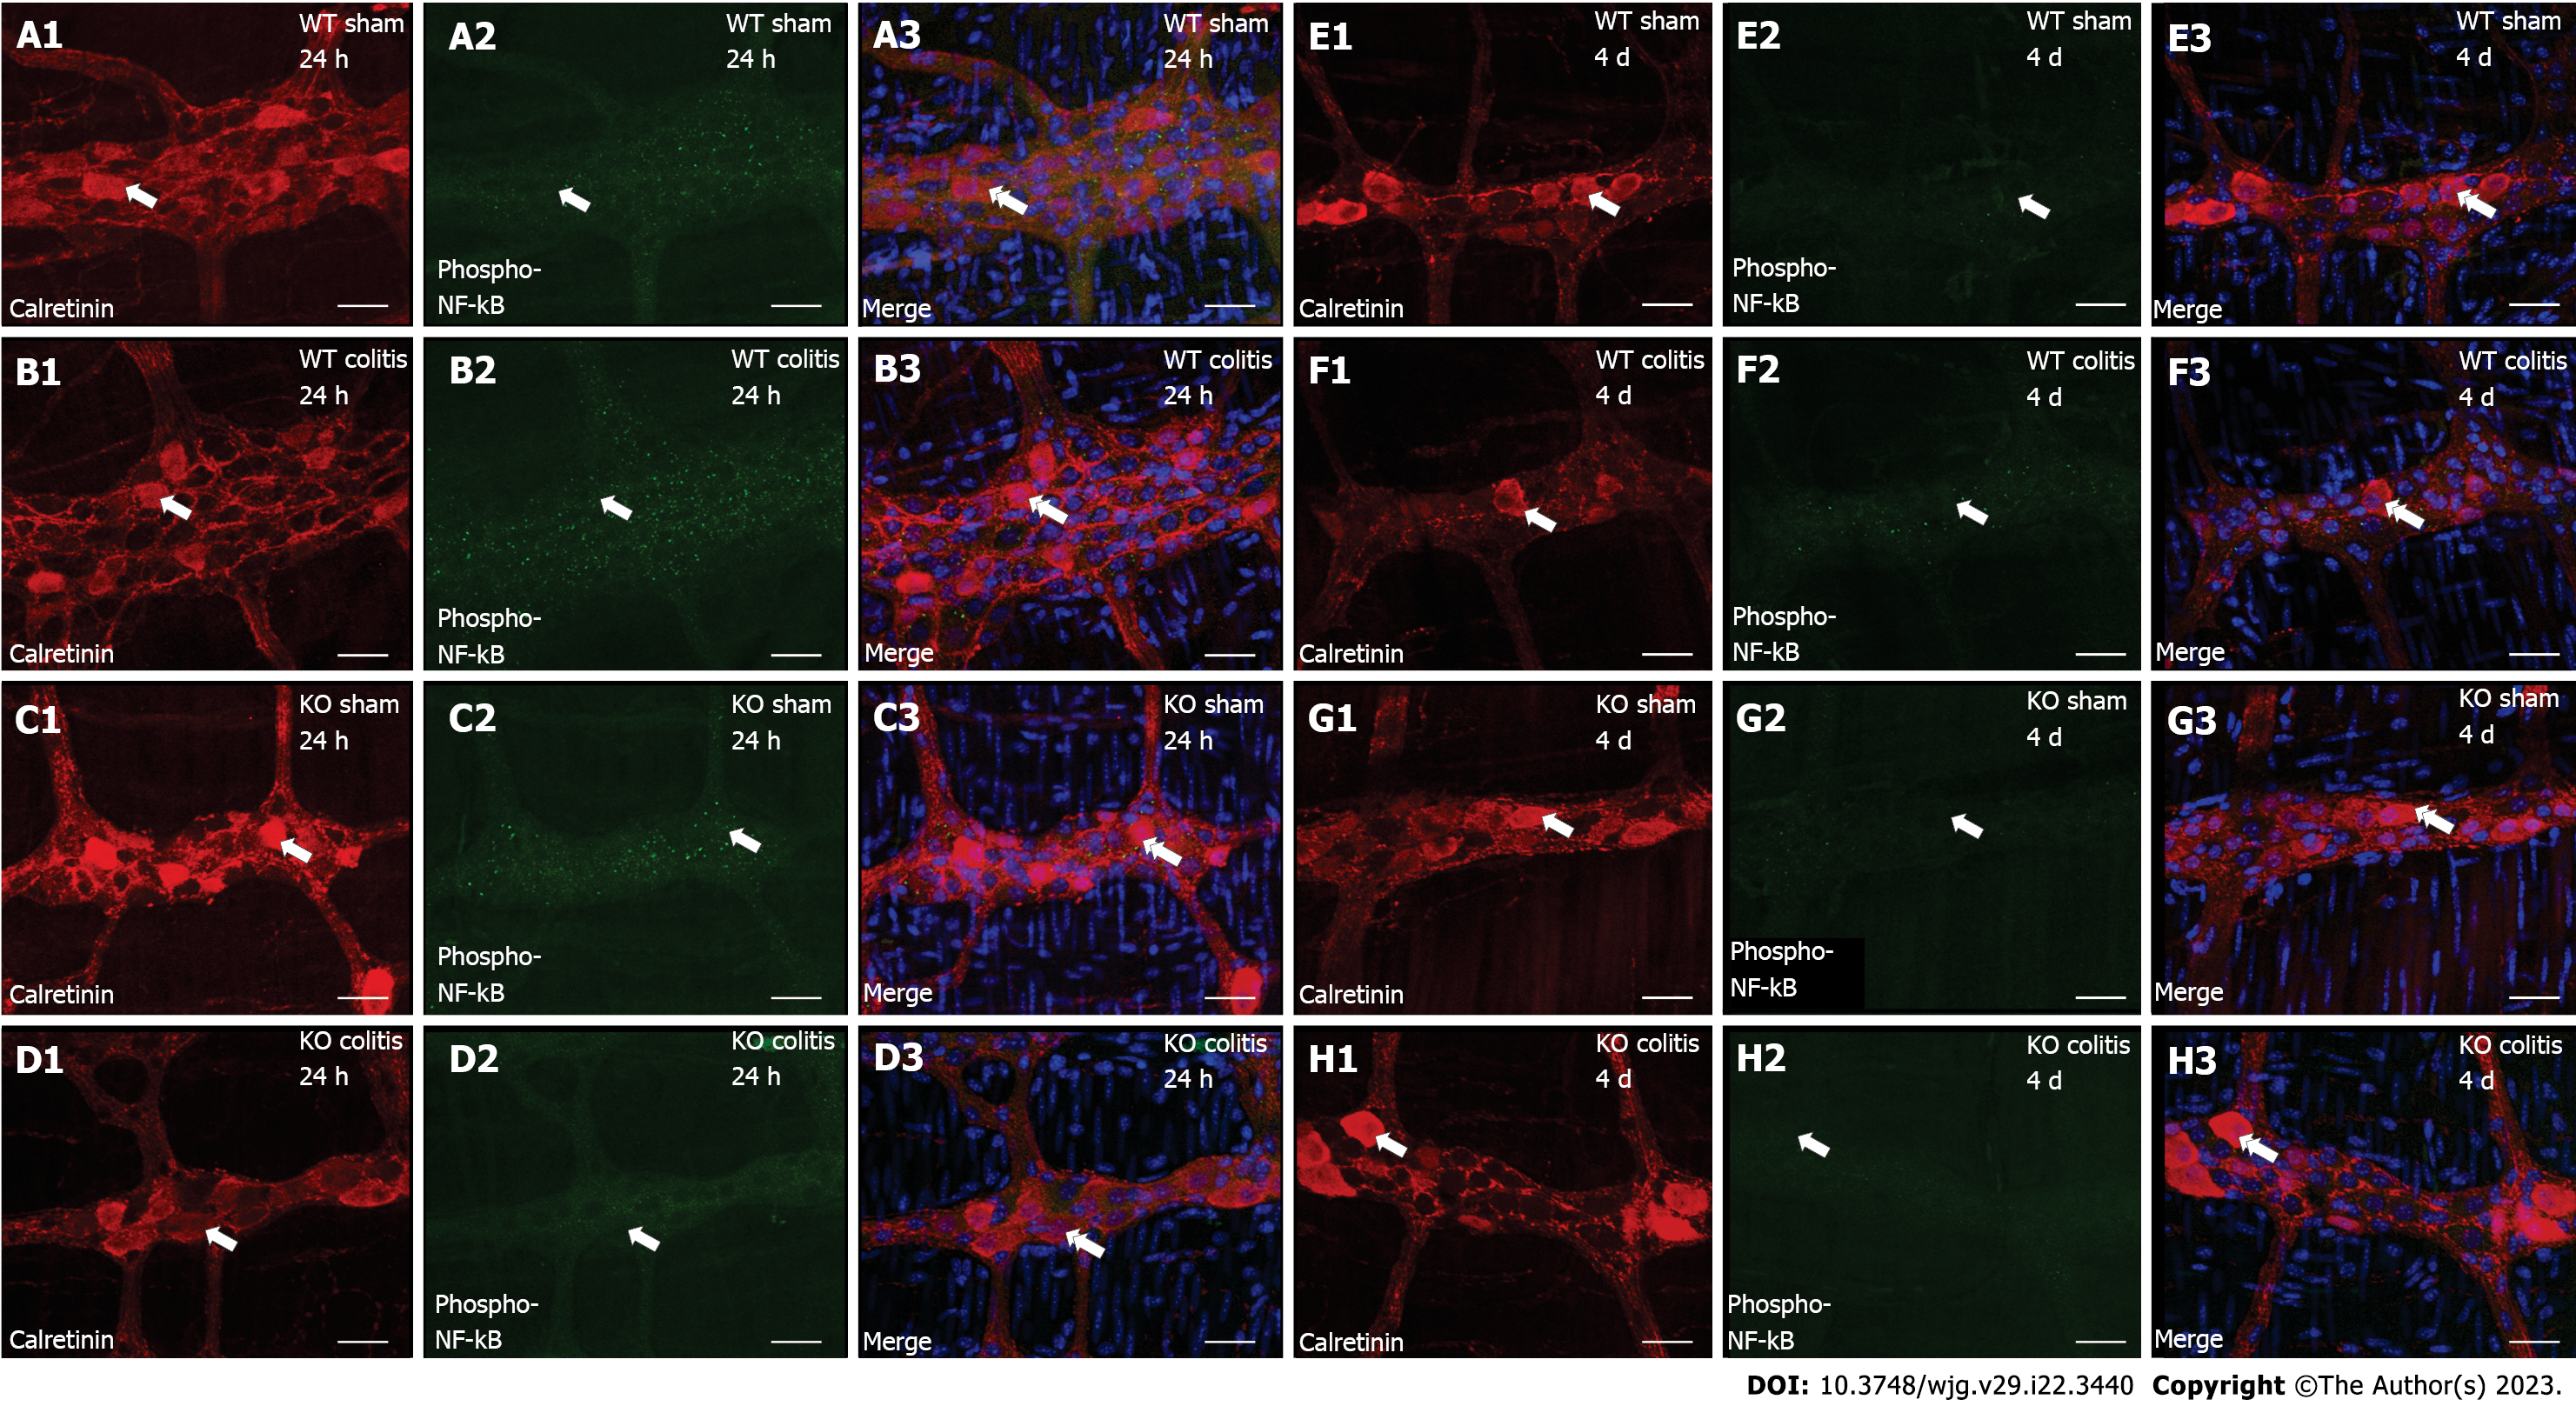
Figure 5 Colocalization of calretinin (red) with phospho-nuclear factor kappa B (green) and DAPI (blue) in neurons in the myenteric plexus of the distal colon in mice of different groups.
A1-A3: Wild-type (WT) sham 24 h; B1-B3: WT colitis 24 h; C1-C3: Knockout (KO) sham 24 h; D1-D3: KO colitis 24 h; E1-E3: WT sham 4 d; F1-F3: WT colitis 4 d; G1-G3: KO sham 4 d; and H1-H3: KO colitis 4 d groups. The single arrows indicate calretinin-ir (A1-H1) and phospho-nuclear factor kappa B (NF-κB)-ir (A2-H2) neurons, and the double arrows indicate the colocalization of calretinin with phospho- NF-κB and DAPI (A3-H3). Scale bar = 30 µm. WT: Wild-type; KO: Knockout.
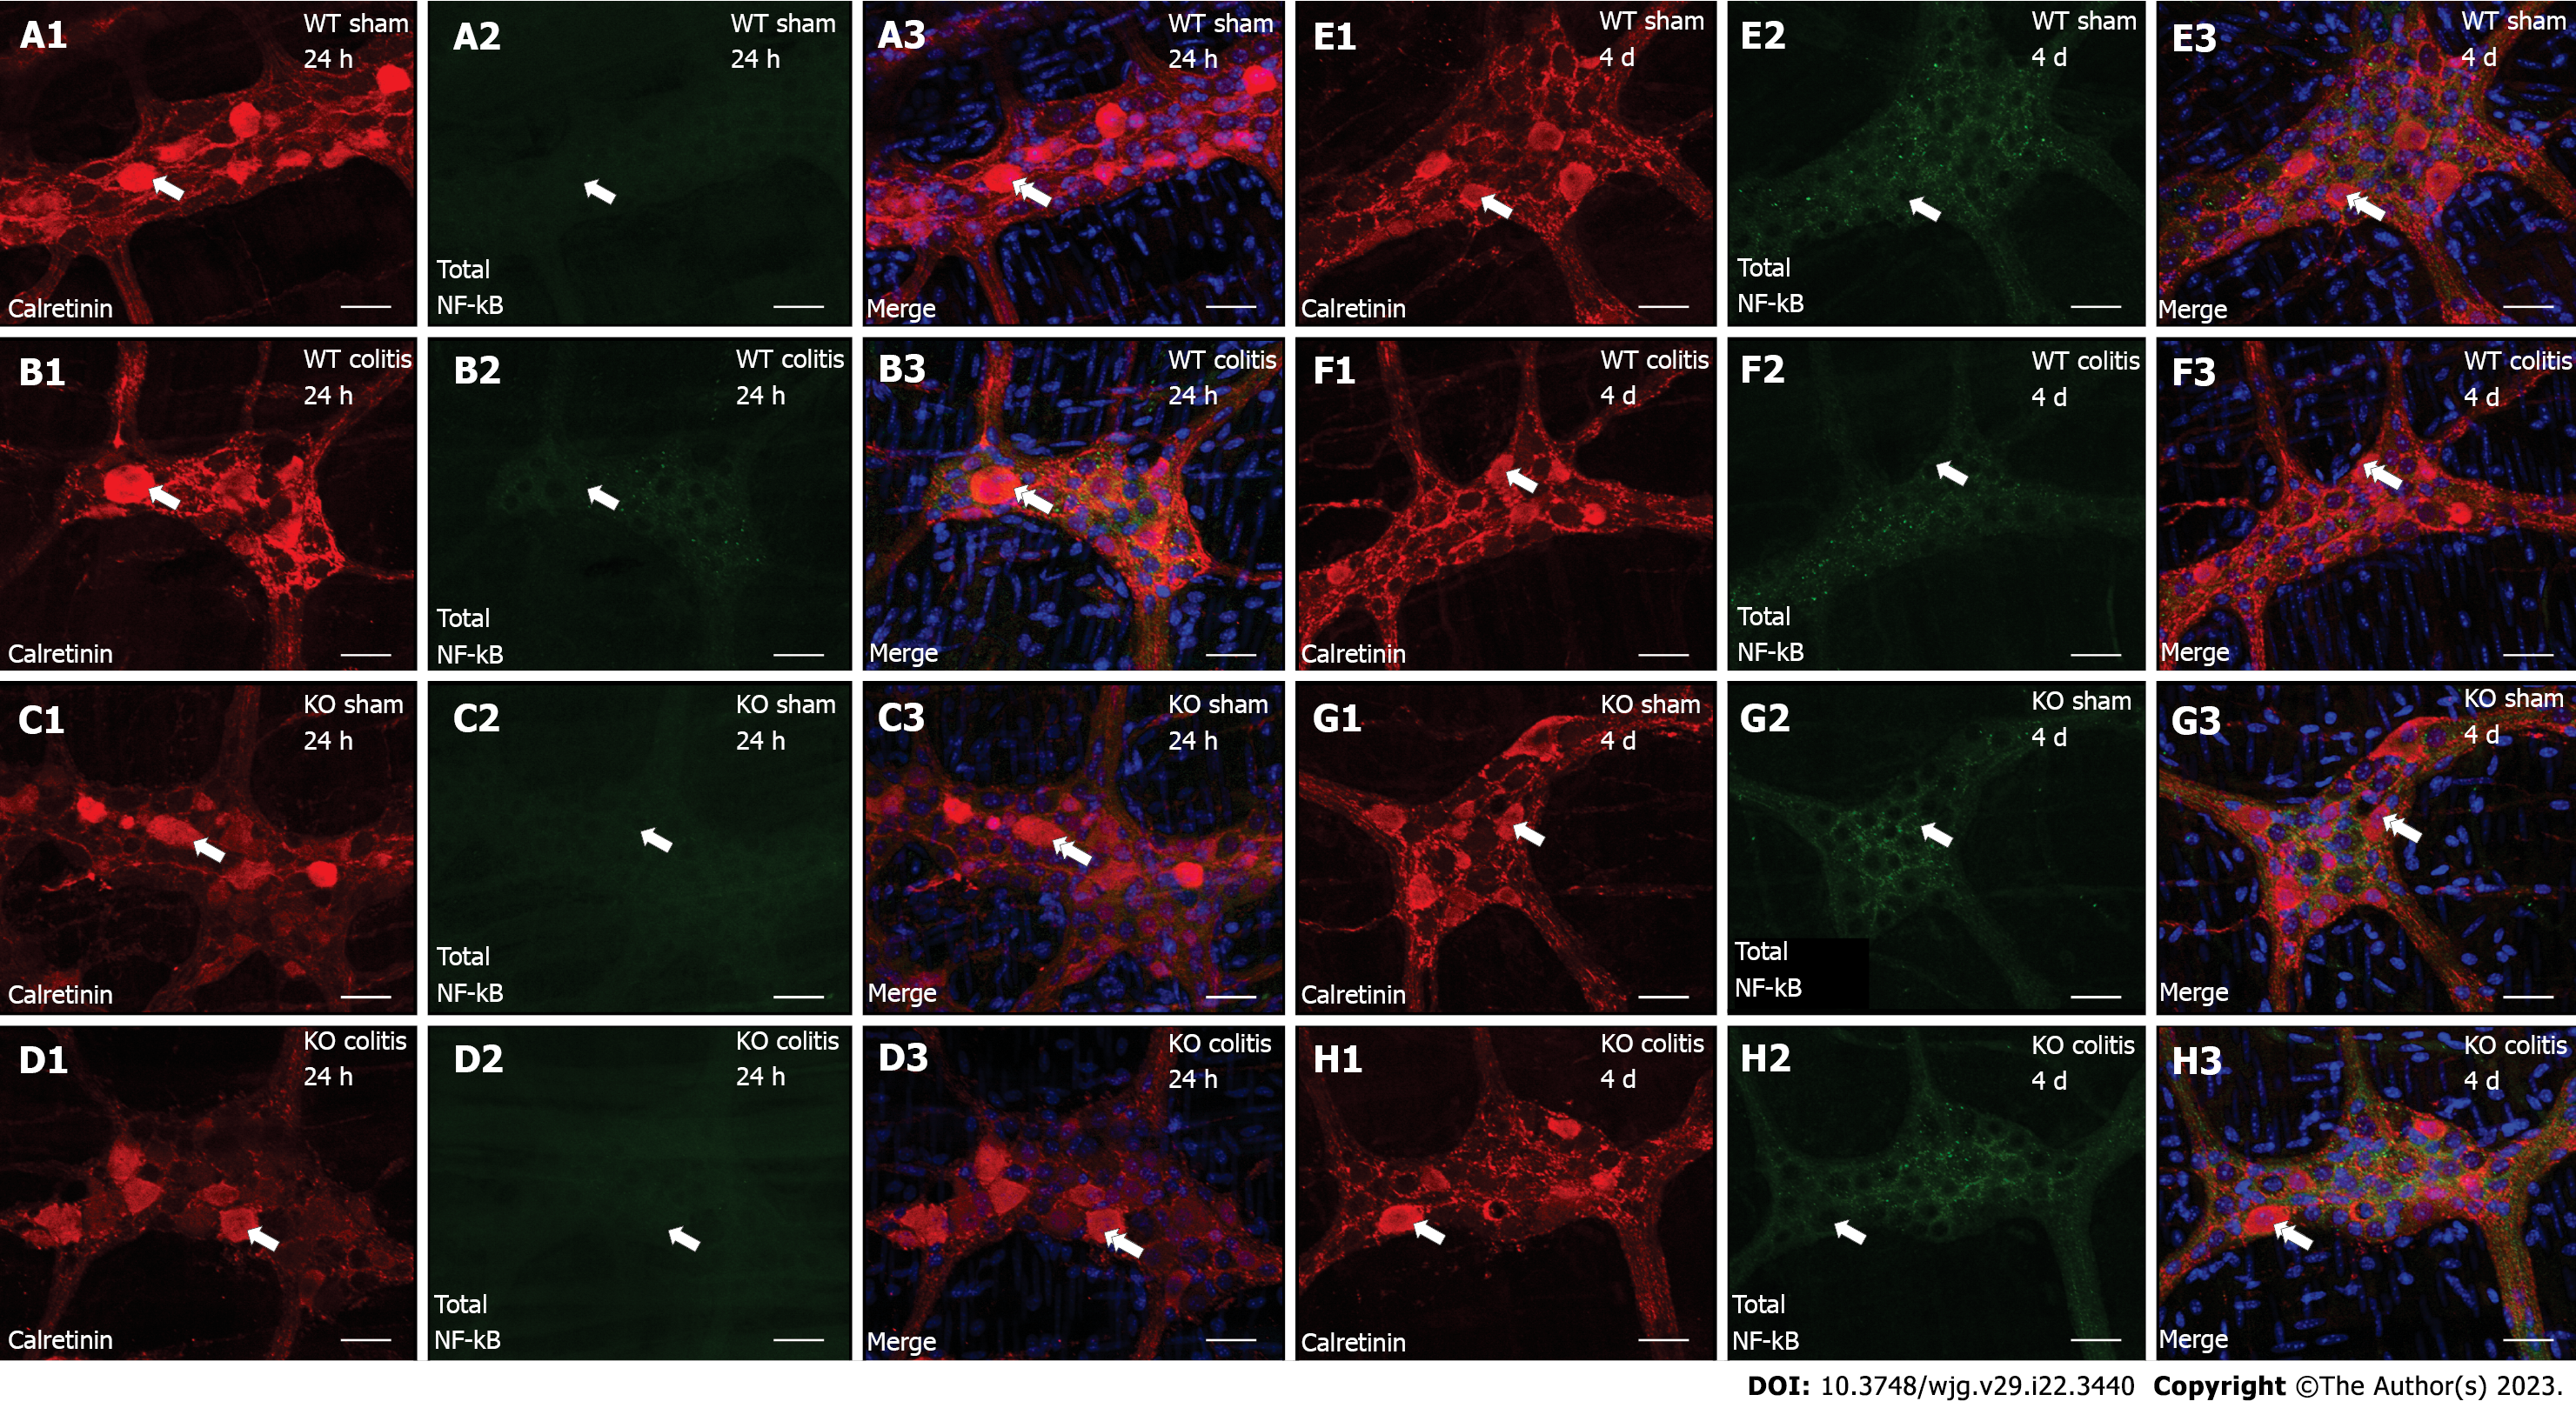
Figure 6 Colocalization of calretinin (red) with total nuclear factor kappa B (green) and DAPI (blue) in neurons in the myenteric plexus of the distal colon in mice of different groups.
A1-A3: Wild-type (WT) sham 24 h; B1-B3: WT colitis 24 h; C1-C3: Knockout (KO) sham 24 h; D1-D3: KO colitis 24 h; E1-E3: WT sham 4 d; F1-F3: WT colitis 4 d; G1-G3: KO sham 4 d; and H1-H3: KO colitis 4 d groups. The single arrows indicate calretinin-ir (A1-H1) and total nuclear factor kappa B (NF-κB)-ir (A2-H2) neurons, and the double arrows indicate the colocalization of calretinin with total NF-κB and DAPI (A3-H3). Scale bar = 30 µm. WT: Wild-type; KO: Knockout.
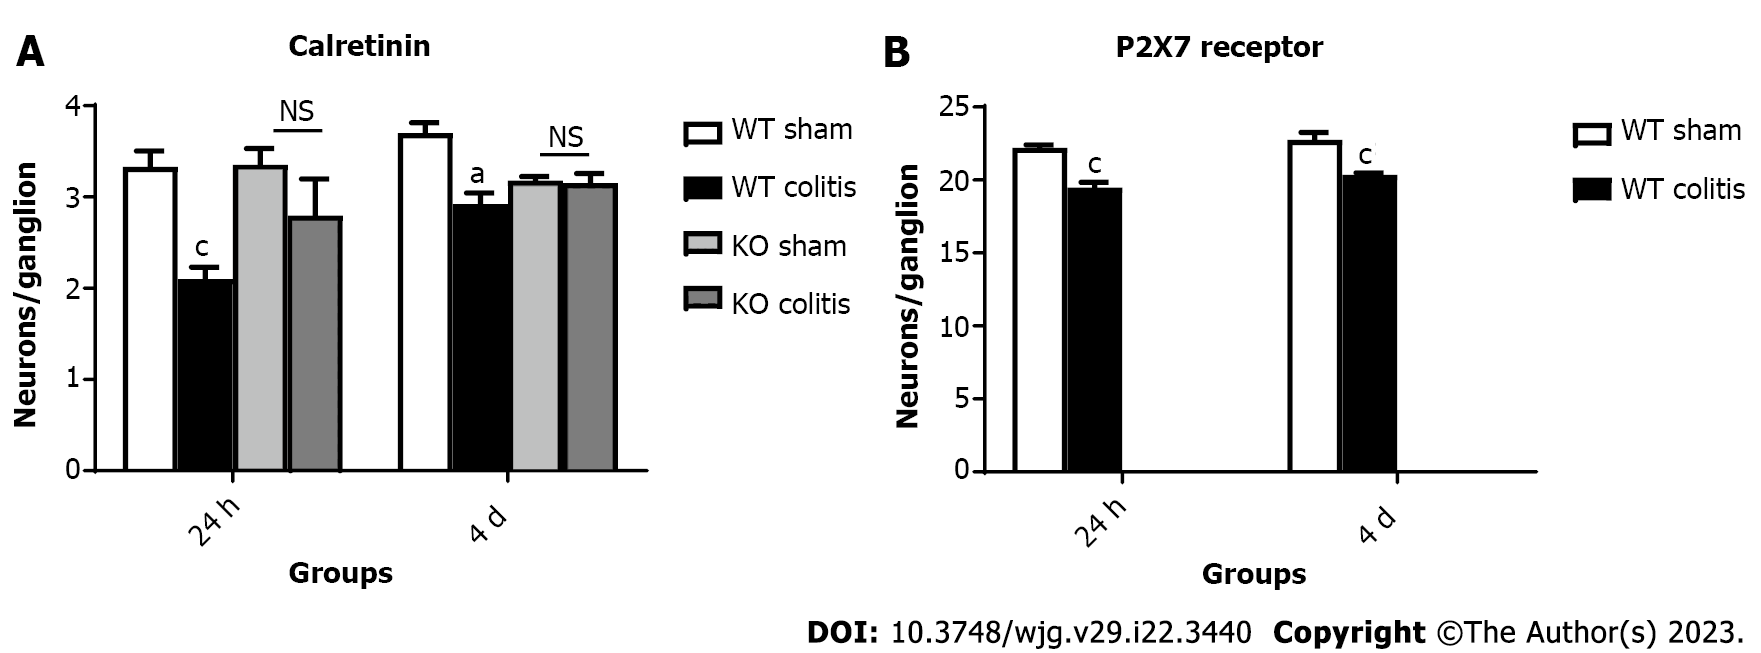
Figure 7 Number of calretinin-ir and P2X7 receptor-ir neurons per myenteric ganglion in the distal colon in mice from the wild-type sham 24 h and 4 d, wild-type colitis 24 h and 4 d, knockout sham 24 h and 4 d, and knockout colitis 24 h and 4 d groups.
A: Calretinin-ir; B: P2X7 receptor-ir. The data are presented as the arithmetic mean ± SE. aP < 0.05 vs sham groups; cP < 0.001 vs sham groups; NS: Not significant. WT: Wild-type; KO: Knockout.
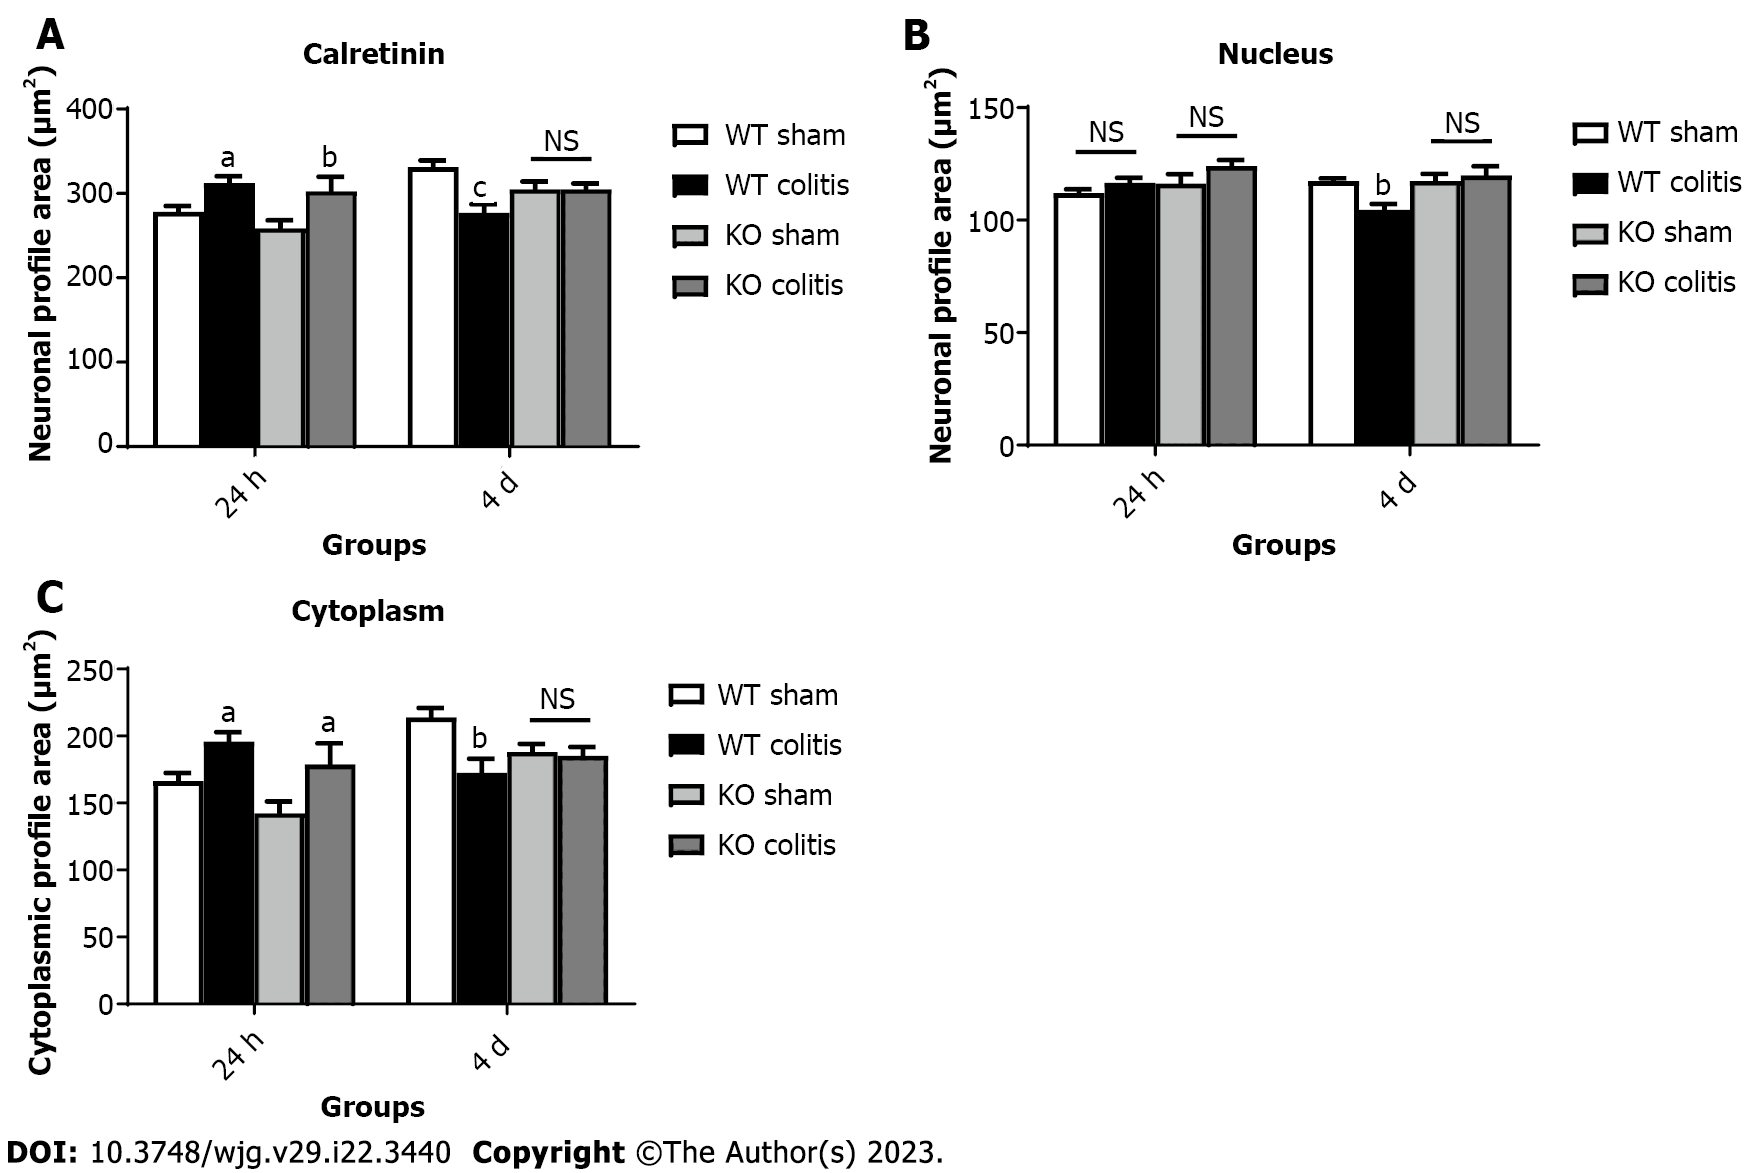
Figure 8 Neuronal, nuclear, and cytoplasmic profile areas of calretinin-ir neurons in the myenteric plexus of the distal colon in mice from the wild-type sham 24 h and 4 d, wild-type colitis 24 h and 4 d, knockout sham 24 h and 4 d, and knockout colitis 24 h and 4 d groups.
A: Neuronal; B: Nuclear; C: Cytoplasmic. The data are presented as the arithmetic mean ± SE. aP < 0.05 vs sham groups; bP < 0.01 vs sham groups; cP < 0.001 vs sham groups; NS: Not significant. WT: Wild-type; KO: Knockout.
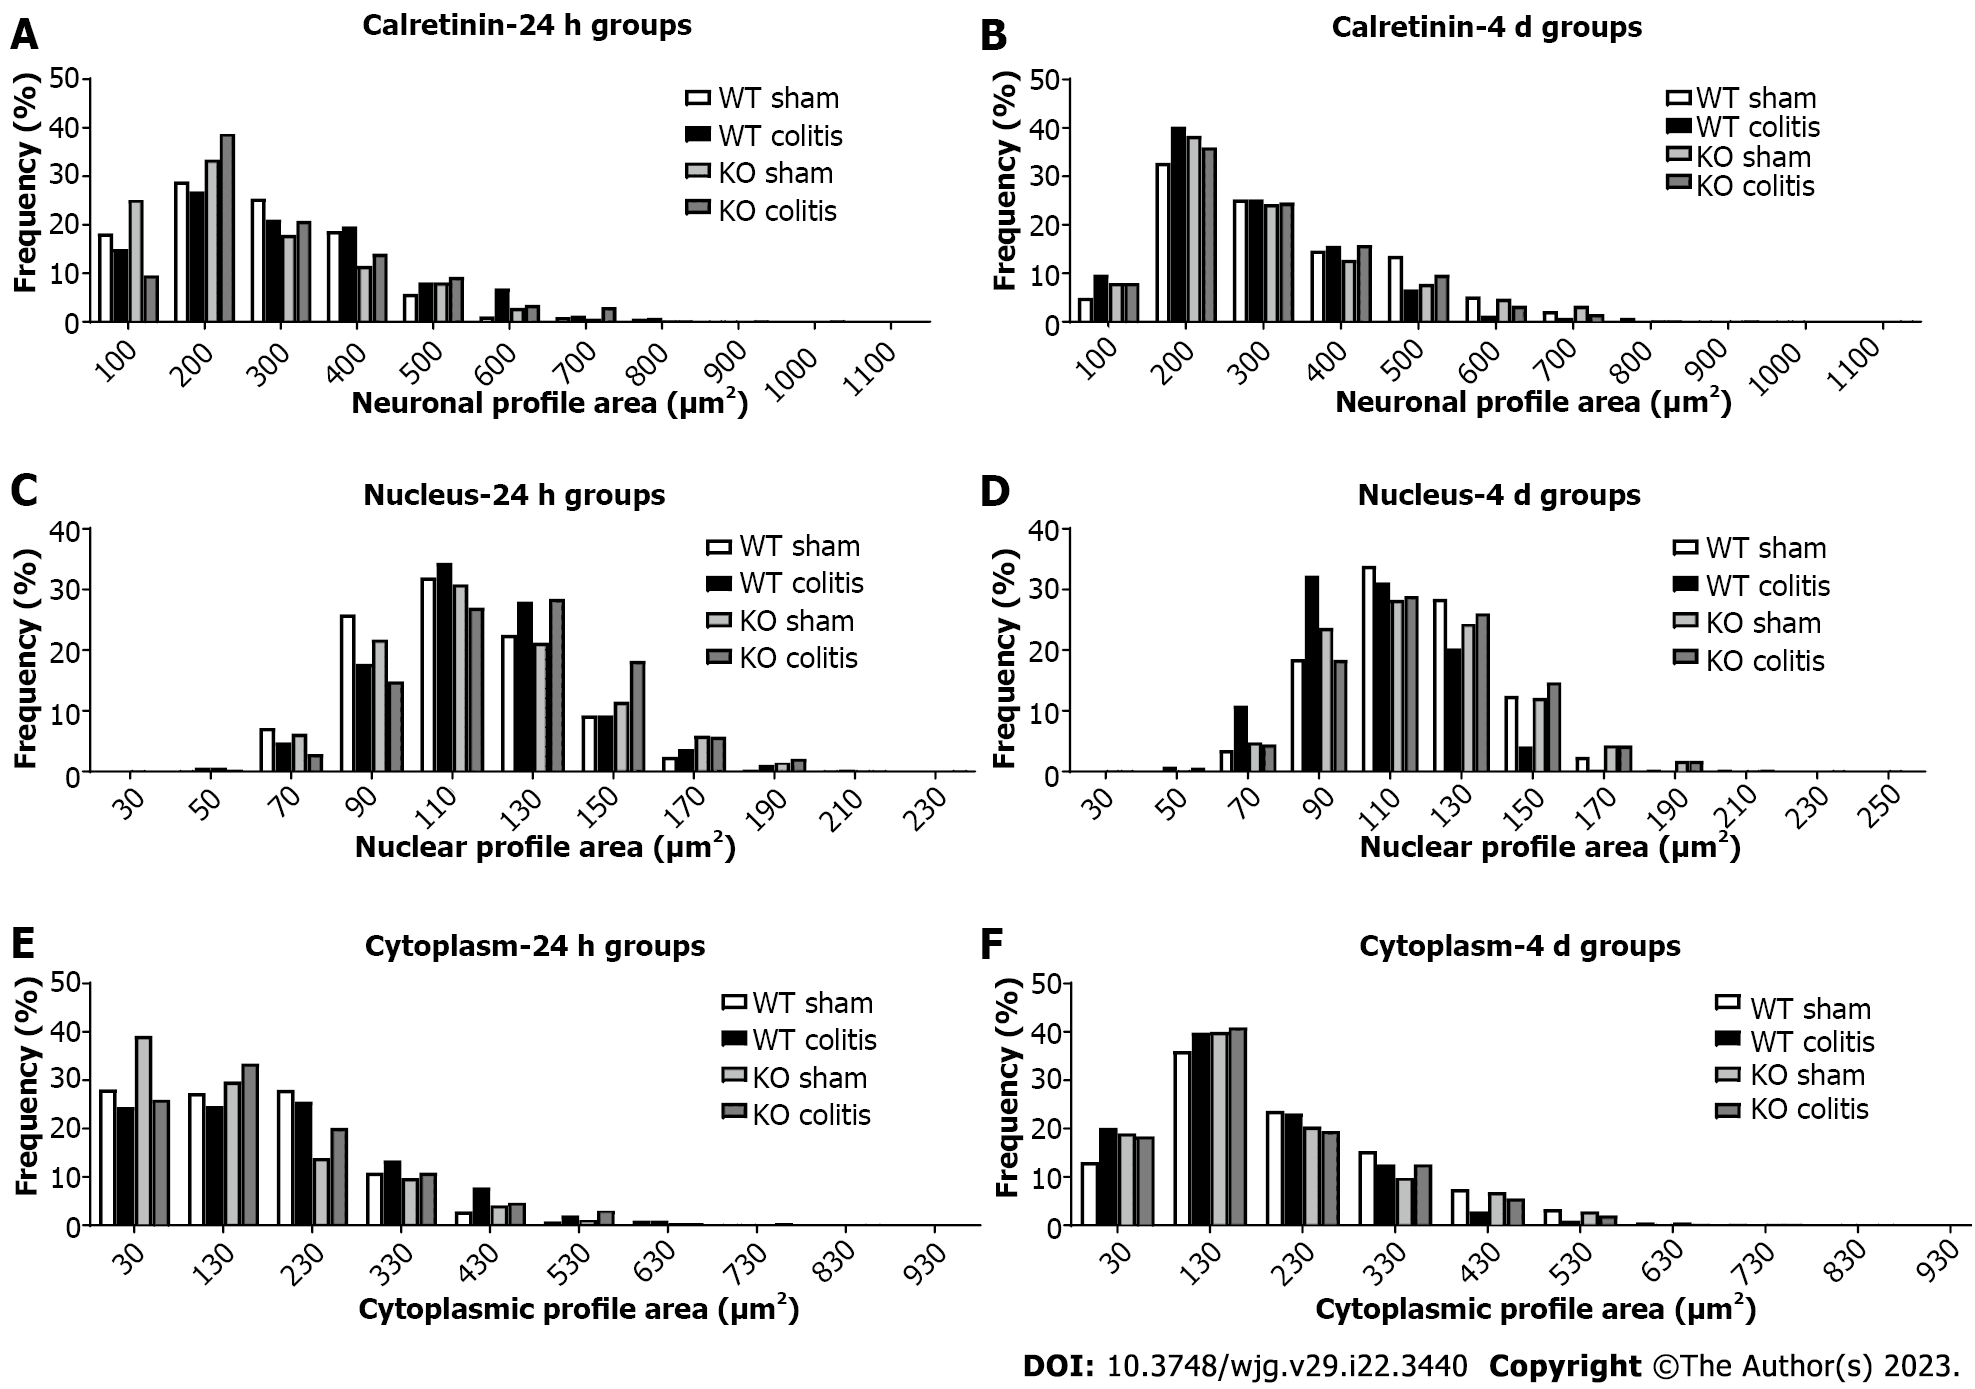
Figure 9 Distribution frequency (%) of the profile areas.
A and B: Calretinin-ir neurons; C and D: Calretinin-ir nucleus; E and F: Calretinin-ir cytoplasm in the myenteric plexus of the distal colon in mice from the wild-type (WT) sham 24 h and 4 d, WT colitis 24 h and 4 d, knockout (KO) sham 24 h and 4 d, and KO colitis 24 h and 4 d groups. WT: Wild-type; KO: Knockout.
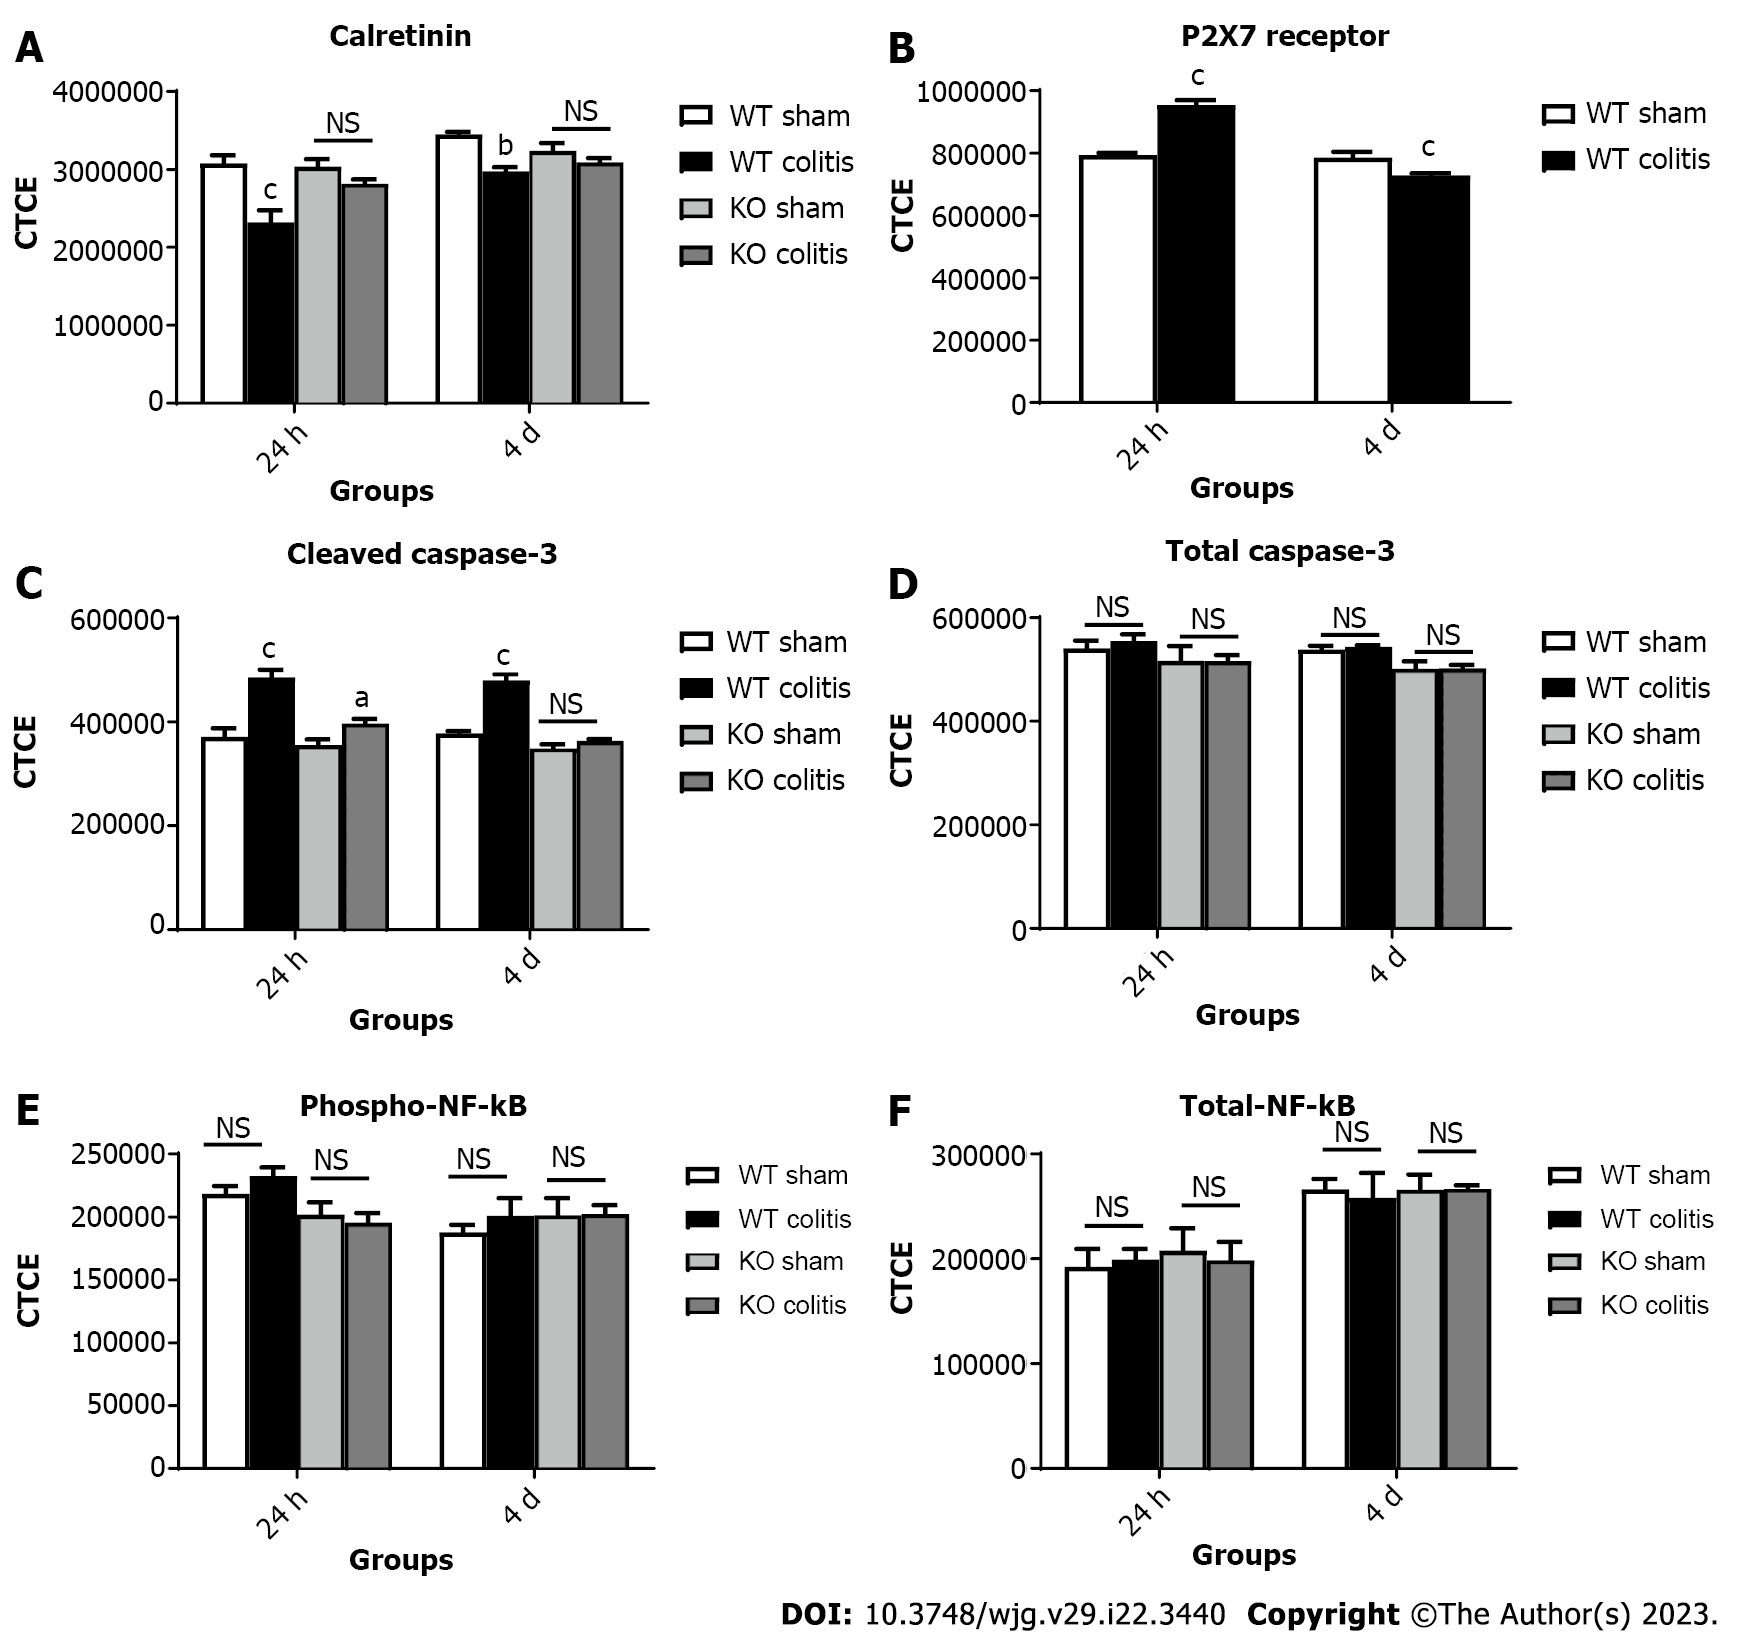
Figure 10 Corrected total cell fluorescence of myenteric neurons.
A: calretinin; B: P2X7 receptor; C: Cleaved caspase-3; D: Total caspase-3; E: Phospho-nuclear factor kappa B (NF-κB); F: Total NF-κB in the myenteric plexus of the distal colon in mice from the WT sham 24 h and 4 d, wild-type (WT) colitis 24 h and 4 d, knockout (KO) sham 24 h and 4 d, and KO colitis 24 h and 4 d groups. The data are presented as the arithmetic mean ± SE. aP < 0.05 vs sham groups; bP < 0.01 vs sham groups; cP < 0.001 vs sham groups; NS: Not significant. WT: Wild-type; KO: Knockout; NF-κB: Nuclear factor kappa B.
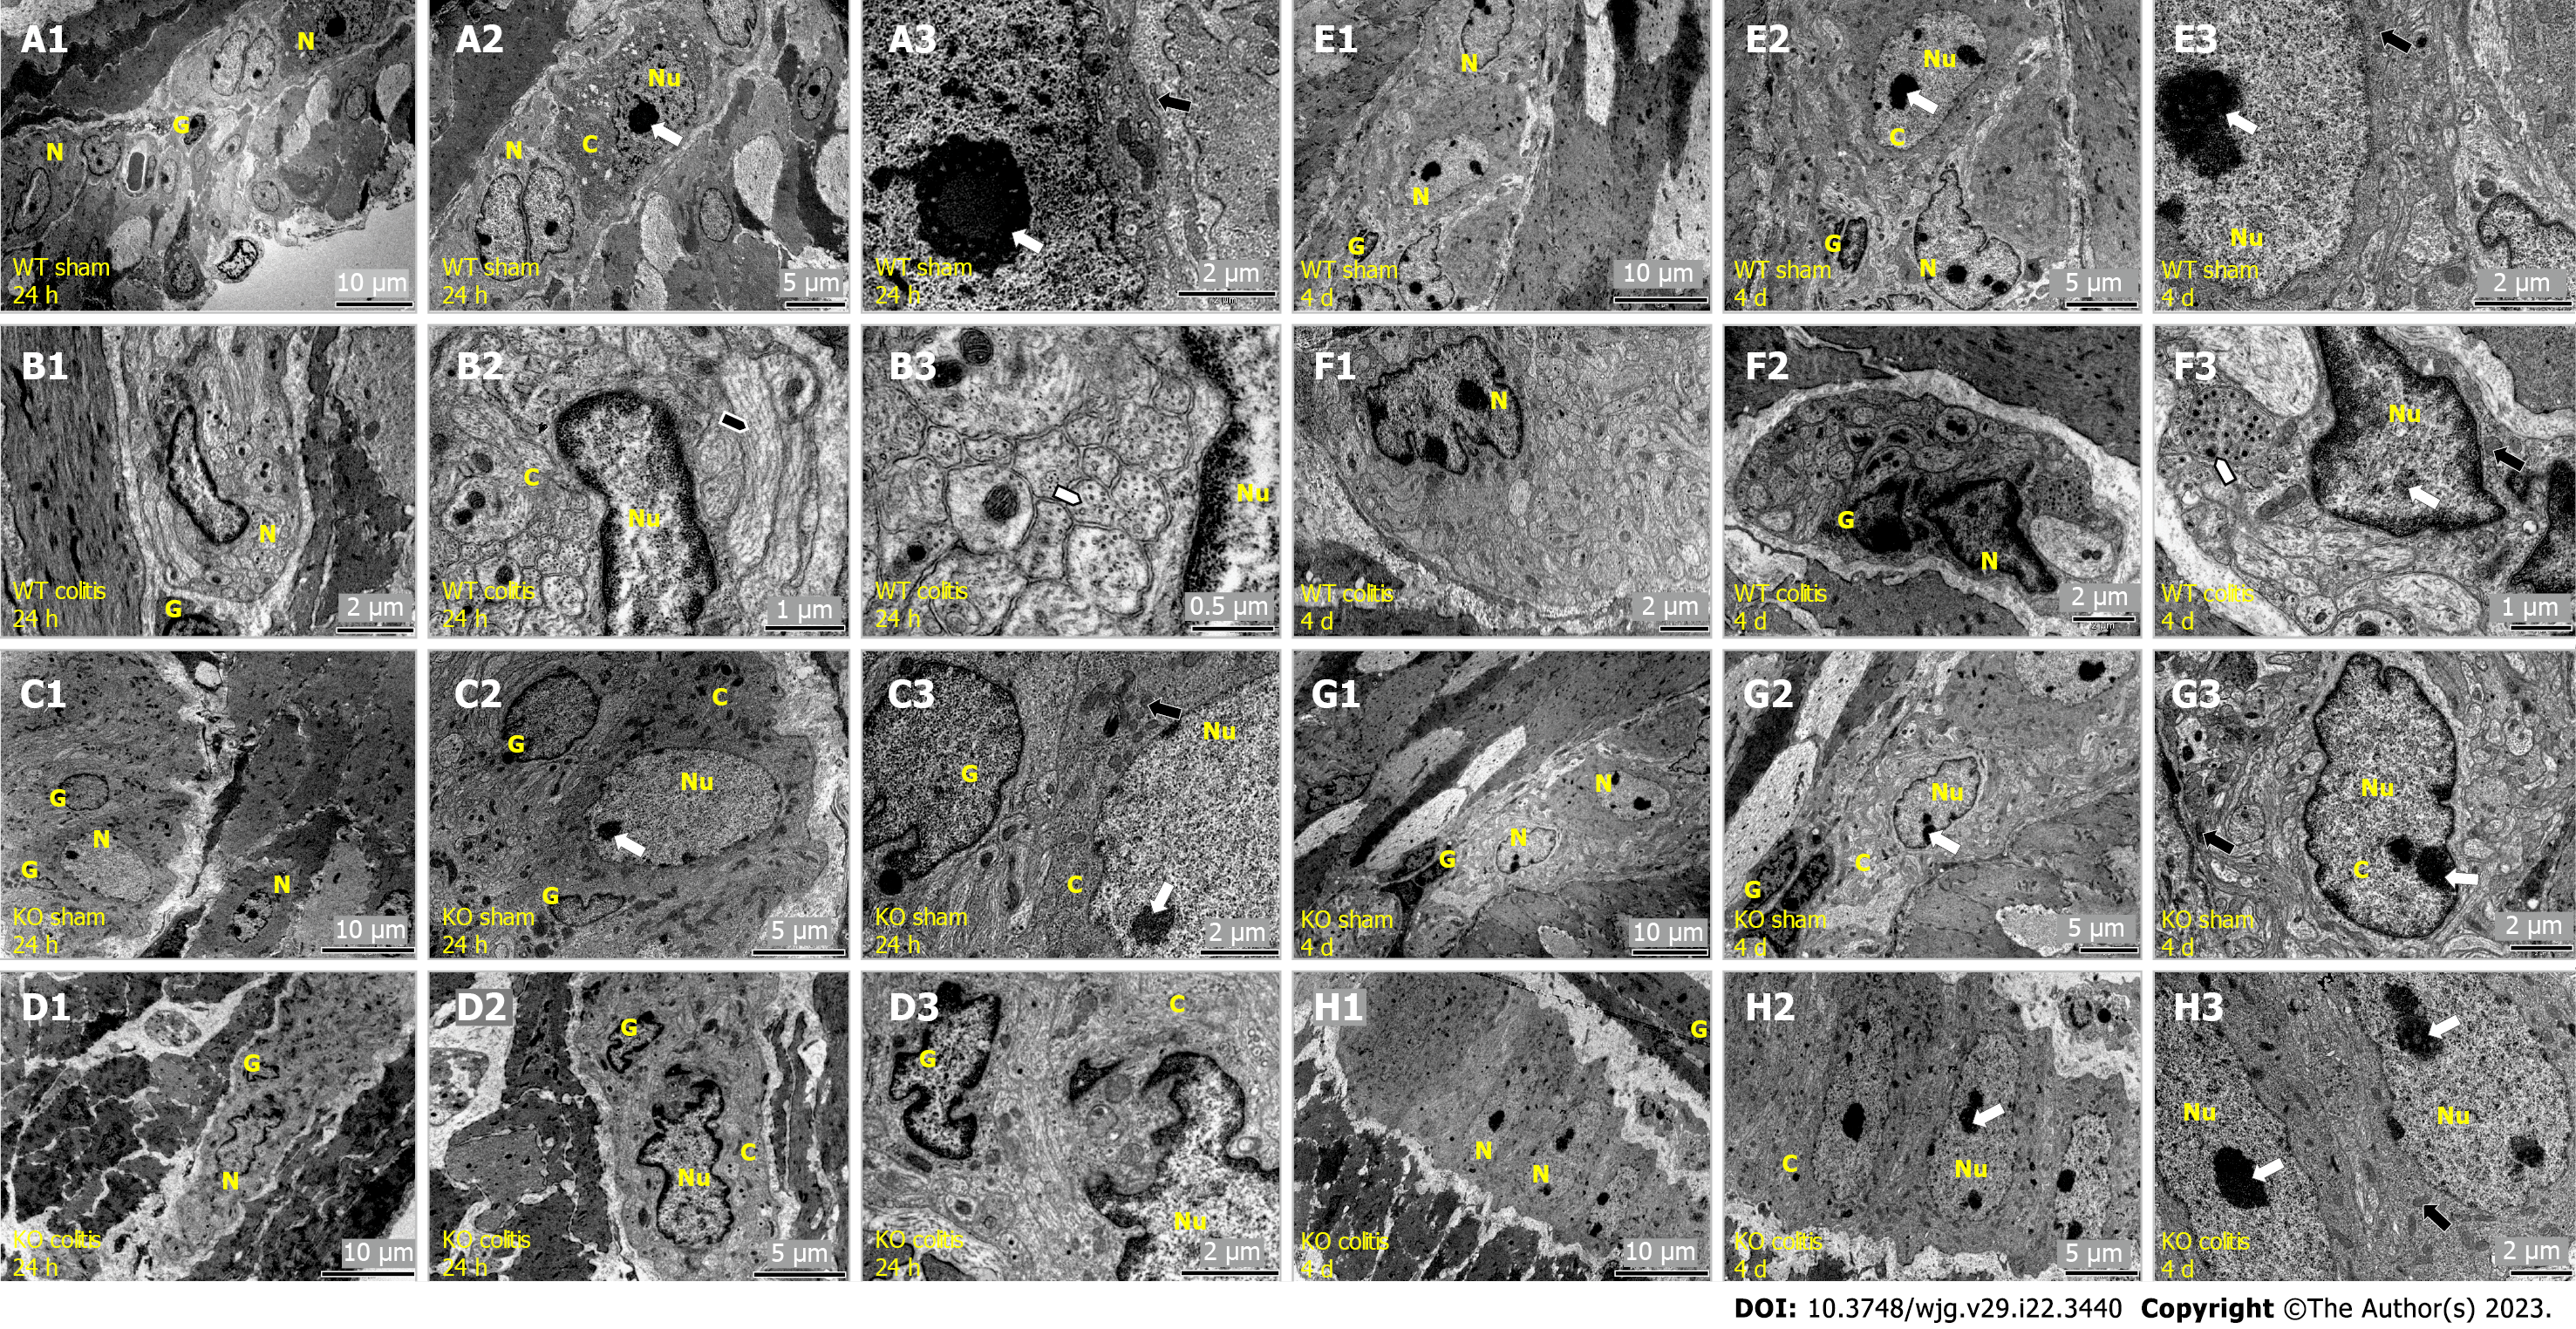
Figure 11 Transmission electron microscopy photomicrograph showing the ultrastructural organization of the myenteric plexus of the distal colon in mice.
A1-A3: Wild-type (WT) sham 24 h; B1-B3: WT colitis 24 h; C: Knockout (KO) sham 24 h; D1-D3: KO colitis 24 h; E1-E3: WT sham 4 d; F1-F3: WT colitis 4 d; G1-G3: KO sham 4 d; H1-H3: KO colitis 4 d groups. In the WT colitis 24 h and KO colitis 24 h groups, neurons with a necrotic phenotype characterized by nuclear disruption and apparent nuclear autolysis, chromatin fragmentation and condensation, and cytoplasmic disorganization were observed. Enteric glial cells also showed morphological changes. In the WT colitis 4 d group and less frequently in the KO colitis 4 d group, neurons showed irregular nuclei and nuclear membrane invaginations. The cell membrane remained intact, and apoptotic bodies were sometimes observed. Enteric glial cells also showed features consistent with cell apoptosis. In the WT sham 24 h, KO sham 24 h, WT sham 4 d and KO sham 4 d groups, neurons exhibited large and rounded/oval nuclei, and there were no signs of structural changes in the cytoplasm. N: Myenteric neuron; G: Enteric glial cells; C: Myenteric neuron cytoplasm; Nu: Myenteric neuron nucleus. Nucleolus (white arrow), mitochondria (black arrow), nuclear membrane invaginations (black arrowhead), and vesicles and microtubules (white arrowhead). WT: Wild-type; KO: Knockout.
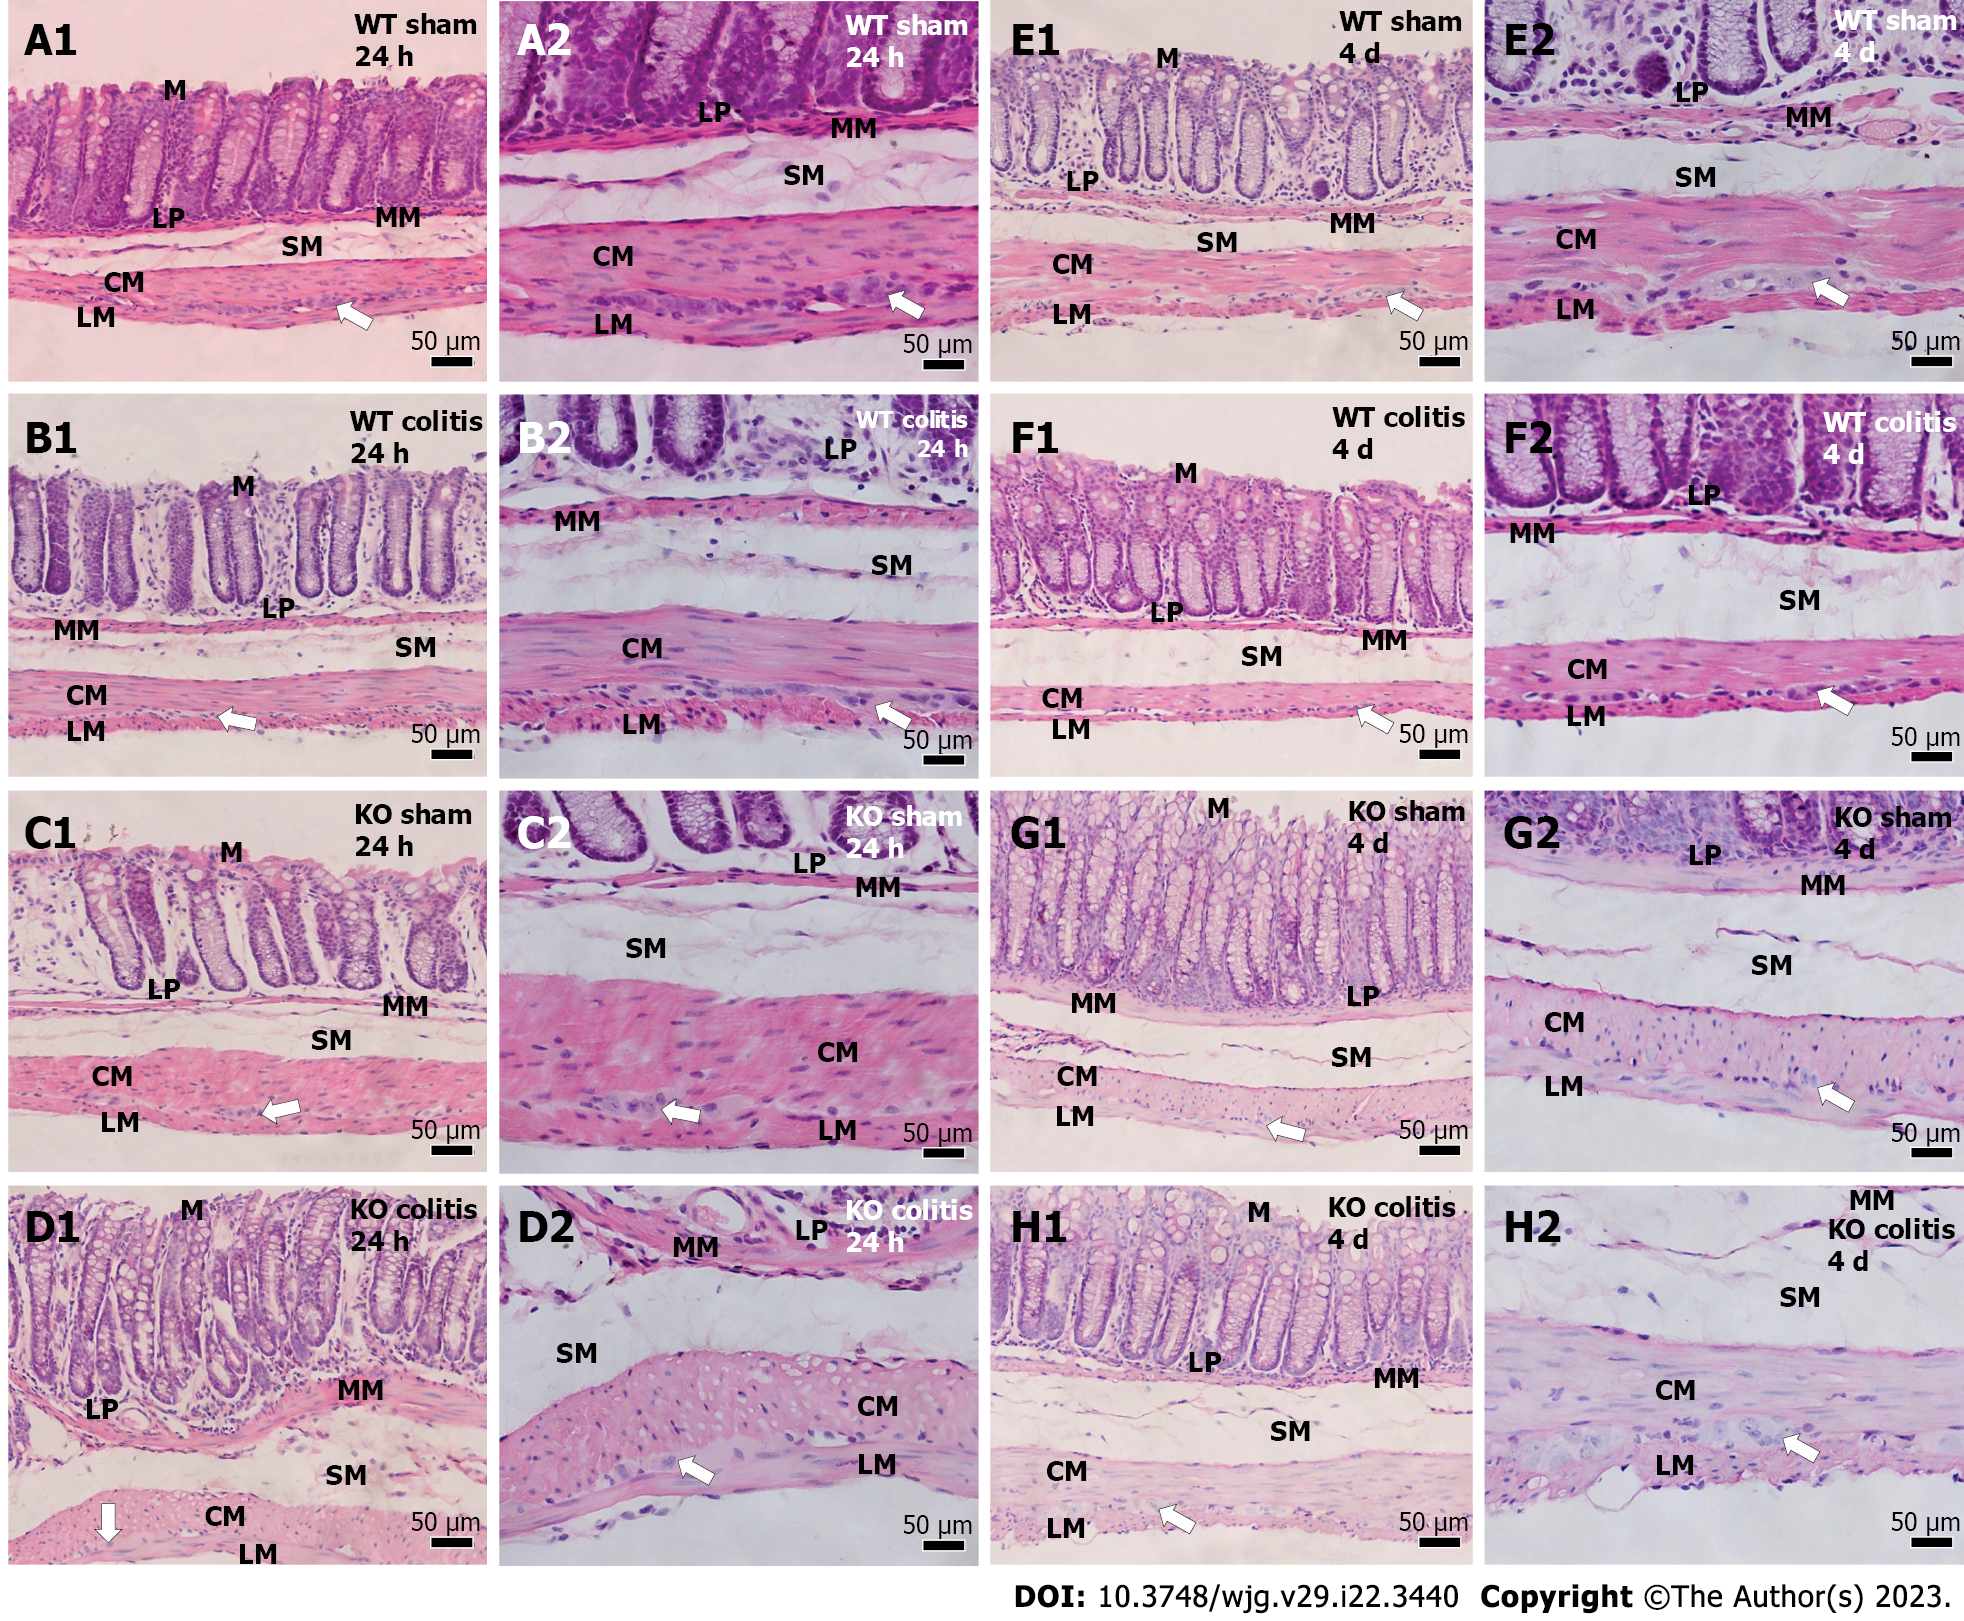
Figure 12 Photomicrographs of hematoxylin-eosin-stained transverse sections of the distal colons of mice of different groups.
A1 and A2: Wild-type (WT) sham 24 h; B1 and B2: WT colitis 24 h; C1 and C2: Knockout (KO) sham 24 h; D1 and D2: KO colitis 24 h; E1 and E2: WT sham 4 d; F1 and F2: WT colitis 4 d; G1 and G2: KO sham 4 d; H1 and H2: KO colitis 4 d groups. Tissue integrity was maintained in the sham groups, and cellular disruption and thickening of the lamina propria and submucosal layer were observed in the WT colitis group. Tissue was better preserved, and there were fewer inflammatory cells in the KO colitis group than in the WT colitis group. M: Mucosal layer; LP: Lamina propria; MM: Mucosal muscle; SM: Submucosal layer; ML: Muscle layer; CM: Circular musculature; LM: Longitudinal musculature; WT: Wild-type; KO: Knockout. White arrows mean myenteric ganglion.
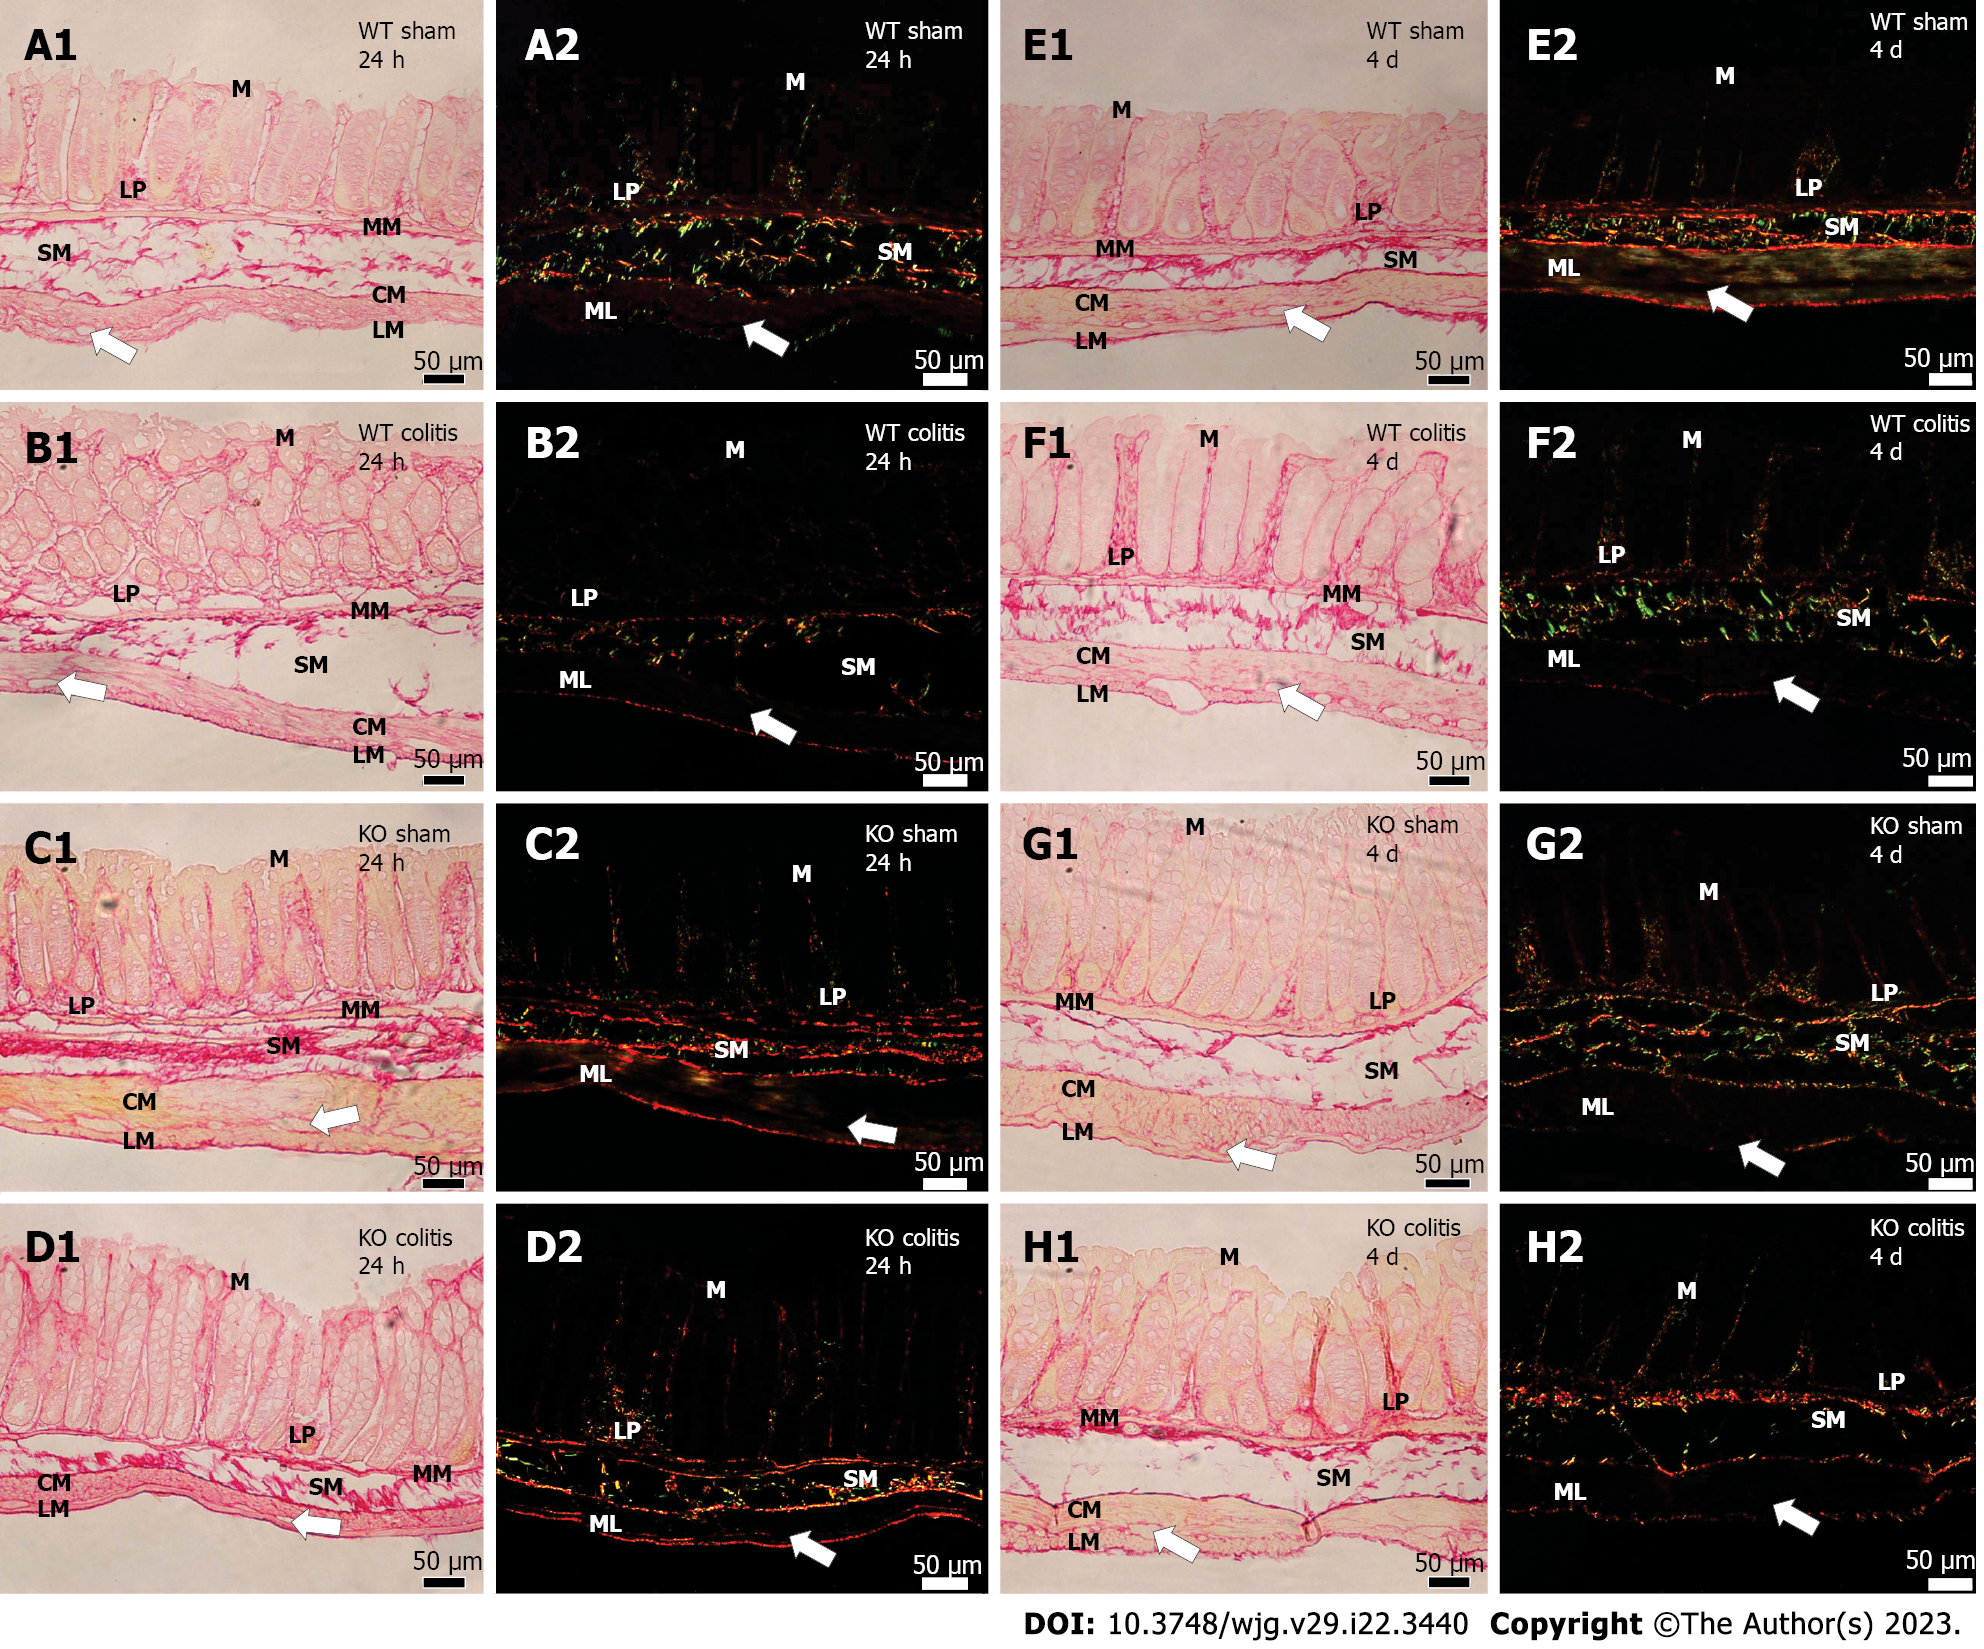
Figure 13 Photomicrograph of picrosirius red-stained transverse sections of the distal colons of mice of different groups.
A1 and A2: Wild-type (WT) sham 24 h; B1 and B2: WT colitis 24 h; C1 and C2: Knockout (KO) sham 24 h; D1 and D2: KO colitis 24 h; E1 and E2: WT sham 4 d; F1 and F2: WT colitis 4 d; G1 and G2: KO sham 4 d; H1 and H2: KO colitis 4 d groups taken under an optical light (red) or polarized light (green) microscope. Thick collagen fibers (red) in the lamina propria and submucosal layer, intermingled with and involving the muscle layer, and circumscribing the myenteric ganglia were observed in the sham groups. In the WT colitis group, there was a decrease in the number of these fibers in the submucosal layer and around the myenteric ganglia, an increase in the number and disorganization of these fibers in the lamina propria and accumulation of these fibers in the subepithelial region. Tissue was better preserved in the KO colitis group. M: Mucosal layer; LP: Lamina propria; MM: Mucosal muscle; SM: Submucosal layer; ML: Muscle layer; CM: Circular musculature; LM: Longitudinal musculature; WT: Wild-type; KO: Knockout. White arrows mean myenteric ganglion.
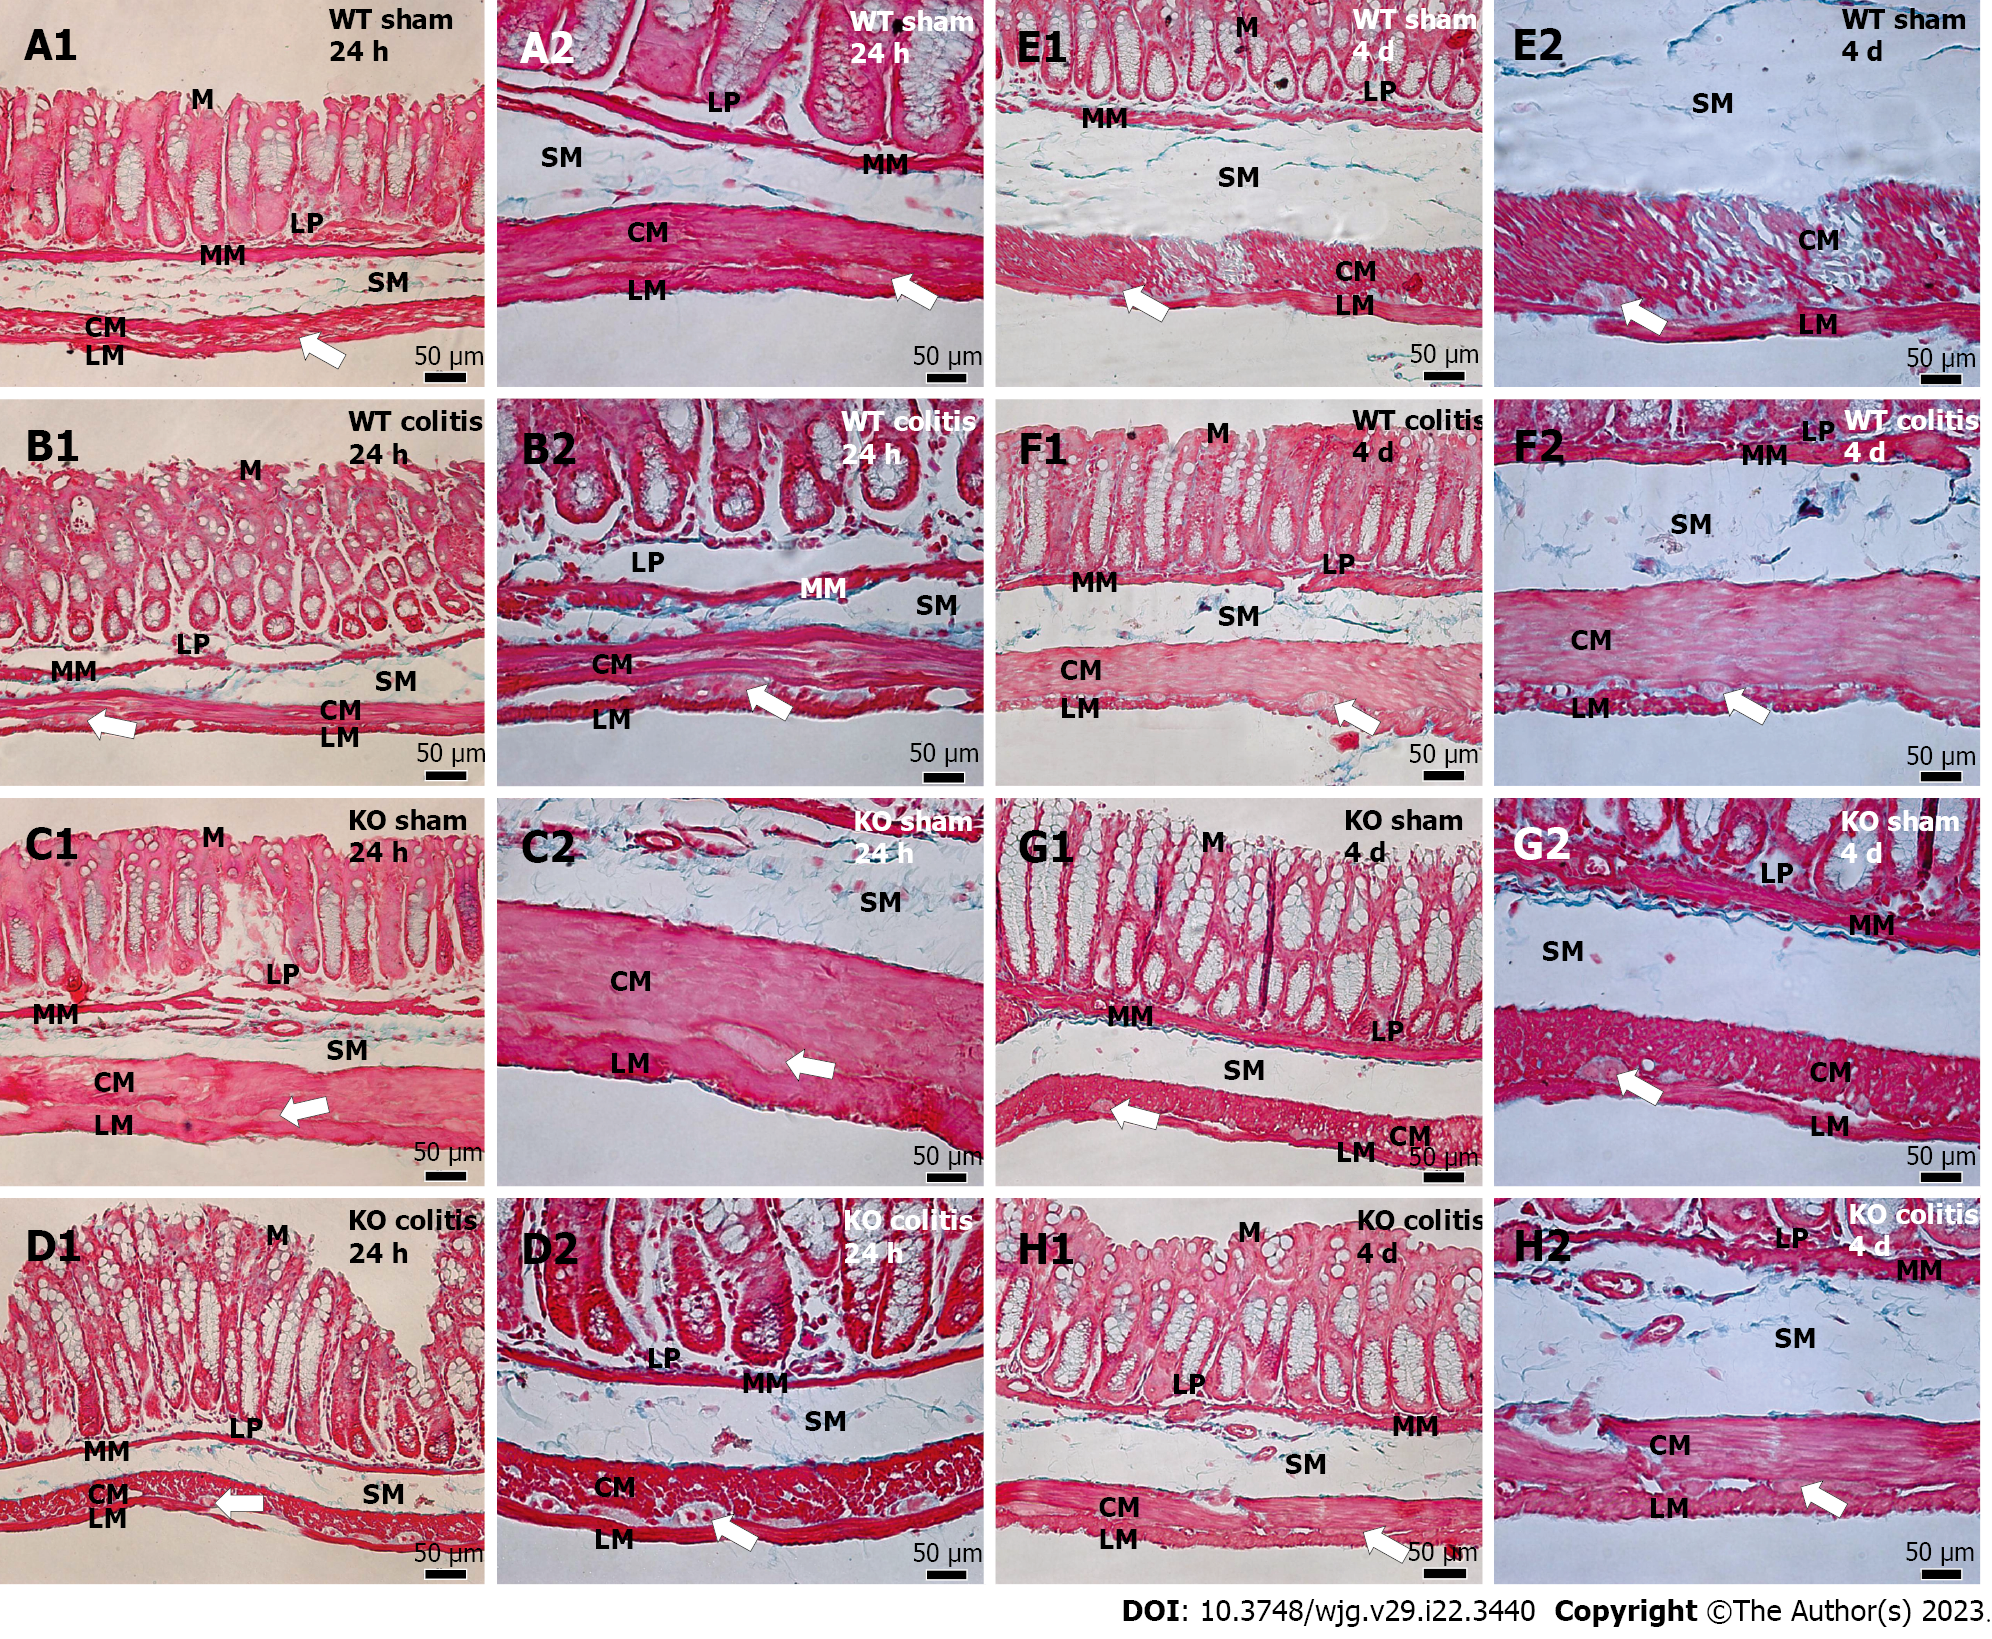
Figure 14 Photomicrographs of Masson’s trichrome-stained transverse sections of the distal colons of mice in different groups.
A1 and A2: Wild-type (WT) sham 24 h; B1 and B2: WT colitis 24 h; C1 and C2: Knockout (KO) sham 24 h; D1 and D2: KO colitis 24 h; E1 and E2: WT sham 4 d; F1 and F2: WT colitis 4 d; G1 and G2: KO sham 4 d; H1 and H2: KO colitis 4 d groups. Collagen fibers (blue) in the lamina propria and submucosal layer, intermingled with and involving the muscle layer, and circumscribing the myenteric ganglia were observed in the sham groups. In the WT colitis group, there was a decrease in the number of these fibers in the submucosal layer, and the collagen fibers in this layer were hyperplastic and disorganized. Moreover, the number of collagen fibers was increased in the lamina propria, and collagen fibers were intermingled in the muscular layer. Tissue was better preserved in the KO colitis group. WT: Wild-type; KO: Knockout; M: Mucosal layer; LP: Lamina propria; MM: Mucosal muscle; SM: Submucosal layer; ML: Muscle layer; CM: Circular musculature; LM: Longitudinal musculature; White arrows: Myenteric ganglion.
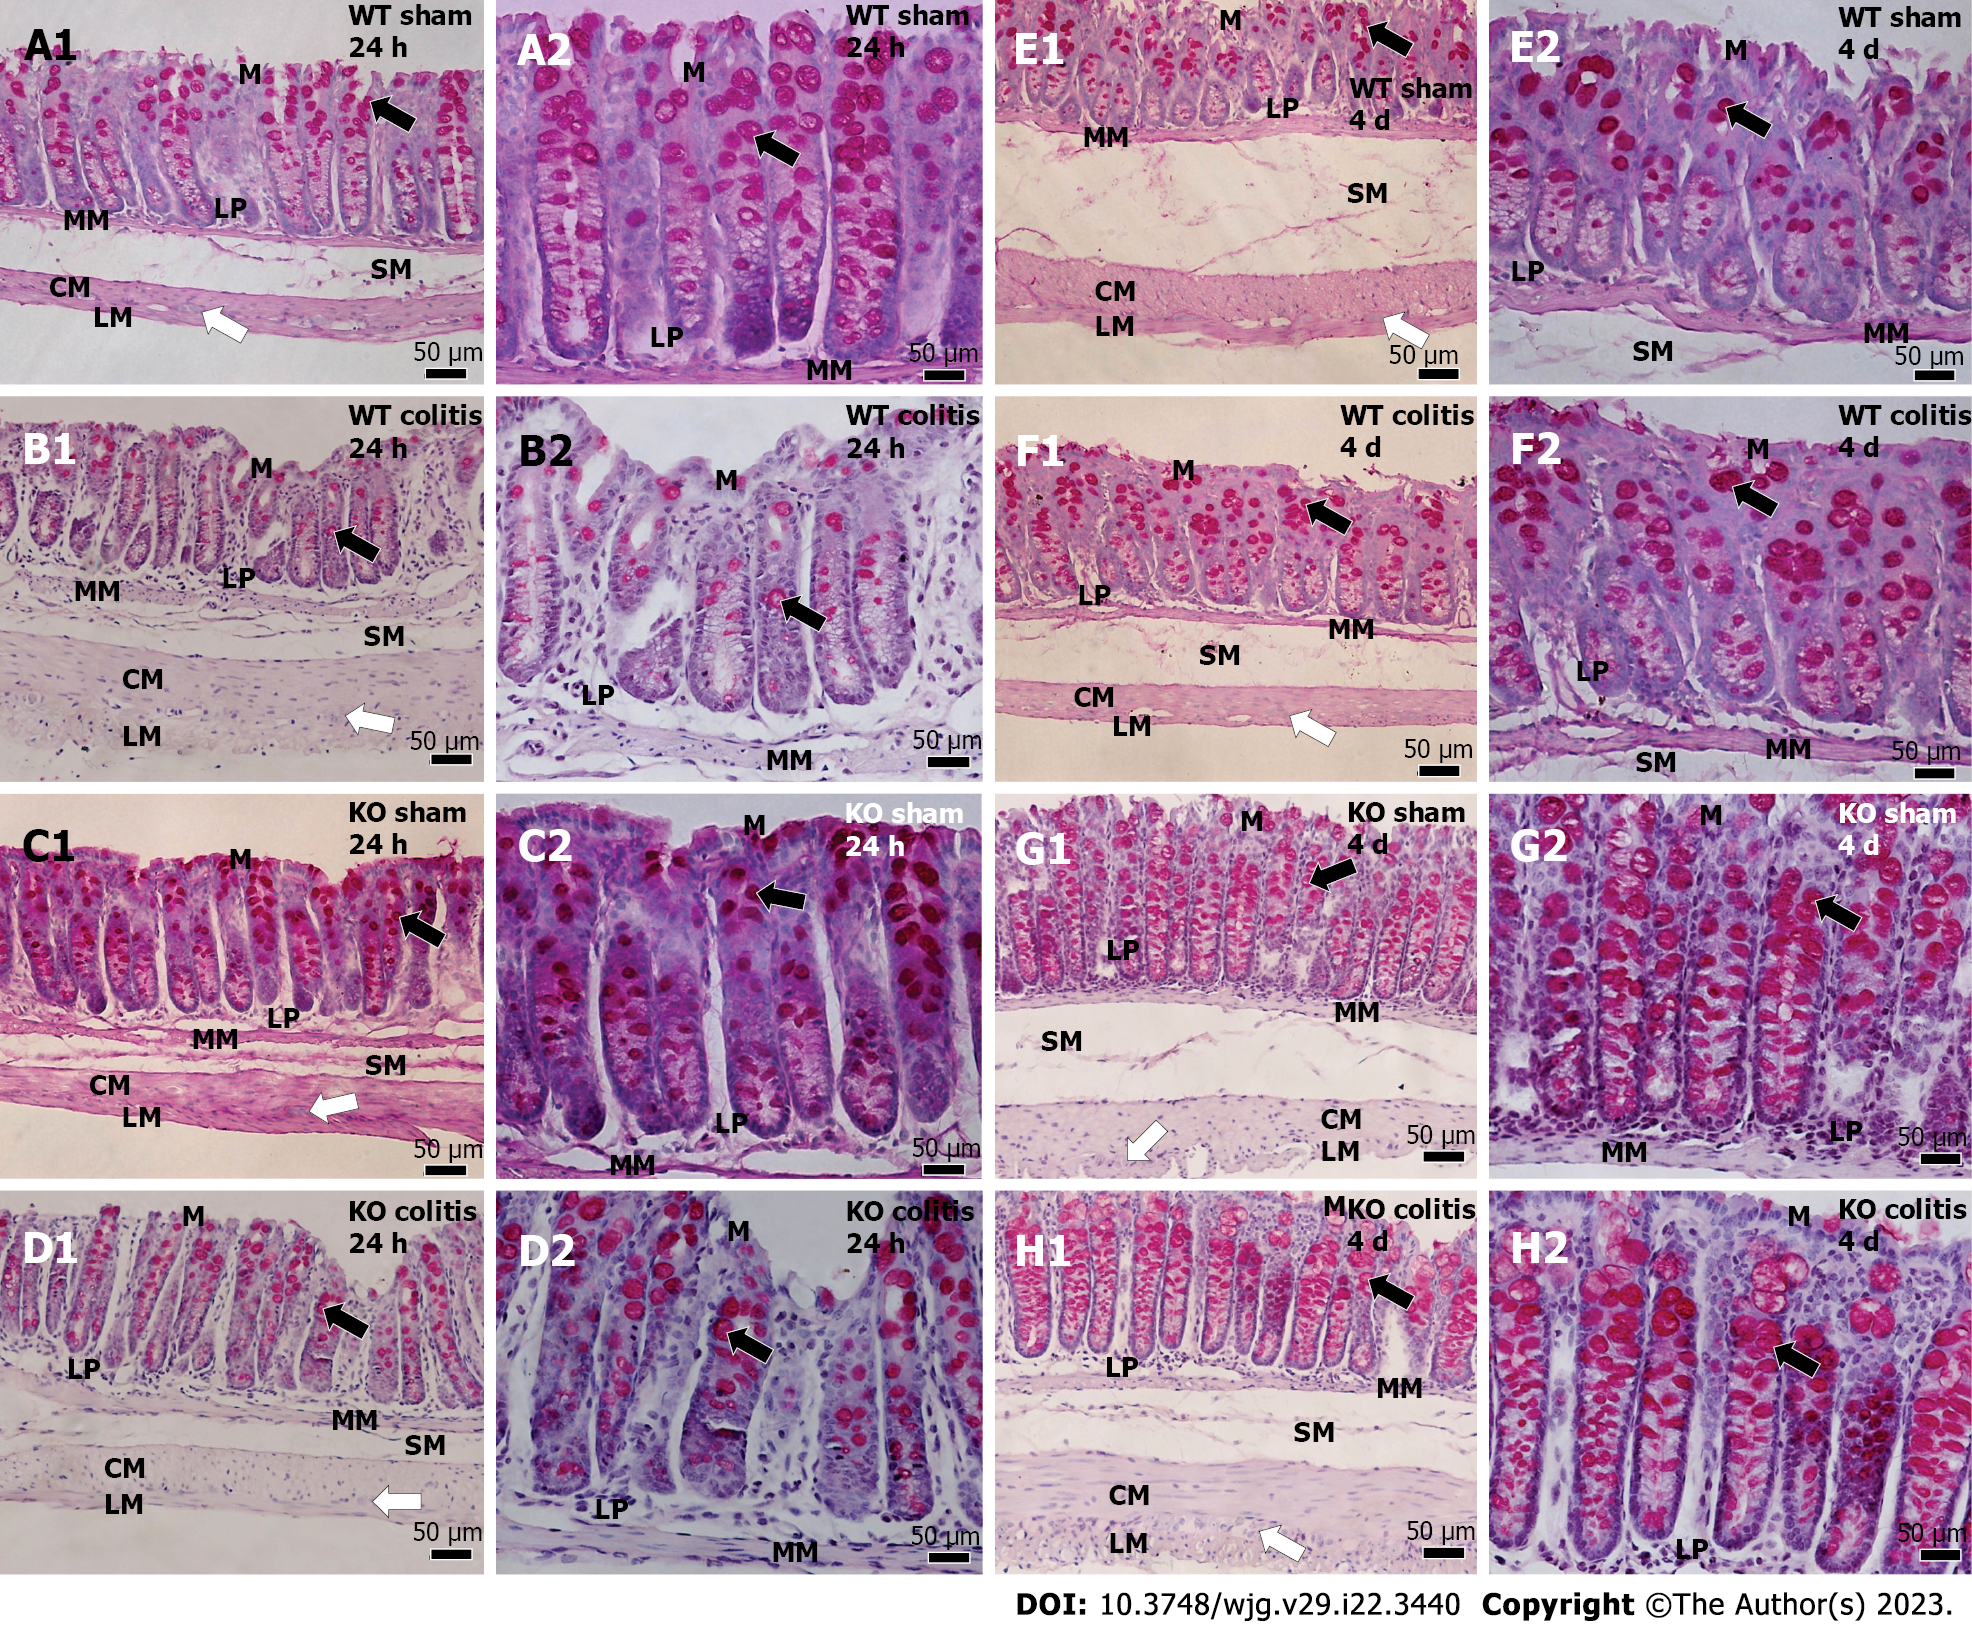
Figure 15 Photomicrograph of periodic acid Schiff-stained transverse sections of the distal colons of mice.
A1 and A2: Wild-type (WT) sham 24 h; B1 and B2: WT colitis 24 h; C1 and C2: Knockout (KO) sham 24 h; D1 and D2: KO colitis 24 h; E1 and E2: WT sham 4 d; F1 and F2: WT colitis 4 d; G1 and G2: KO sham 4 d; H1 and H2: KO colitis 4 d groups. Goblet cells were observed throughout the epithelium in the sham groups, and there was an apparent reduction in goblet cell number and size in the WT colitis group. In addition, goblet cells showed a more rounded shape and an intumescent appearance in the WT colitis group. In the KO groups, an apparent increase in the number of goblet cells was noted. WT: Wild-type; KO: Knockout; M: Mucosal layer; LP: Lamina propria; MM: Mucosal muscle; SM: Submucosal layer; ML: Muscle layer; CM: Circular musculature; LM: Longitudinal musculature; white arrows: Myenteric ganglion; black arrows: Goblet cells.
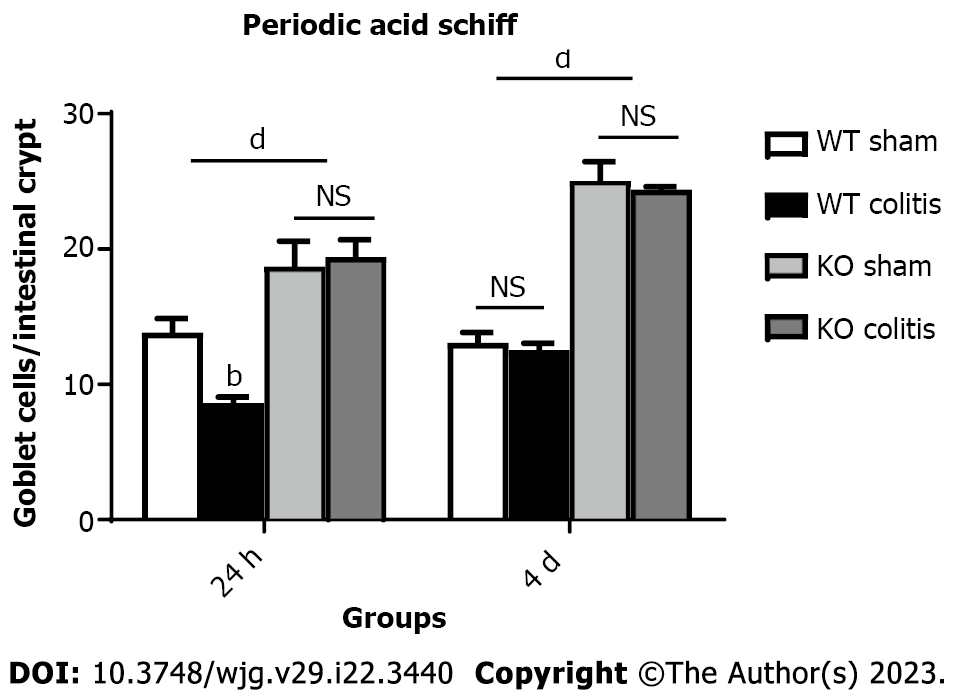
Figure 16 Number of goblet cells per intestinal crypt of the distal colon in mice from the wild-type sham 24 h and 4 d, wild-type colitis 24 h and 4 d, knockout sham 24 h and 4 d, and knockout colitis 24 h and 4 d groups.
The data are presented as the arithmetic mean ± SE. bP < 0.01 vs sham groups; dP < 0.001 vs wild-type groups; NS: Not significant. WT: Wild-type; KO: Knockout.
- Citation: Magalhães HIR, Machado FA, Souza RF, Caetano MAF, Figliuolo VR, Coutinho-Silva R, Castelucci P. Study of the roles of caspase-3 and nuclear factor kappa B in myenteric neurons in a P2X7 receptor knockout mouse model of ulcerative colitis. World J Gastroenterol 2023; 29(22): 3440-3468
- URL: https://www.wjgnet.com/1007-9327/full/v29/i22/3440.htm
- DOI: https://dx.doi.org/10.3748/wjg.v29.i22.3440


