Copyright
©The Author(s) 2023.
World J Gastroenterol. Jun 14, 2023; 29(22): 3422-3439
Published online Jun 14, 2023. doi: 10.3748/wjg.v29.i22.3422
Published online Jun 14, 2023. doi: 10.3748/wjg.v29.i22.3422
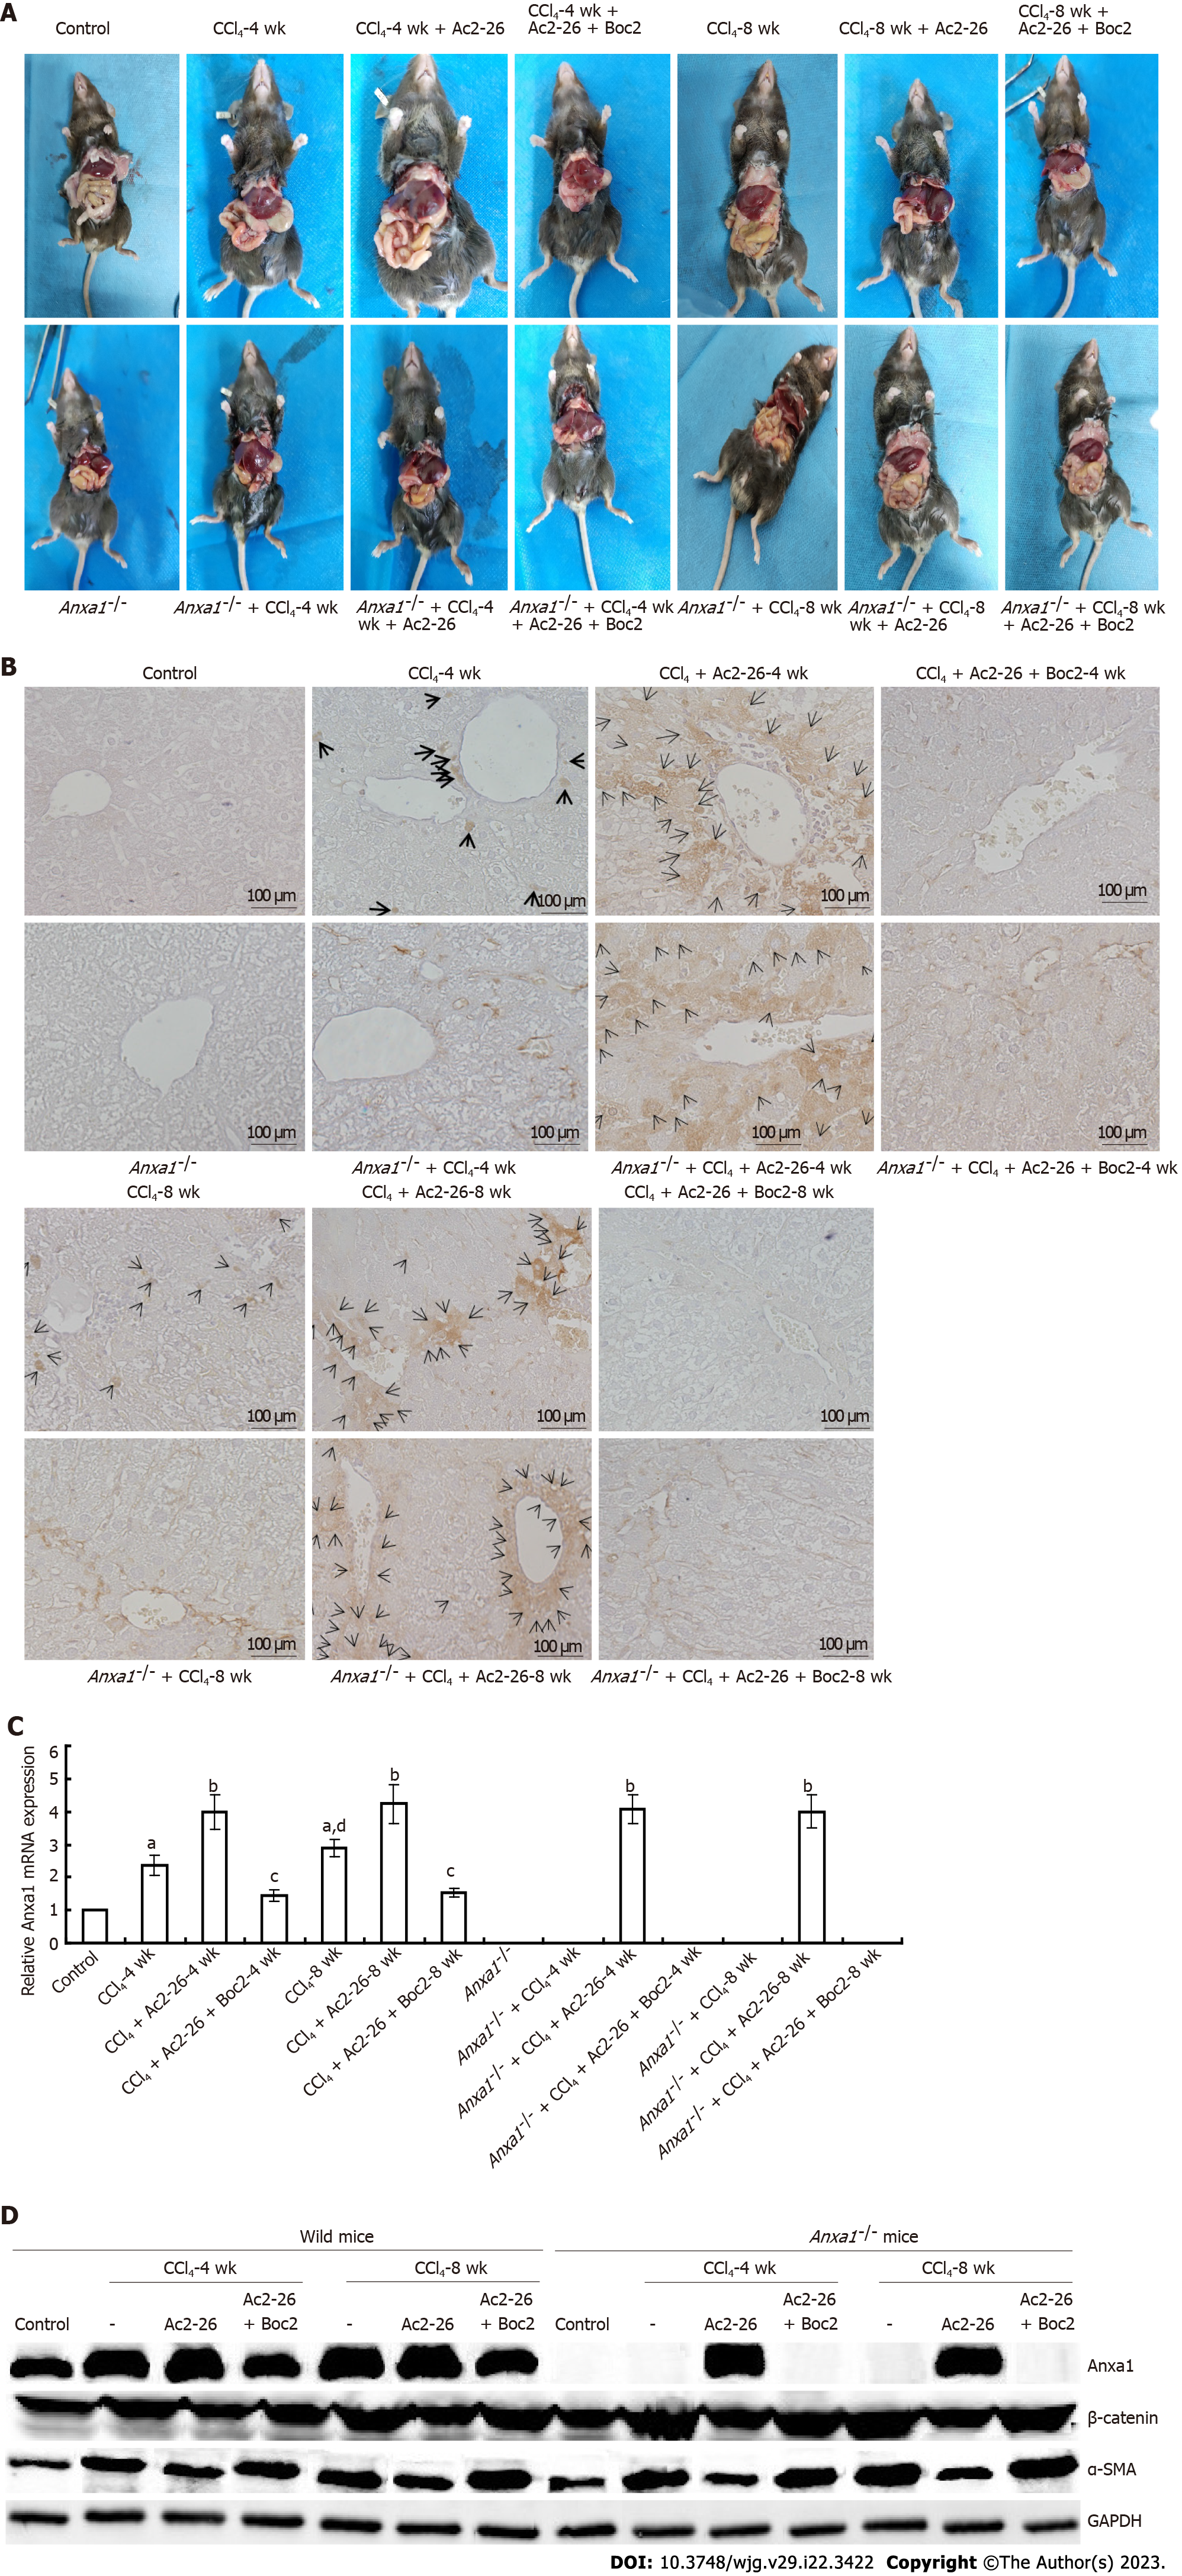
Figure 1 Annexin A1 inhibited CCl4-induced liver injury.
A: Gross view of liver tissue. The liver of mice in the control group was red with bright color and smooth surface. In the CCl4-induced model group, the liver was light in color, rough and grainy on the surface. Liver tissue nodules appeared at 8 wk, and fibrosis appeared at 8 wk in Anxa1-/- mice. After Ac2-26 treatment, the liver was mostly dark red, and the surface roughness was reduced. The effect of Ac2-26 was reversed by Boc2, and the liver color became lighter, the surface was grainy, the edge was blunt, and the texture was hard; B: Annexin (Anx)A1 was expressed in liver tissue. Anxa1 was stained brown. Compared with the control group, the liver tissue in mice treated with CCl4 showed obvious AnxA1 staining. More liver tissue was stained at 8 wk than at 4 wk. The AnxA1-/- model groups were hardly stained. More tissue staining was observed in the CCl4-induced model group after Ac2-26 treatment, while staining was almost absent after Boc2 intervention; C: AnxA1 mRNA expression; D: Protein expression of AnxA1, α-smooth muscle actin, β-catenin, and GAPDH (n = 8). Results are presented as ratios of target mRNA or protein normalized to internal GAPDH. aP < 0.05 vs control; bP < 0.01 vs CCl4; cP < 0.05 vs CCl4 + Ac2-26; dP < 0.05 vs intra-group. Ac2-26: Active N-terminal peptide of annexin A1; AnxA1: Annexin A1; Boc2: N-formyl peptide receptor antagonist N-Boc-Phe-Leu-Phe-Leu-Phe; α-SMA: α-smooth muscle actin.
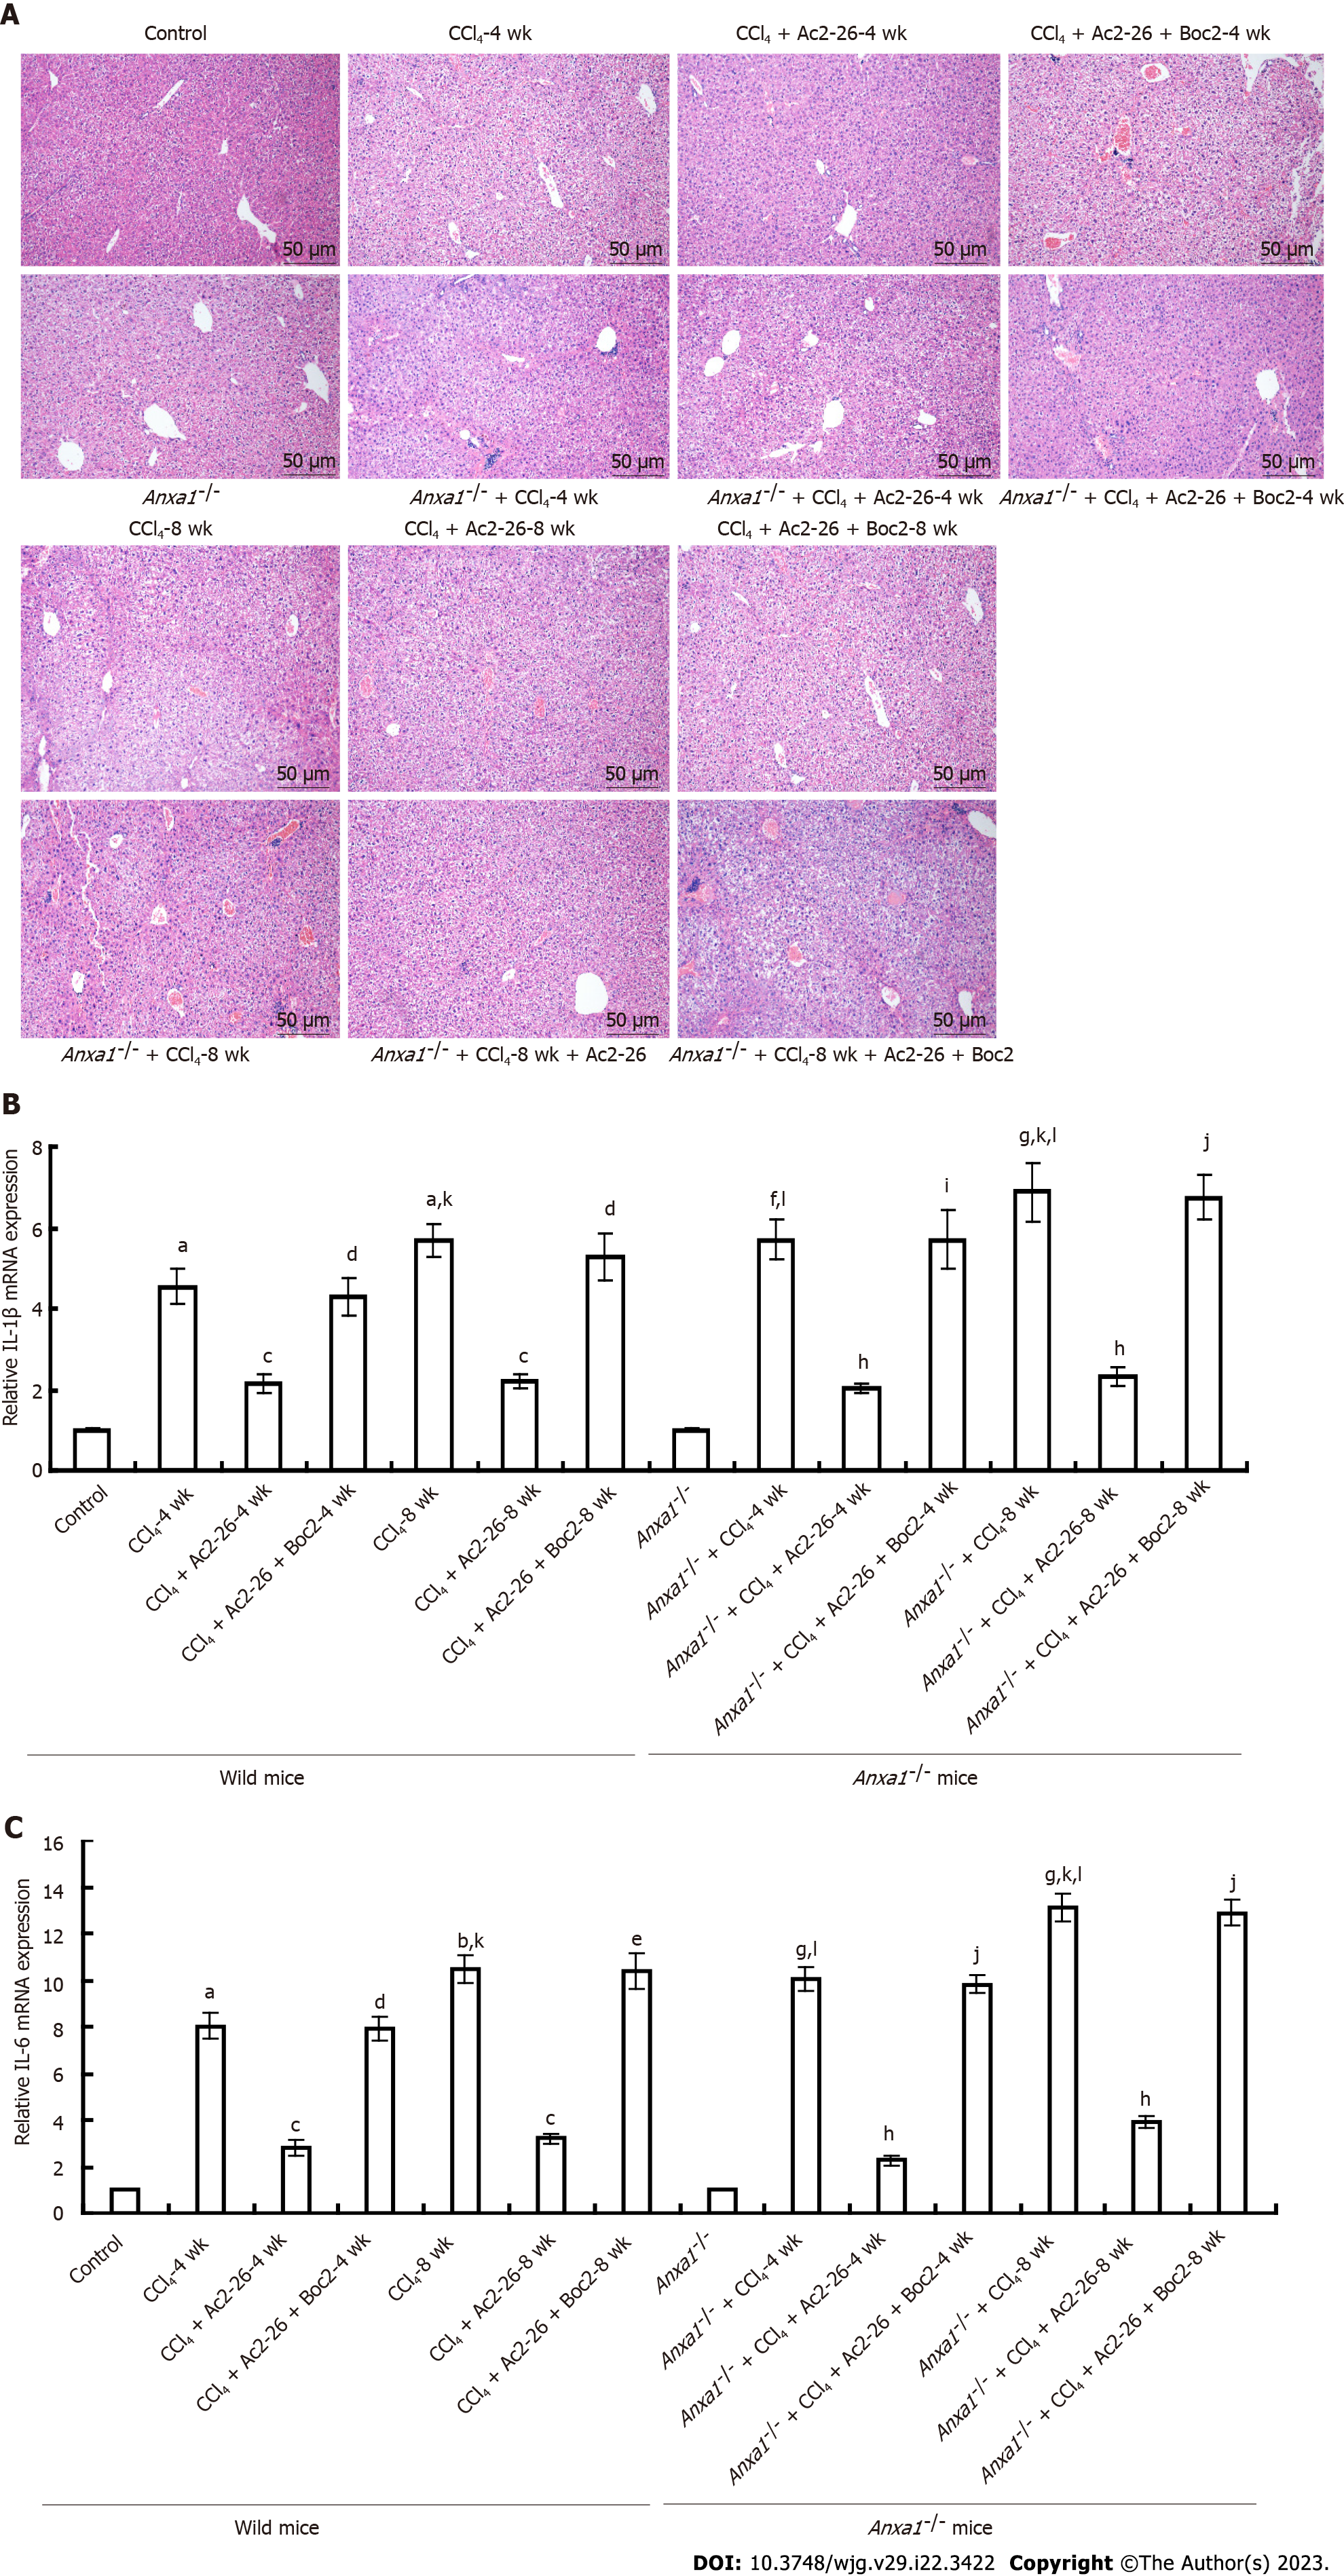
Figure 2 Annexin A1 inhibits CCl4-induced hepatic inflammatory cytokines release.
A: Annexin A1 (AnxA1) inhibited CCl4-induced liver injury and inflammatory cell infiltration in mice. Normal mouse liver lobule structure was clear, with no obvious vacuole formation or inflammatory cell infiltration. In the wild-type model group, hepatic lobules were severely damaged; a large number of hepatic nuclei were shrunken, hepatocytes were vacuolated, and inflammatory cells infiltrated. AnxA1-/- mice had more severe vacuolation and extensive inflammatory cell infiltration than wild-type mice had. After treatment with active N-terminal peptide of AnxA1 (Ac2-26), the damage to hepatic lobules was reduced, hepatocyte vacuolation was reduced but necrosis was observed, clusters of regenerated hepatocytes were observed in some tissues, and inflammatory cell infiltration was also reduced. N-formylpeptide receptor antagonist N-Boc-Phe-Leu-Phe-Leu-Phe almost reversed the therapeutic effect of Ac2-26, but the inflammatory infiltration and damage to hepatic lobule structure were not significantly improved. Initial magnification: 200 ×; B: Effect of Ac2-26 on interleukin (IL)-1β mRNA expression; C: Effect of Ac2-26 on IL-6 mRNA expression; total RNA was extracted using TRIzol reagent and relative concentration of mRNA was quantified using quantitative real-time polymerase chain reaction (n = 8). Results are presented as ratios of target mRNA or protein normalized to internal GAPDH. aP < 0.05 and bP < 0.01 vs control; cP < 0.05 vs CCl4; dP < 0.05 and eP < 0.01 vs CCl4 + Ac2-26; fP < 0.05 and gP < 0.01 vs AnxA1-/- + control; hP < 0.05 vs AnxA1-/- + CCl4; iP < 0.05 and jP < 0.01 vs AnxA1-/- + CCl4 + Ac2-26; kP < 0.05 vs intra-group; lP < 0.05 vs inter-group. Ac2-26: Active N-terminal peptide of AnxA1; AnxA1: Annexin A1; Boc2: N-formyl peptide receptor antagonist N-Boc-Phe-Leu-Phe-Leu-Phe; IL: Interleukin.
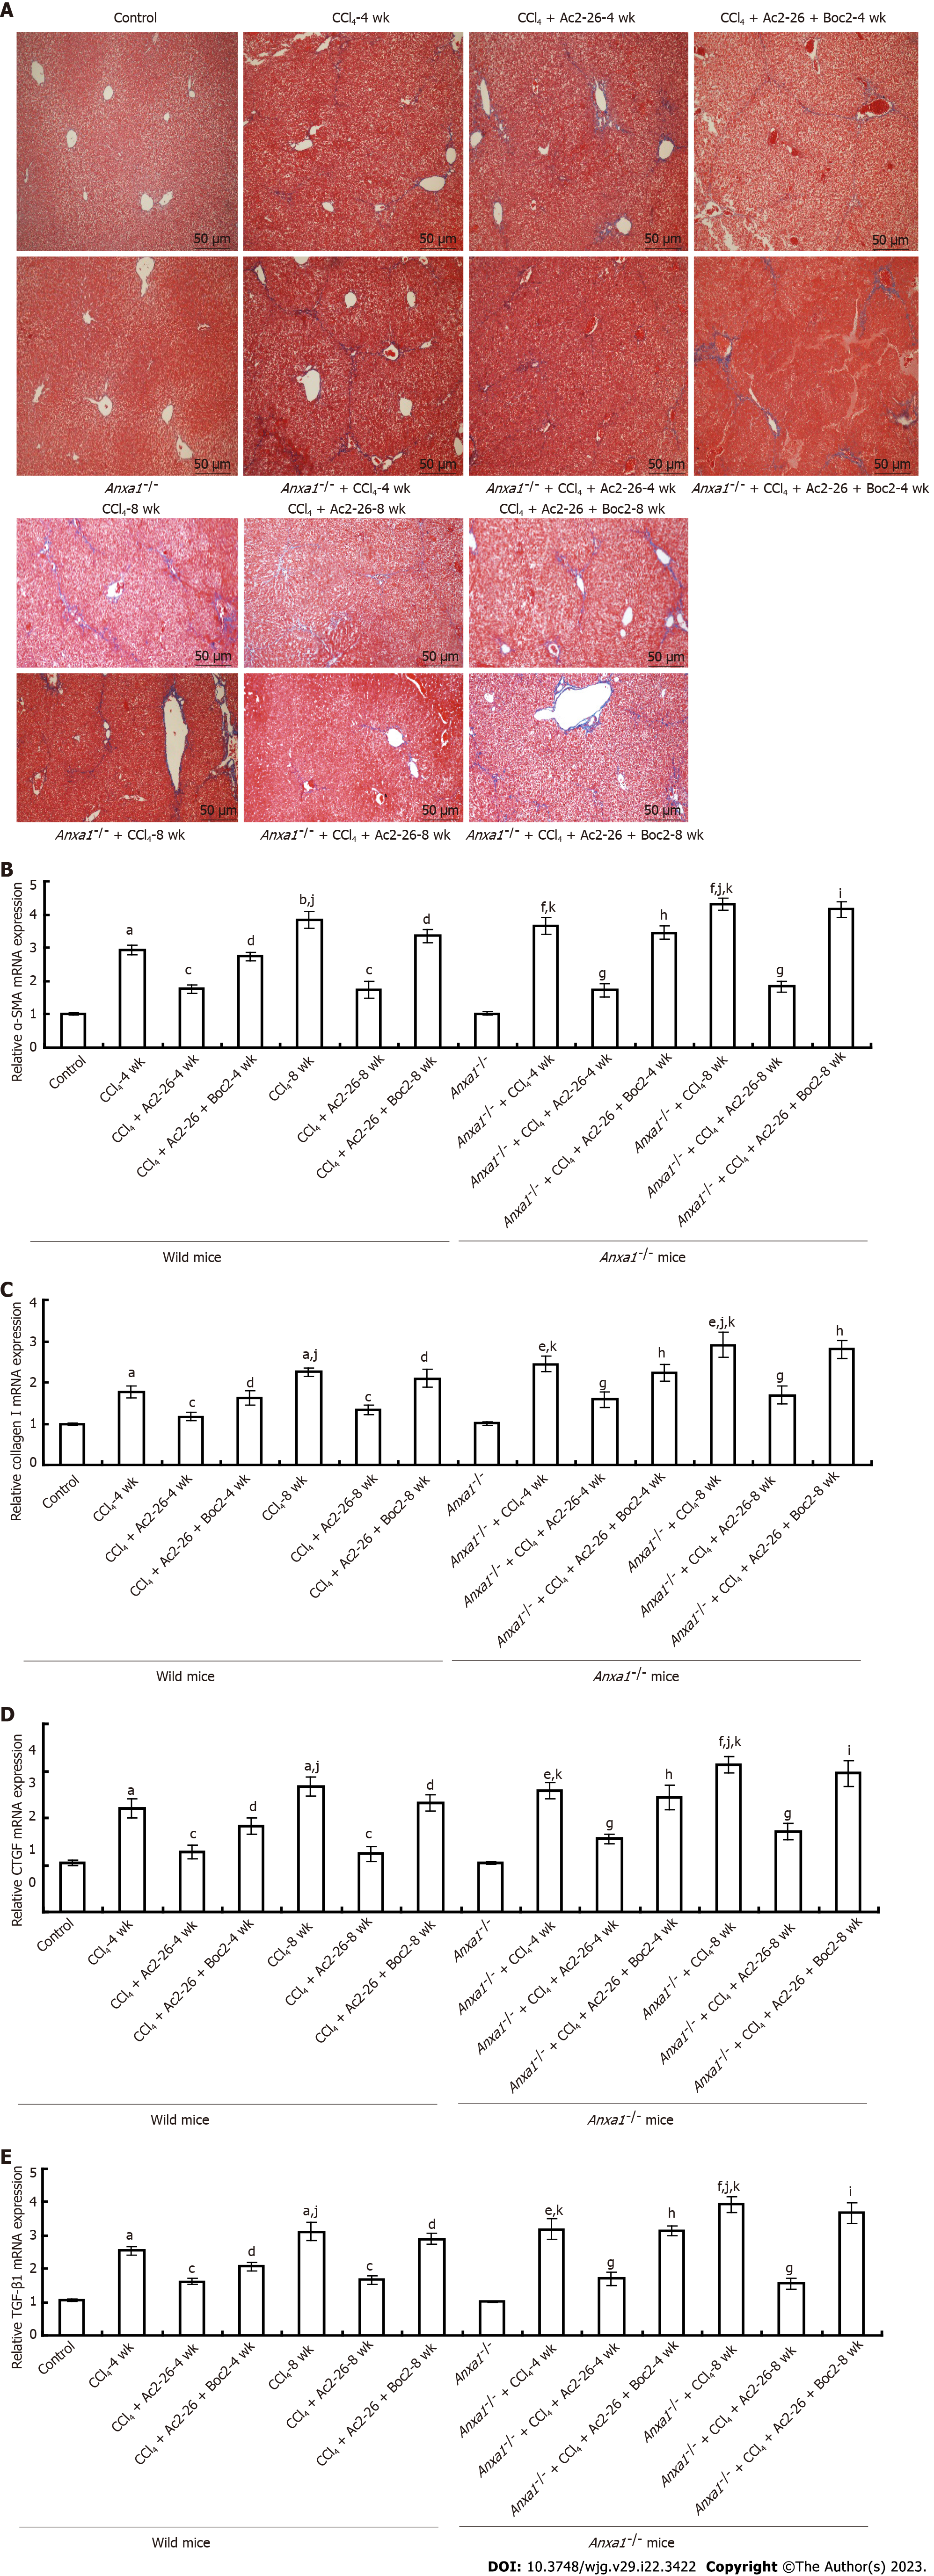
Figure 3 Annexin A1 inhibits CCl4 induced hepatic stellate cell activation in liver tissue.
A: Annexin A1 (AnxA1) inhibited collagen deposition induced by CCl4 in mouse liver tissue. Collagen was stained blue by Masson staining. The collagen content in the liver tissues in the control group was low, while collagen deposition in the liver of the CCl4-induced model group was high. Collagen deposition in the liver of the AnxA1-/- model group was significantly aggravated compared with that in the wild-type model group. Active N-terminal peptide of AnxA1 (Ac2-26) significantly reduced collagen deposition in the CCl4-induced model group, and the collagen deposition in the mice after the intervention of Ac2-26 + N-formylpeptide receptor antagonist N-Boc-Phe-Leu-Phe-Leu-Phe was similar to that in the CCl4-induced model group. Initial magnification: 100 ×; B: Effect of Ac2-26 on α-smooth muscle actin mRNA expression; C: Effect of Ac2-26 on collagen I mRNA expression; D: Effect of Ac2-26 on connective tissue growth factor mRNA expression; E: Effect of Ac2-26 on transforming growth factor-β1 mRNA expression; total RNA was extracted using TRIzol reagent and relative mRNA concentration was quantified using quantitative real-time polymerase chain reaction (n = 8). Results are presented as ratios of target mRNA or protein normalized to internal GAPDH. aP < 0.05 and bP < 0.01 vs control; cP < 0.05 vs CCl4; dP < 0.05 vs CCl4 + Ac2-26; eP < 0.05 and fP < 0.01 vs AnxA1-/- + control; gP < 0.05 vs AnxA1-/- + CCl4; hP < 0.05 and iP < 0.01 vs AnxA1-/- + CCl4 + Ac2-26; jP < 0.05 vs intra-group; kP < 0.05 vs inter-group. Ac2-26: Active N-terminal peptide of AnxA1; AnxA1: Annexin A1; Boc2: N-formyl peptide receptor antagonist N-Boc-Phe-Leu-Phe-Leu-Phe; CTGF: Connective tissue growth factor; TGF-β1: Transforming growth factor β1.
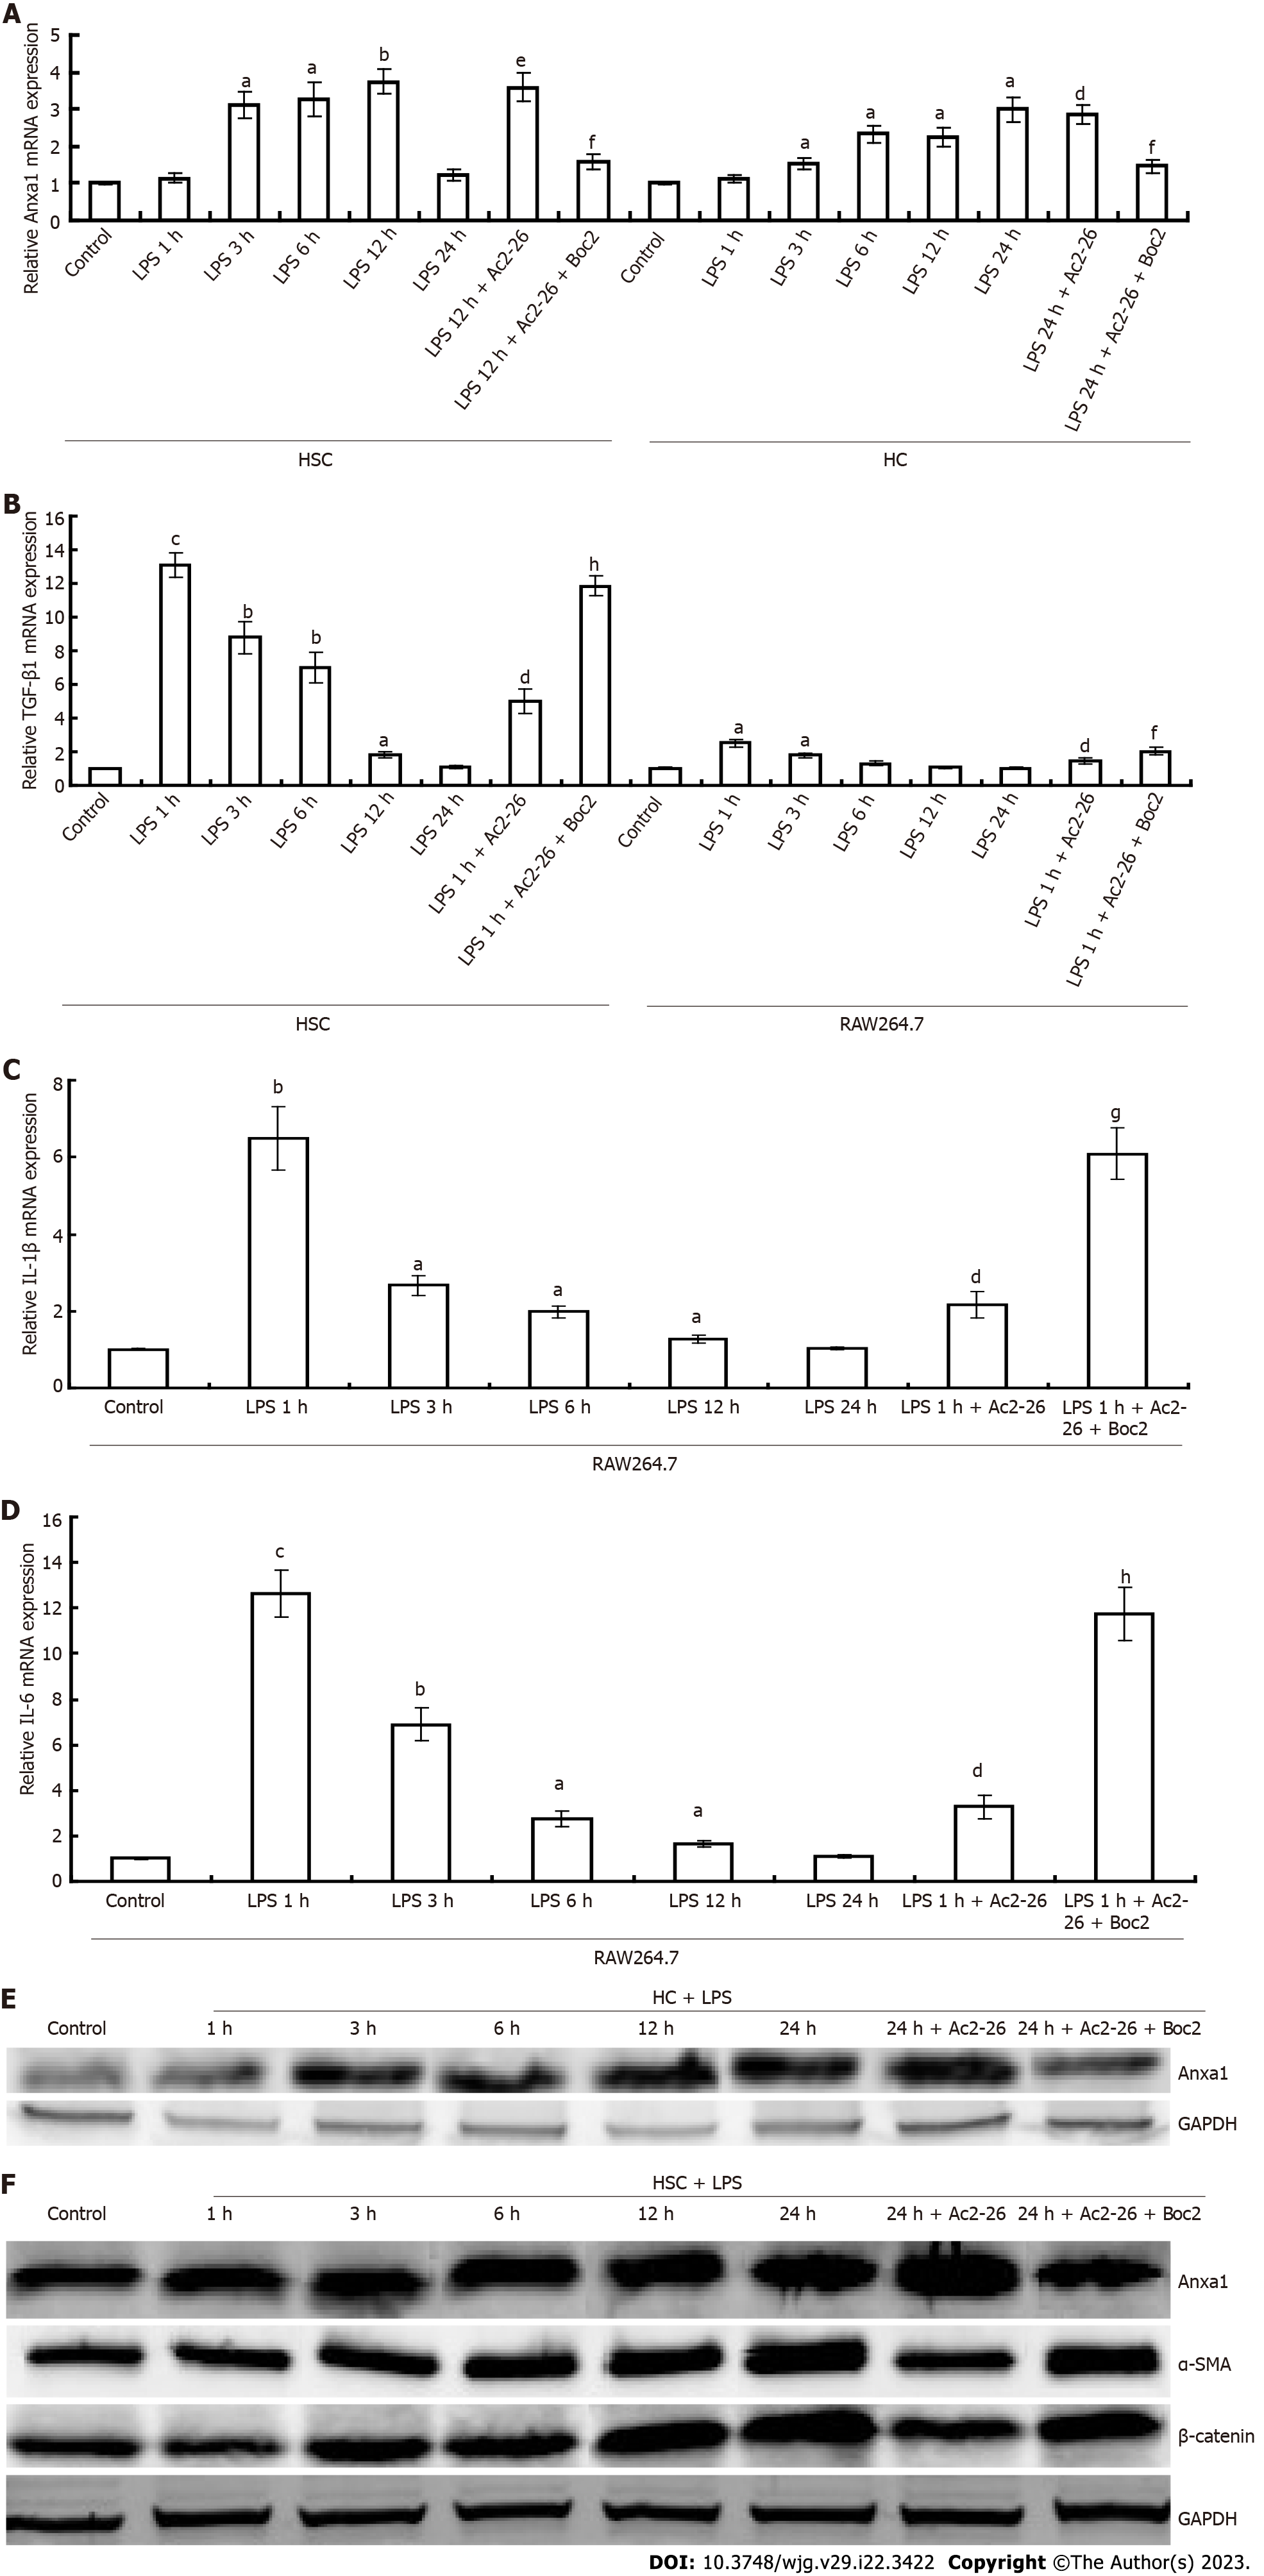
Figure 4 Annexin A1 inhibits activation of RAW264.
7 cells and hepatic stellate cells. A: Changes in annexin A1 (AnxA1) expression in hepatocyte and hepatic stellate cells; B: Transforming growth factor-β1 mRNA expression; C: Interleukin (IL)-1β mRNA was quantified using quantitative real-time polymerase chain reaction; D: Changes in IL-6 mRNA in RAW264.7; E: Immunoblotting assay for the detection of AnxA1 in hepatocytes; F: Immunoblotting assay for AnxA1, α-smooth muscle actin (α-SMA) and β-catenin, lysates were analyzed with AnxA1, α-SMA or β-catenin antibody. GAPDH was used as an internal control. aP < 0.05, bP < 0.01 and cP < 0.001 vs controls; dP < 0.05 and eP < 0.01 vs lipopolysaccharide; fP < 0.05, gP < 0.01 and hP < 0.001 vs lipopolysaccharide + Ac2-26 (n = 8). AnxA1: Annexin A1; α-SMA: α-smooth muscle actin; HSC: Hepatic stellate cell; LPS: Lipopolysaccharide; TGF-β1: Transforming growth factor β1; HCs: Hepatocyte; IL: Interleukin; Ac2-26: Active N-terminal peptide of AnxA1; Boc2: N-formyl peptide receptor antagonist N-Boc-Phe-Leu-Phe-Leu-Phe.
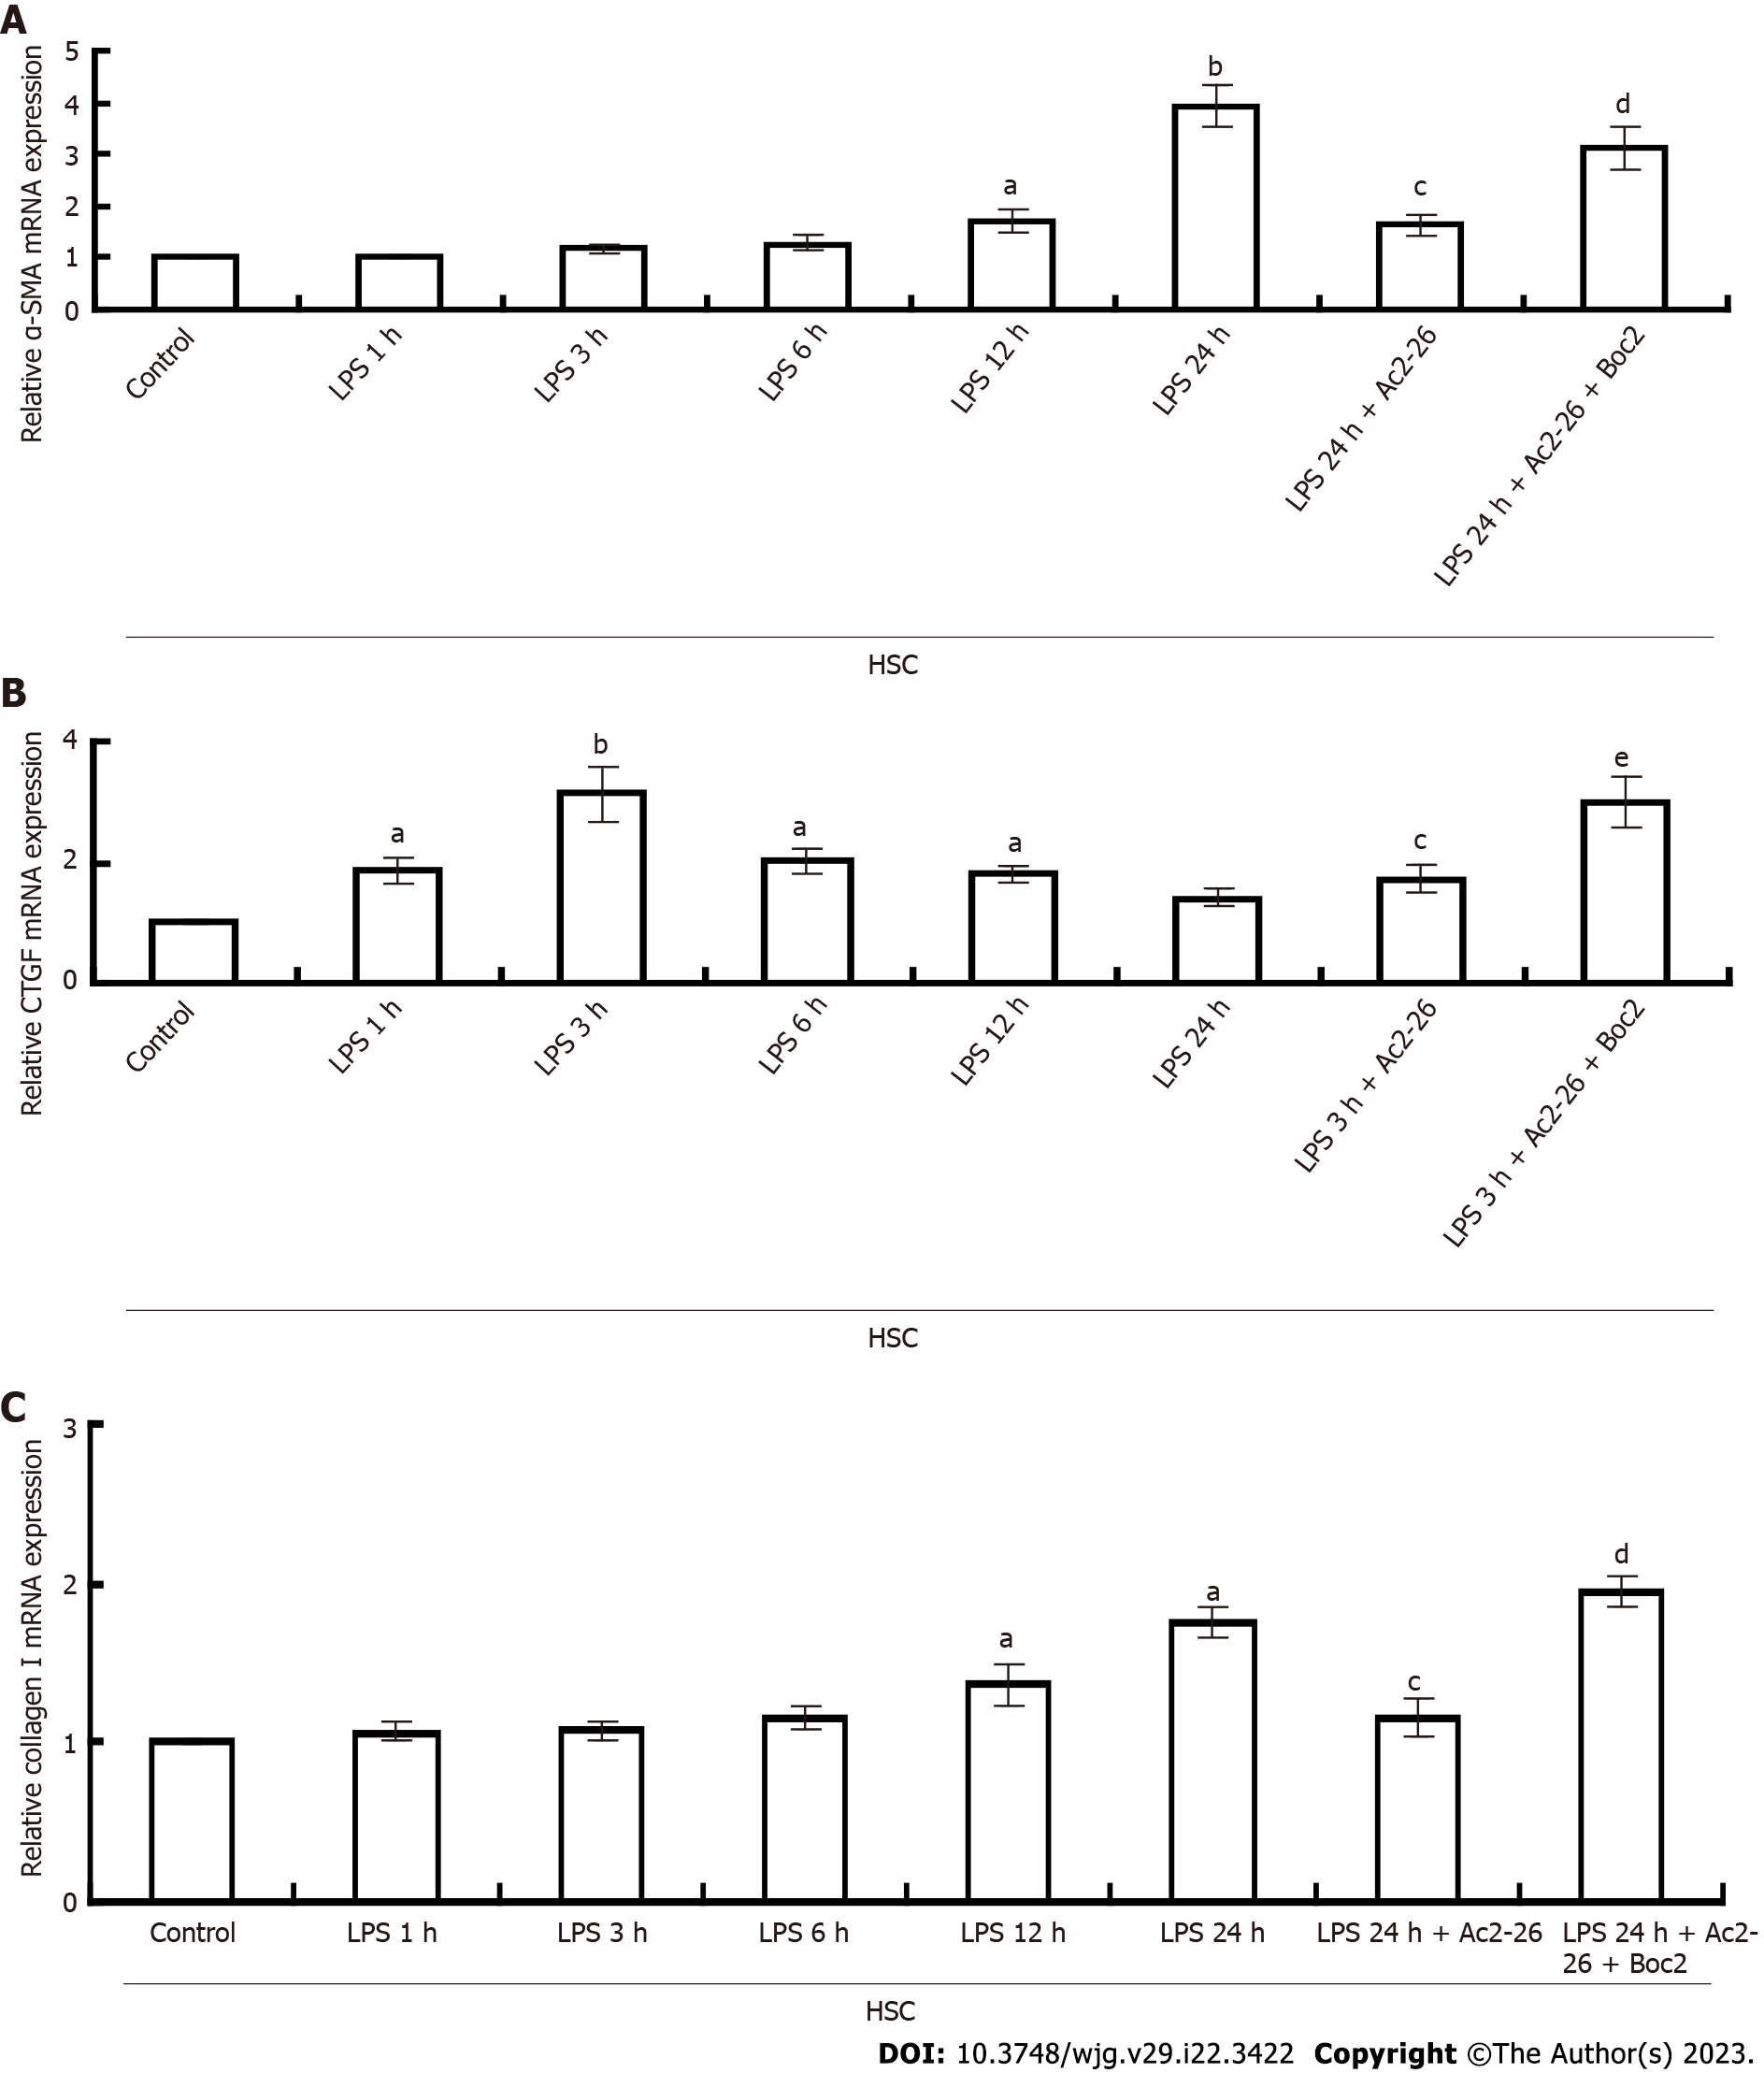
Figure 5 Annexin A1 inhibits hepatic stellate cell activation.
A: Changes in α-smooth muscle actin expression in hepatic stellate cell; B: Connective tissue growth factor mRNA was quantified using quantitative real-time polymerase chain reaction; C: Collagen I mRNA expression. GAPDH was used as an internal control. aP < 0.05 and bP < 0.01 vs controls; cP < 0.05 vs lipopolysaccharide; dP < 0.05 and eP < 0.01 vs lipopolysaccharide + Ac2-26 (n = 8). AnxA1: Annexin A1; α-SMA: α-smooth muscle actin; HSC: Hepatic stellate cell; CTGF: Connective tissue growth factor; LPS: Lipopolysaccharide; Ac2-26: Active N-terminal peptide of AnxA1; Boc2: N-formyl peptide receptor antagonist N-Boc-Phe-Leu-Phe-Leu-Phe.
- Citation: Fan JH, Luo N, Liu GF, Xu XF, Li SQ, Lv XP. Mechanism of annexin A1/N-formylpeptide receptor regulation of macrophage function to inhibit hepatic stellate cell activation through Wnt/β-catenin pathway. World J Gastroenterol 2023; 29(22): 3422-3439
- URL: https://www.wjgnet.com/1007-9327/full/v29/i22/3422.htm
- DOI: https://dx.doi.org/10.3748/wjg.v29.i22.3422


