Copyright
©The Author(s) 2023.
World J Gastroenterol. Jun 7, 2023; 29(21): 3318-3327
Published online Jun 7, 2023. doi: 10.3748/wjg.v29.i21.3318
Published online Jun 7, 2023. doi: 10.3748/wjg.v29.i21.3318
Figure 1 Elastograms of a 60-year-old man with hepatitis B virus.
A: Elastogram with artifacts at the bottom-left of the sampling frame, and the area of artifacts was 1.79 square centimeters; B: For the elastogram with artifacts, the Q-Box was placed in the center of the sampling frame [mean liver stiffness: 9.4 kPa, standard deviation (SD): 1.2 kPa, stability index (SI): 97%]; C: For the elastogram with artifacts, the Q-Box was placed away from the artifacts (mean liver stiffness: 8.6 kPa, SD: 0.4 kPa, SI: 97%). SD: Standard deviation; SI: Stability index.
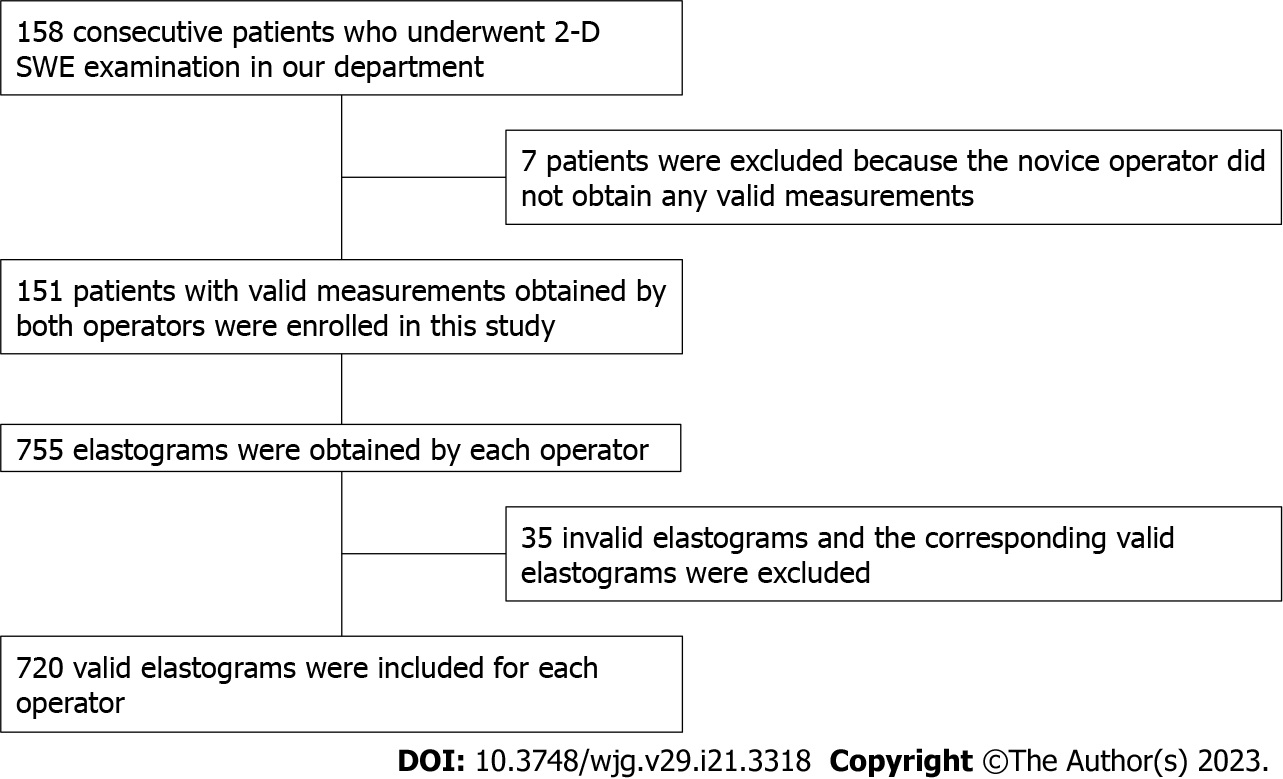
Figure 2 Study flow diagram.
2-D SWE: Two-dimensional shear wave elastography.
- Citation: Wang HP, Zheng PC, Wang XM, Sang L. Artifacts in two-dimensional shear wave elastography of liver. World J Gastroenterol 2023; 29(21): 3318-3327
- URL: https://www.wjgnet.com/1007-9327/full/v29/i21/3318.htm
- DOI: https://dx.doi.org/10.3748/wjg.v29.i21.3318


