Copyright
©The Author(s) 2023.
World J Gastroenterol. May 21, 2023; 29(19): 3040-3047
Published online May 21, 2023. doi: 10.3748/wjg.v29.i19.3040
Published online May 21, 2023. doi: 10.3748/wjg.v29.i19.3040
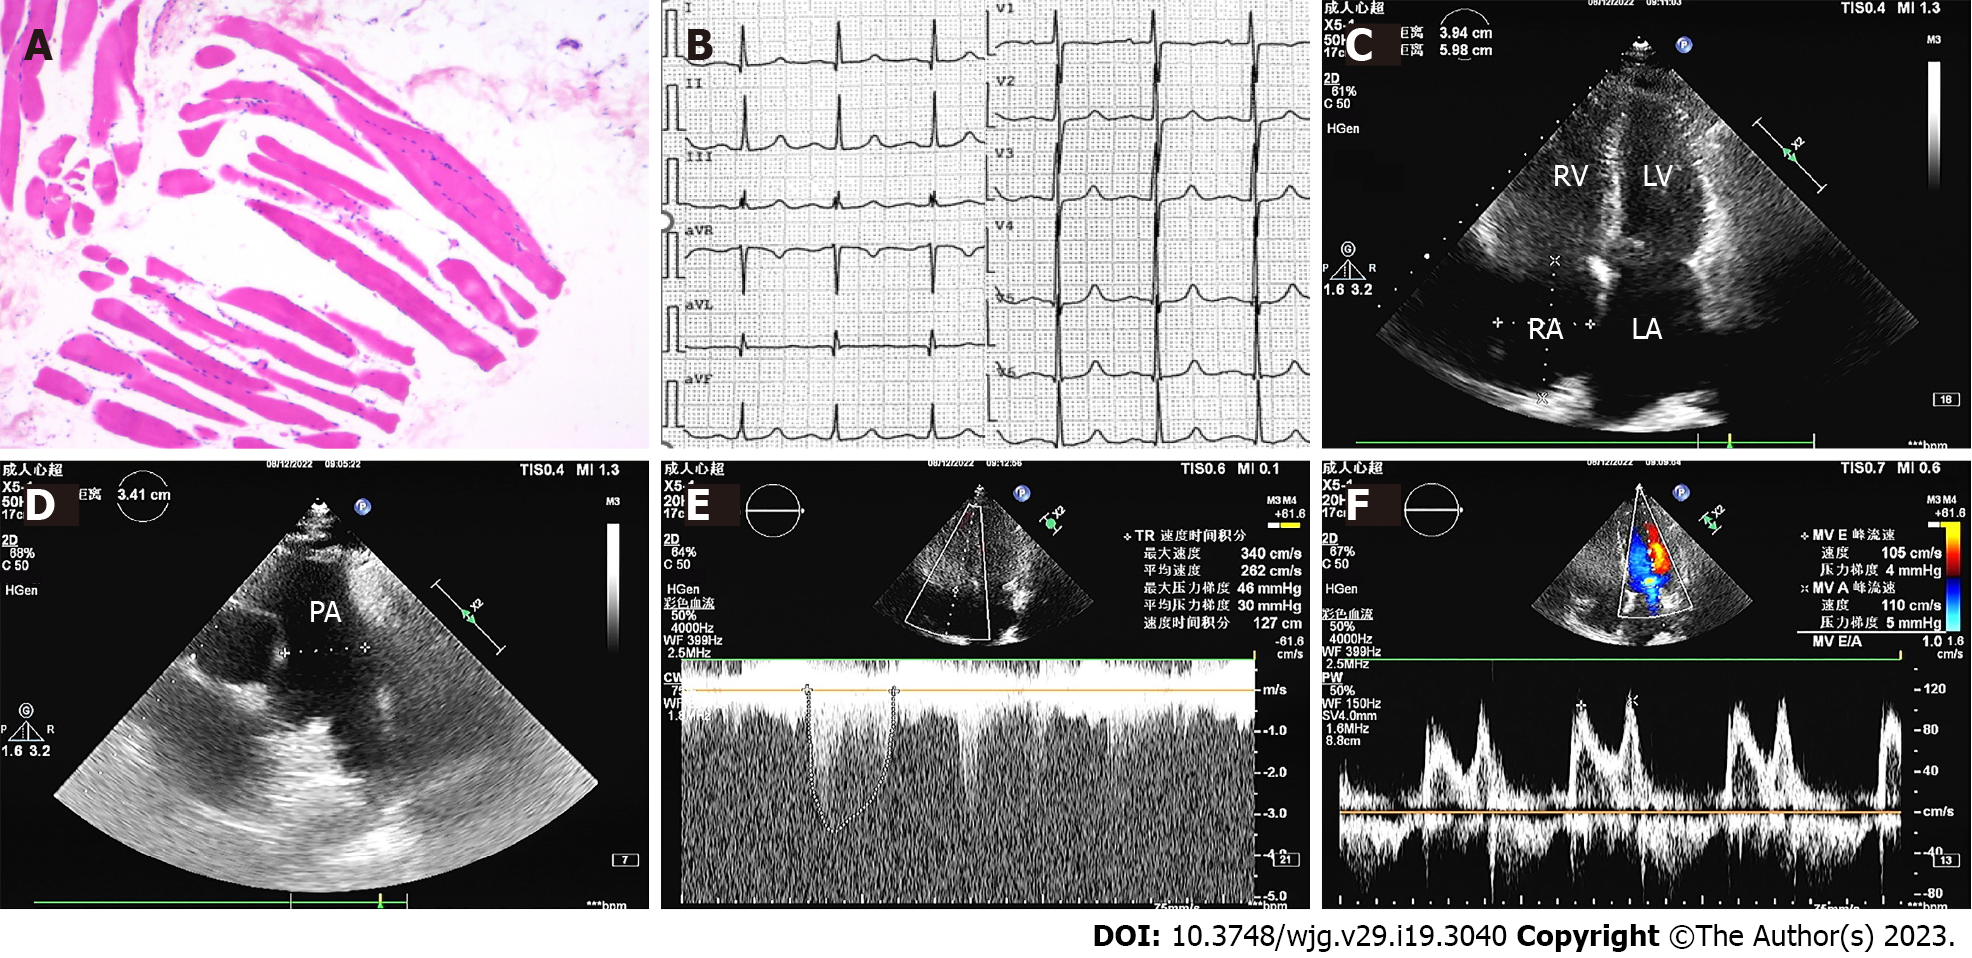
Figure 1 Pathological image of muscle, electrocardiogram, and Echocardiography upon admission.
A: Muscle biopsy with hematoxylin and eosin staining (× 100) showed inflammatory cell infiltration; B: Electrocardiography indicated a normal sinus rhythm; C: A four-chamber view showed an enlarged right atrium, right ventricle, and left atrium; D: A long axis view of the pulmonary artery indicated widening of that artery; E: Doppler echocardiography showed that the peak tricuspid regurgitation velocity was 3.4 m/s, and the tricuspid regurgitation pressure gradient was 46 mmHg; F: Bicuspid valve doppler indicated reduced diastolic function. RV: Right ventricular; LV: Left ventricle; RA: Right atrium; LA: Left atrium; PA: Pulmonary artery.
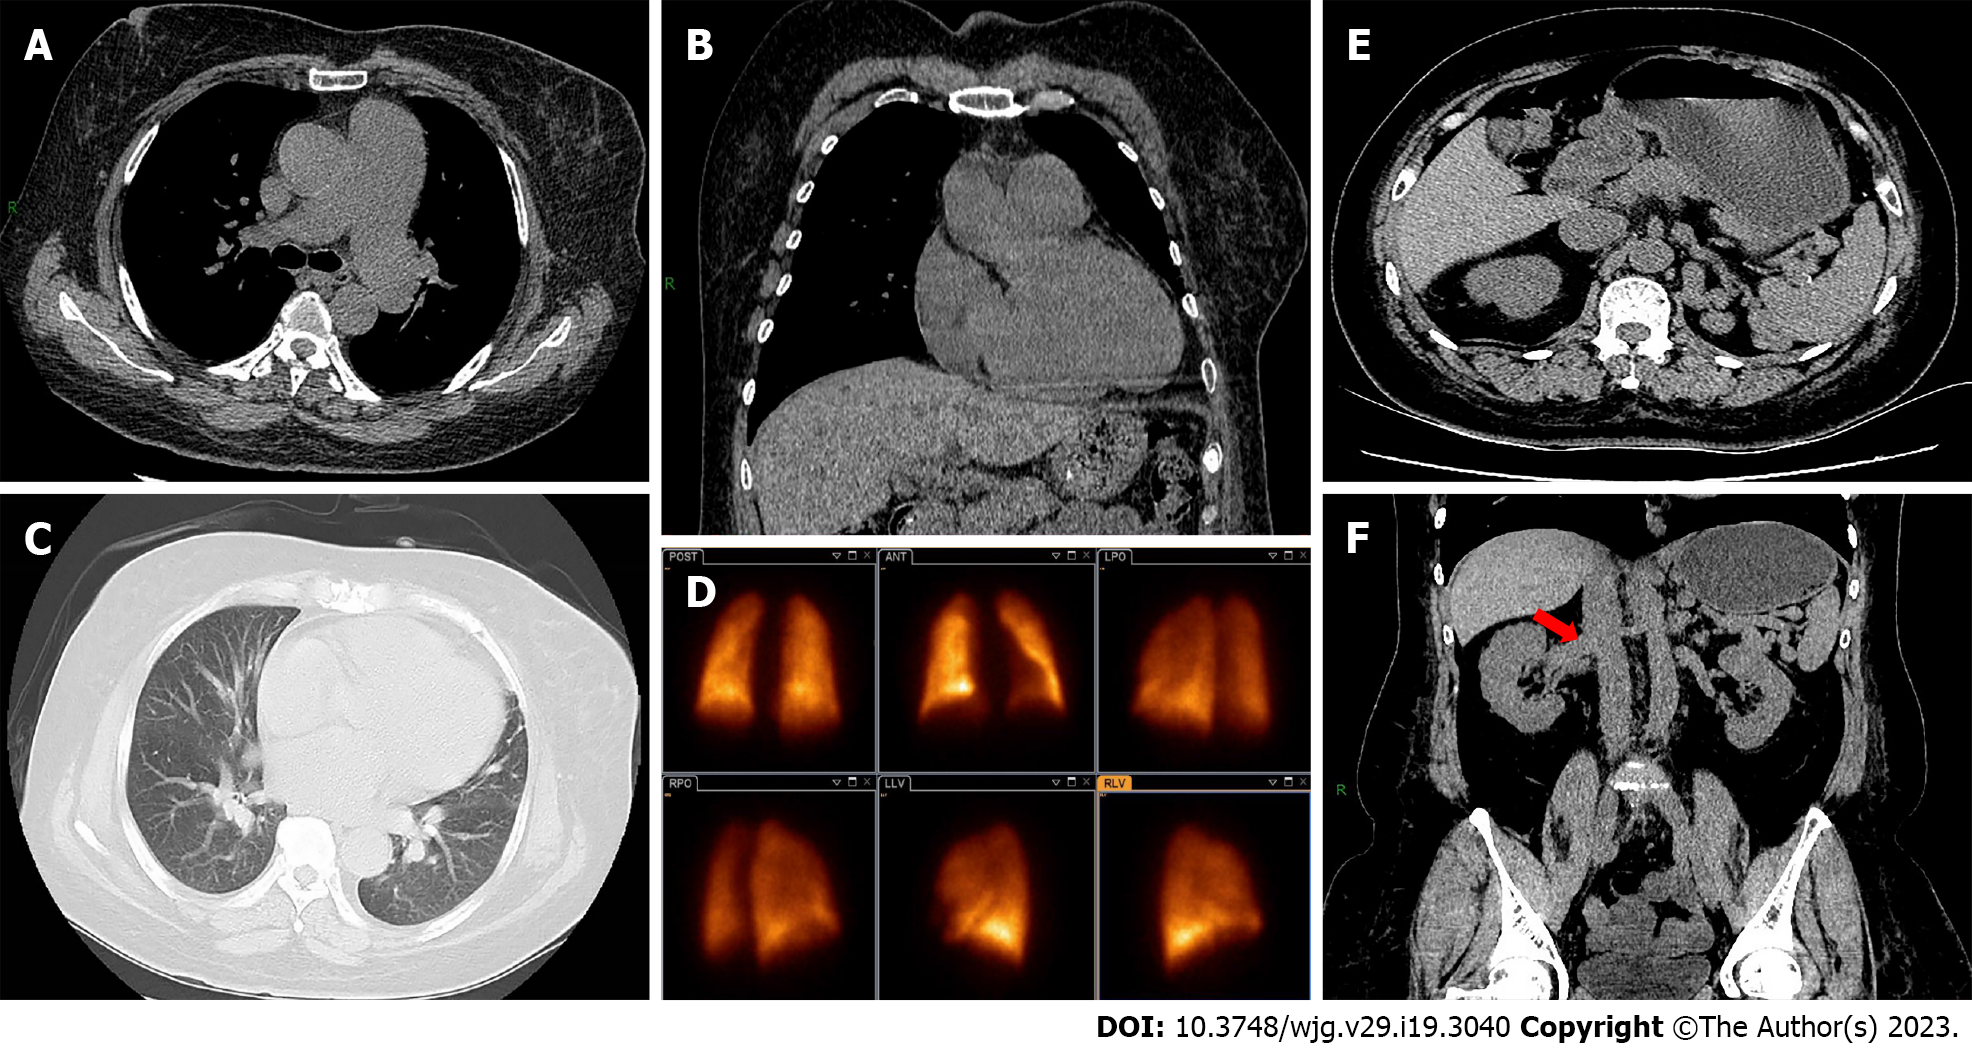
Figure 2 Computed tomography images and pulmonary ventilation/perfusion scan.
A: Axial chest computed tomography (CT) depicted widening of the pulmonary artery; B: Coronal chest CT depicted right atrial and right ventricle enlargement; C: The pulmonary window showed no significant parenchymal pulmonary disease; D: A pulmonary ventilation/perfusion scan indicated normal perfusion function; E: An axial abdominal CT showed normal liver size, slight spleen enlargement, and multiple venous tortuosity; F: A coronal abdominal CT showed thickened venous shunt between the portal vein, splenic vein and left renal vein (red arrow).
- Citation: Zhao YN, Liu GH, Wang C, Zhang YX, Yang P, Yu M. Pulmonary hypertension, nephrotic syndrome, and polymyositis due to hepatitis C virus infection: A case report. World J Gastroenterol 2023; 29(19): 3040-3047
- URL: https://www.wjgnet.com/1007-9327/full/v29/i19/3040.htm
- DOI: https://dx.doi.org/10.3748/wjg.v29.i19.3040


