Copyright
©The Author(s) 2023.
World J Gastroenterol. May 21, 2023; 29(19): 2979-2991
Published online May 21, 2023. doi: 10.3748/wjg.v29.i19.2979
Published online May 21, 2023. doi: 10.3748/wjg.v29.i19.2979
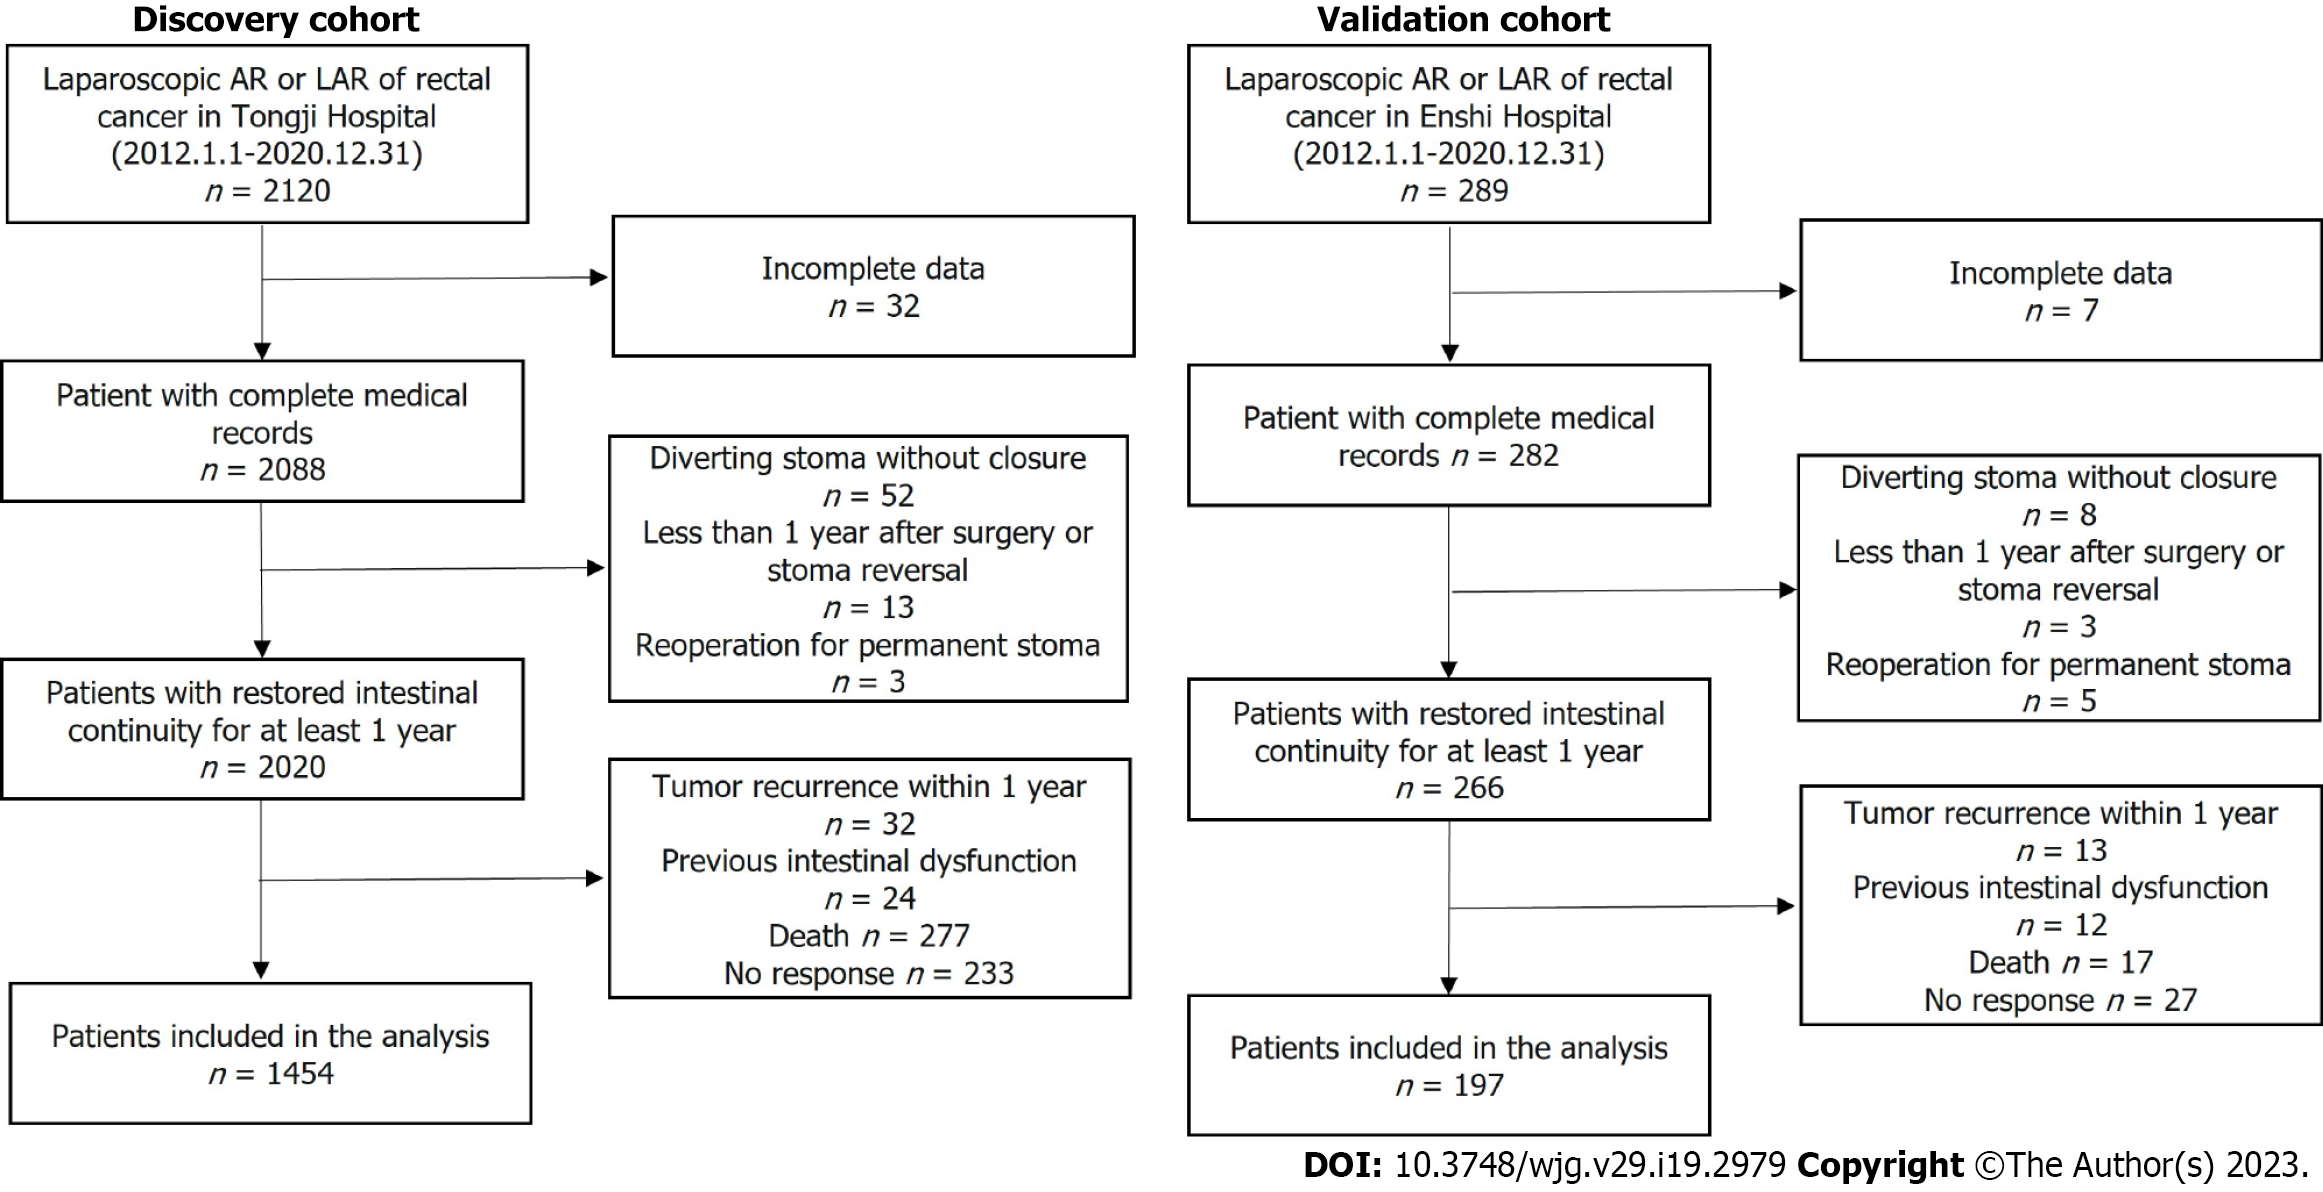
Figure 1 Flow chart of the patients from two independent medical centers who were enrolled in the present study.
AR: Anterior resection; LAR: Low anterior resection.
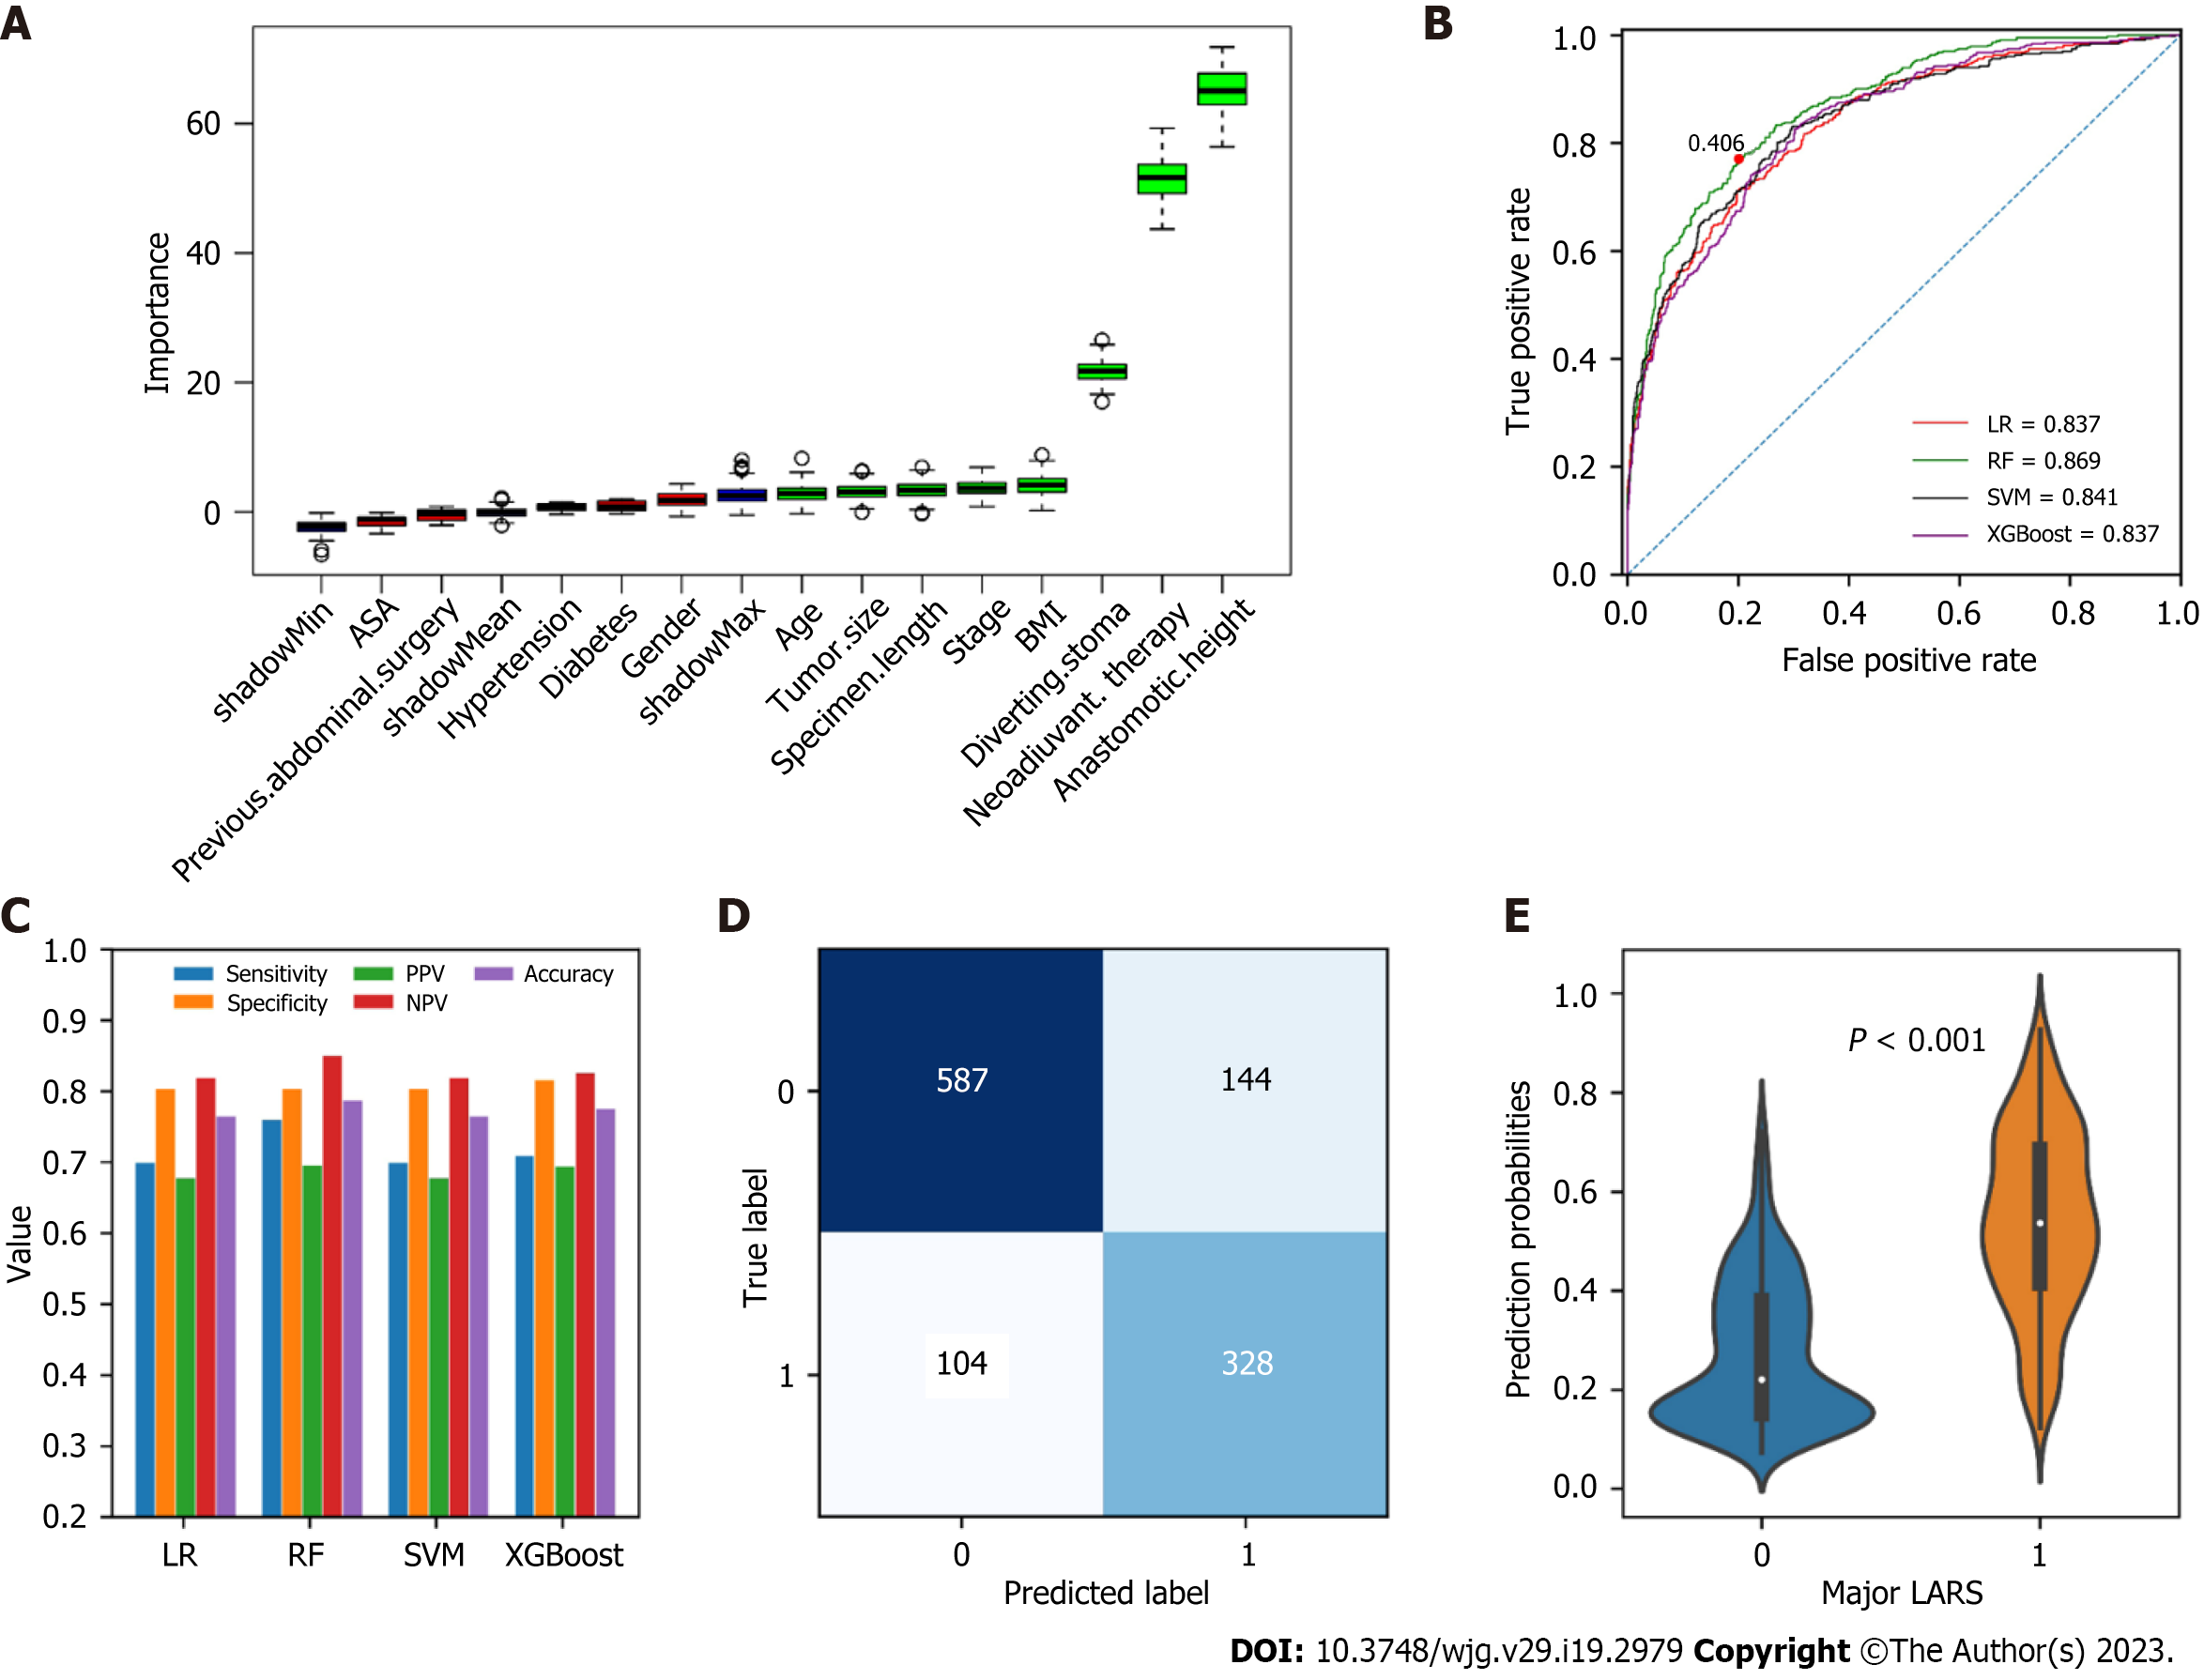
Figure 2 Variable selection using the Boruta algorithm and overview of development of the models in the training set.
A: The importance of all variables. The red boxes indicated the variables weakly relevant to major low anterior resection syndrome (LARS). The blue boxes were random variables automatically generated by the algorithm and were not included in the analysis. The green boxes indicated the variables strongly relevant to major LARS; B: Receiver operating characteristic curves of the four machine learning models in the training set. The red dot denotes the optimal Youden index for the random forest (RF) model; C: Performance measurements of the four machine learning models illustrated by sensitivity, specificity, positive predictive value, negative predictive value and accuracy; D: Confusion matrix of the optimization RF model; E: Comparison of predicted probabilities calculated by the RF model in patients with and without major LARS in the training set. ASA: American Society of Anesthesiologists classification; BMI: Body mass index; LR: Logistic regression; LARS: Low anterior resection syndrome; RF: Random forest; SVM: Support vector machine; XGBoost: Extreme gradient boosting; PPV: Positive predictive value; NPV: Negative predictive value.
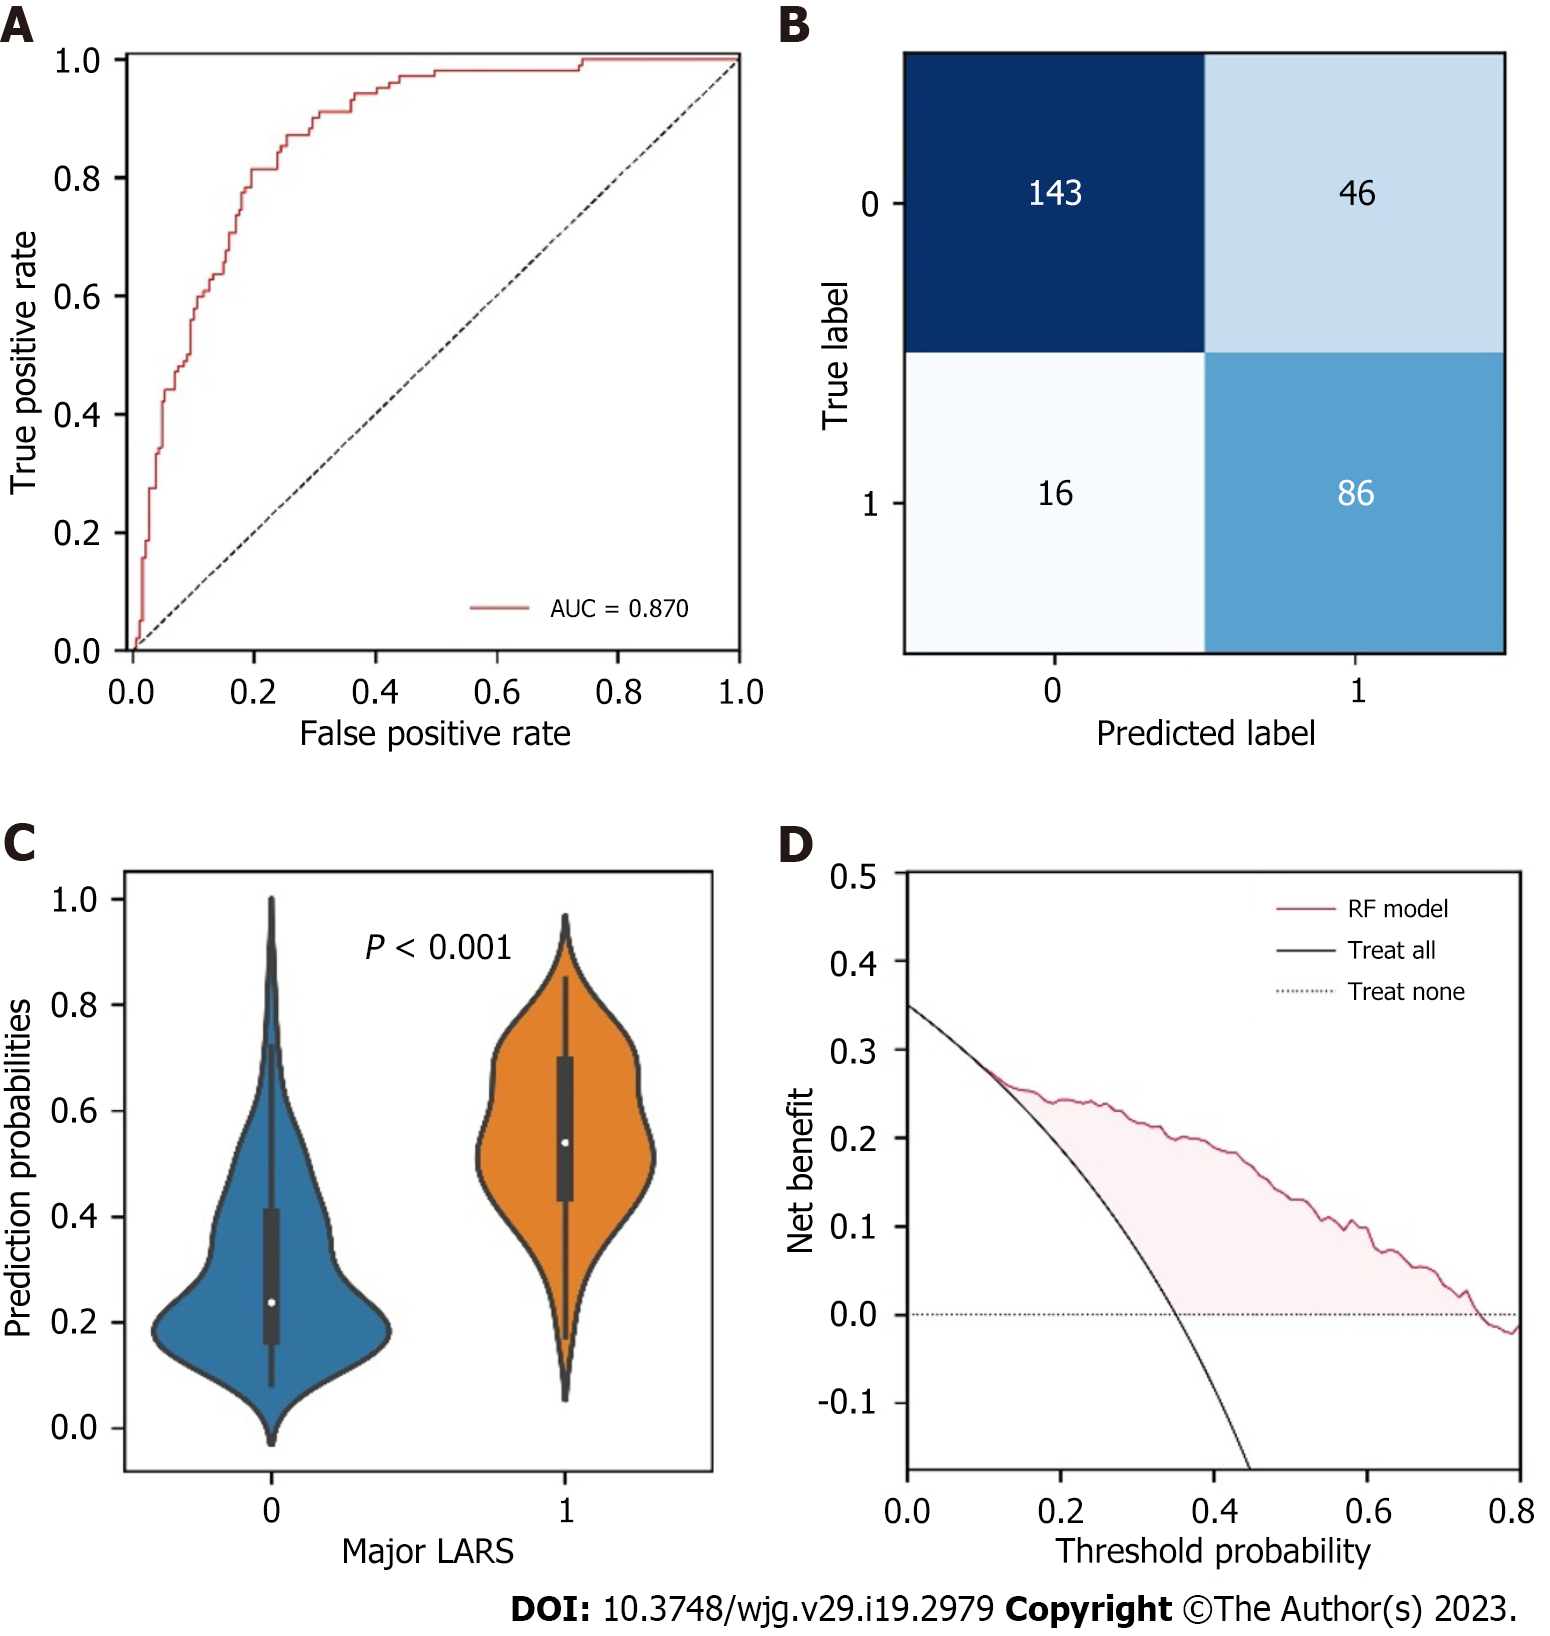
Figure 3 Performance of the random forest model in the testing set.
A: Receiver operating characteristic curve of the random forest (RF) model in the testing set; B: Confusion matrices showed the predicted outcomes generated by the RF model in the testing set; C: Comparison of predicted probabilities between patients with and without major low anterior resection syndrome in the testing set; D: Decision curve analysis for the RF model in the testing set. AUC: Area under the curve; LARS: Low anterior resection syndrome; RF: Random forest; ROC: Receiver operating characteristic.
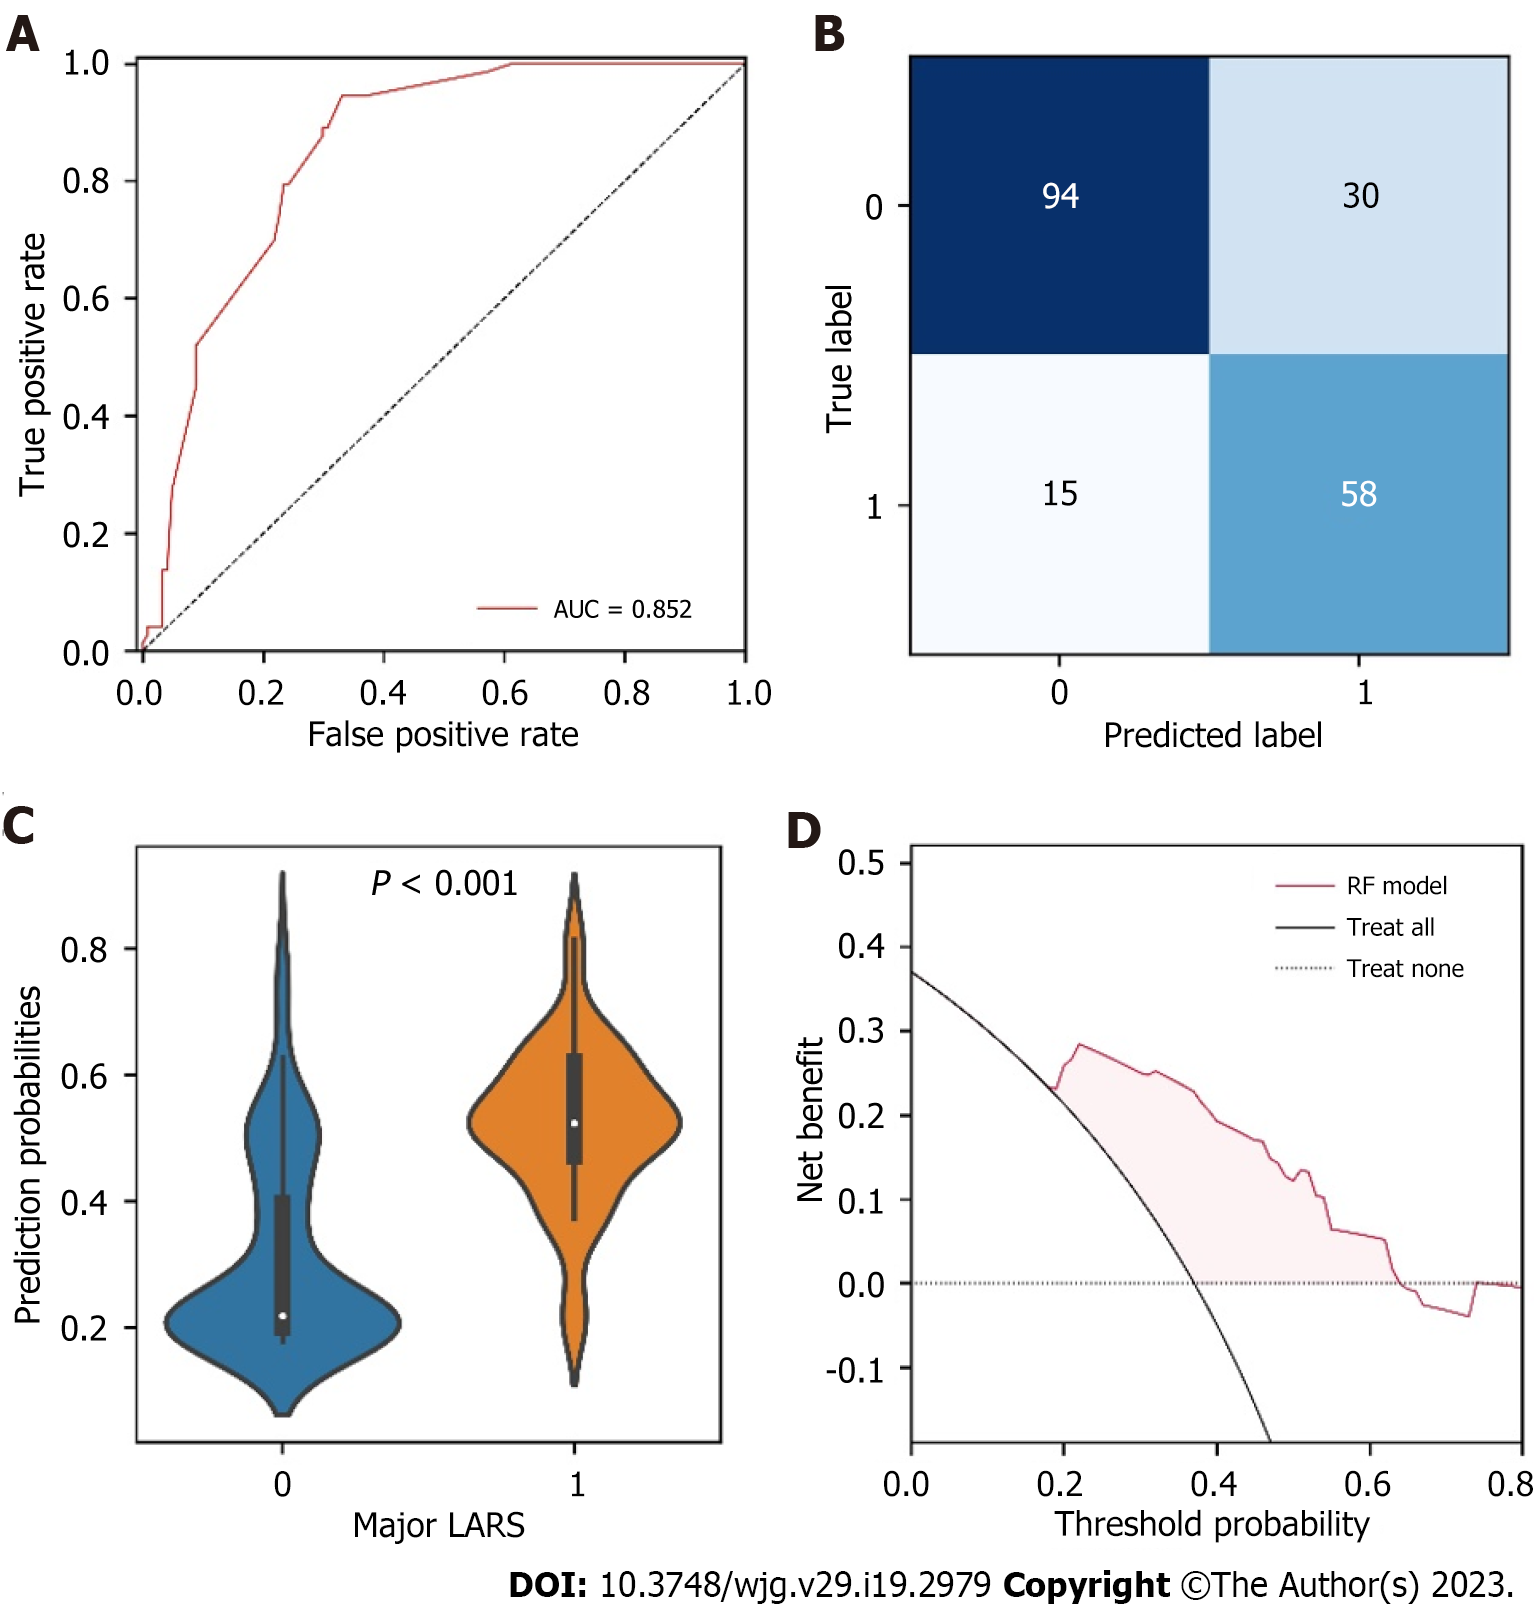
Figure 4 Performance of the random forest model in the external validation set.
A: Receiver operating characteristic curve of the random forest (RF) model in the external validation set; B: Confusion matrices showed the predicted outcomes generated by the RF model in the external validation set; C: Comparison of predicted probabilities between patients with and without major low anterior resection syndrome in the external validation set; D: Decision curve analysis for the RF model in the external validation set. AUC: Area under the curve; LARS: Low anterior resection syndrome; RF: Random forest.
- Citation: Wang Z, Shao SL, Liu L, Lu QY, Mu L, Qin JC. Machine learning model for prediction of low anterior resection syndrome following laparoscopic anterior resection of rectal cancer: A multicenter study. World J Gastroenterol 2023; 29(19): 2979-2991
- URL: https://www.wjgnet.com/1007-9327/full/v29/i19/2979.htm
- DOI: https://dx.doi.org/10.3748/wjg.v29.i19.2979


