Copyright
©The Author(s) 2023.
World J Gastroenterol. May 7, 2023; 29(17): 2679-2700
Published online May 7, 2023. doi: 10.3748/wjg.v29.i17.2679
Published online May 7, 2023. doi: 10.3748/wjg.v29.i17.2679
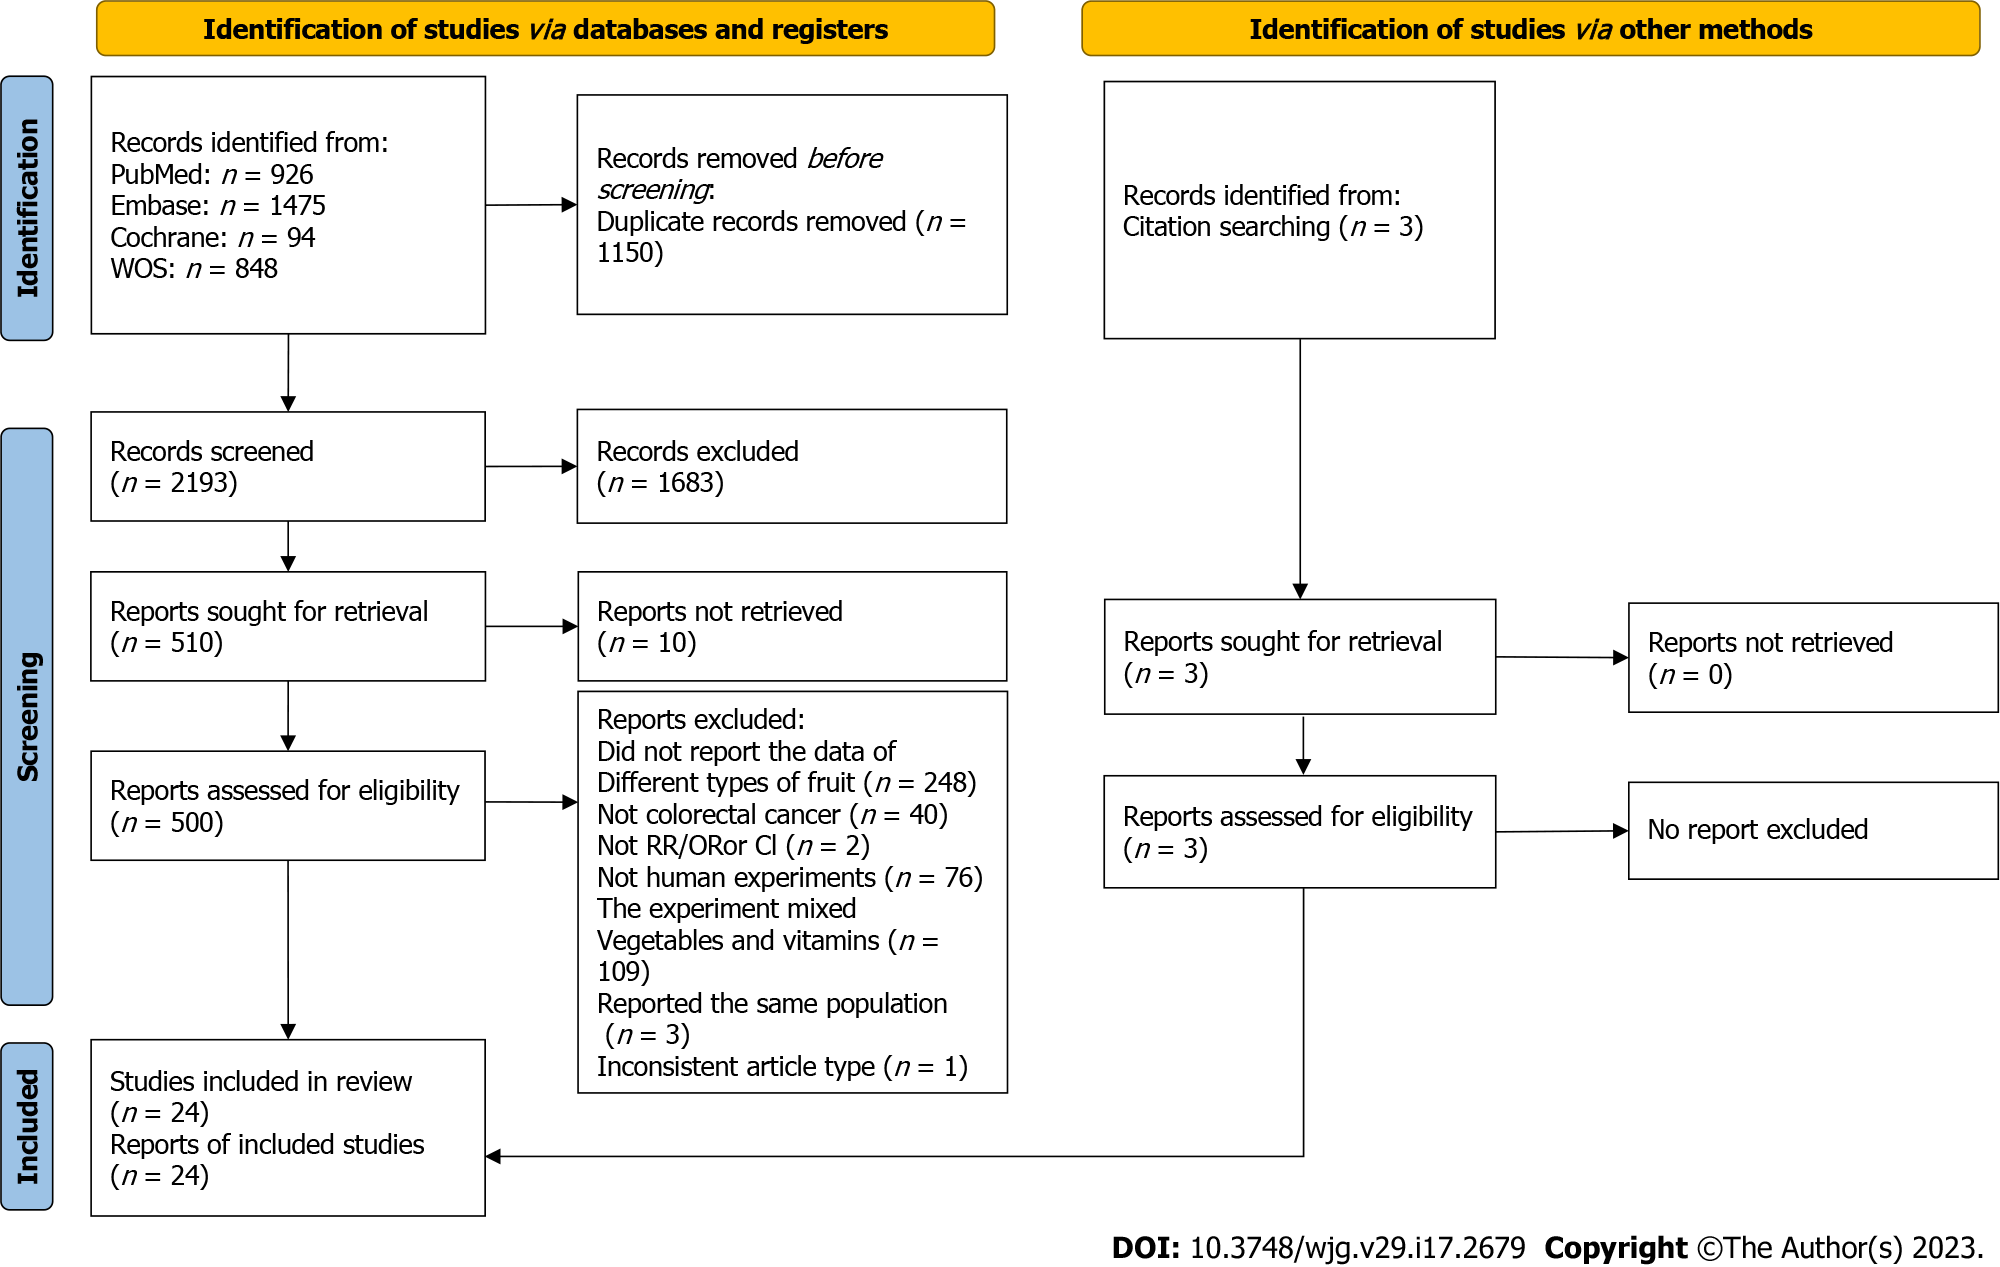
Figure 1 PRISMA flow chart of literature search and selection.
RR: Relative risk; OR: Odds ratio; CI: Confidence intervals.
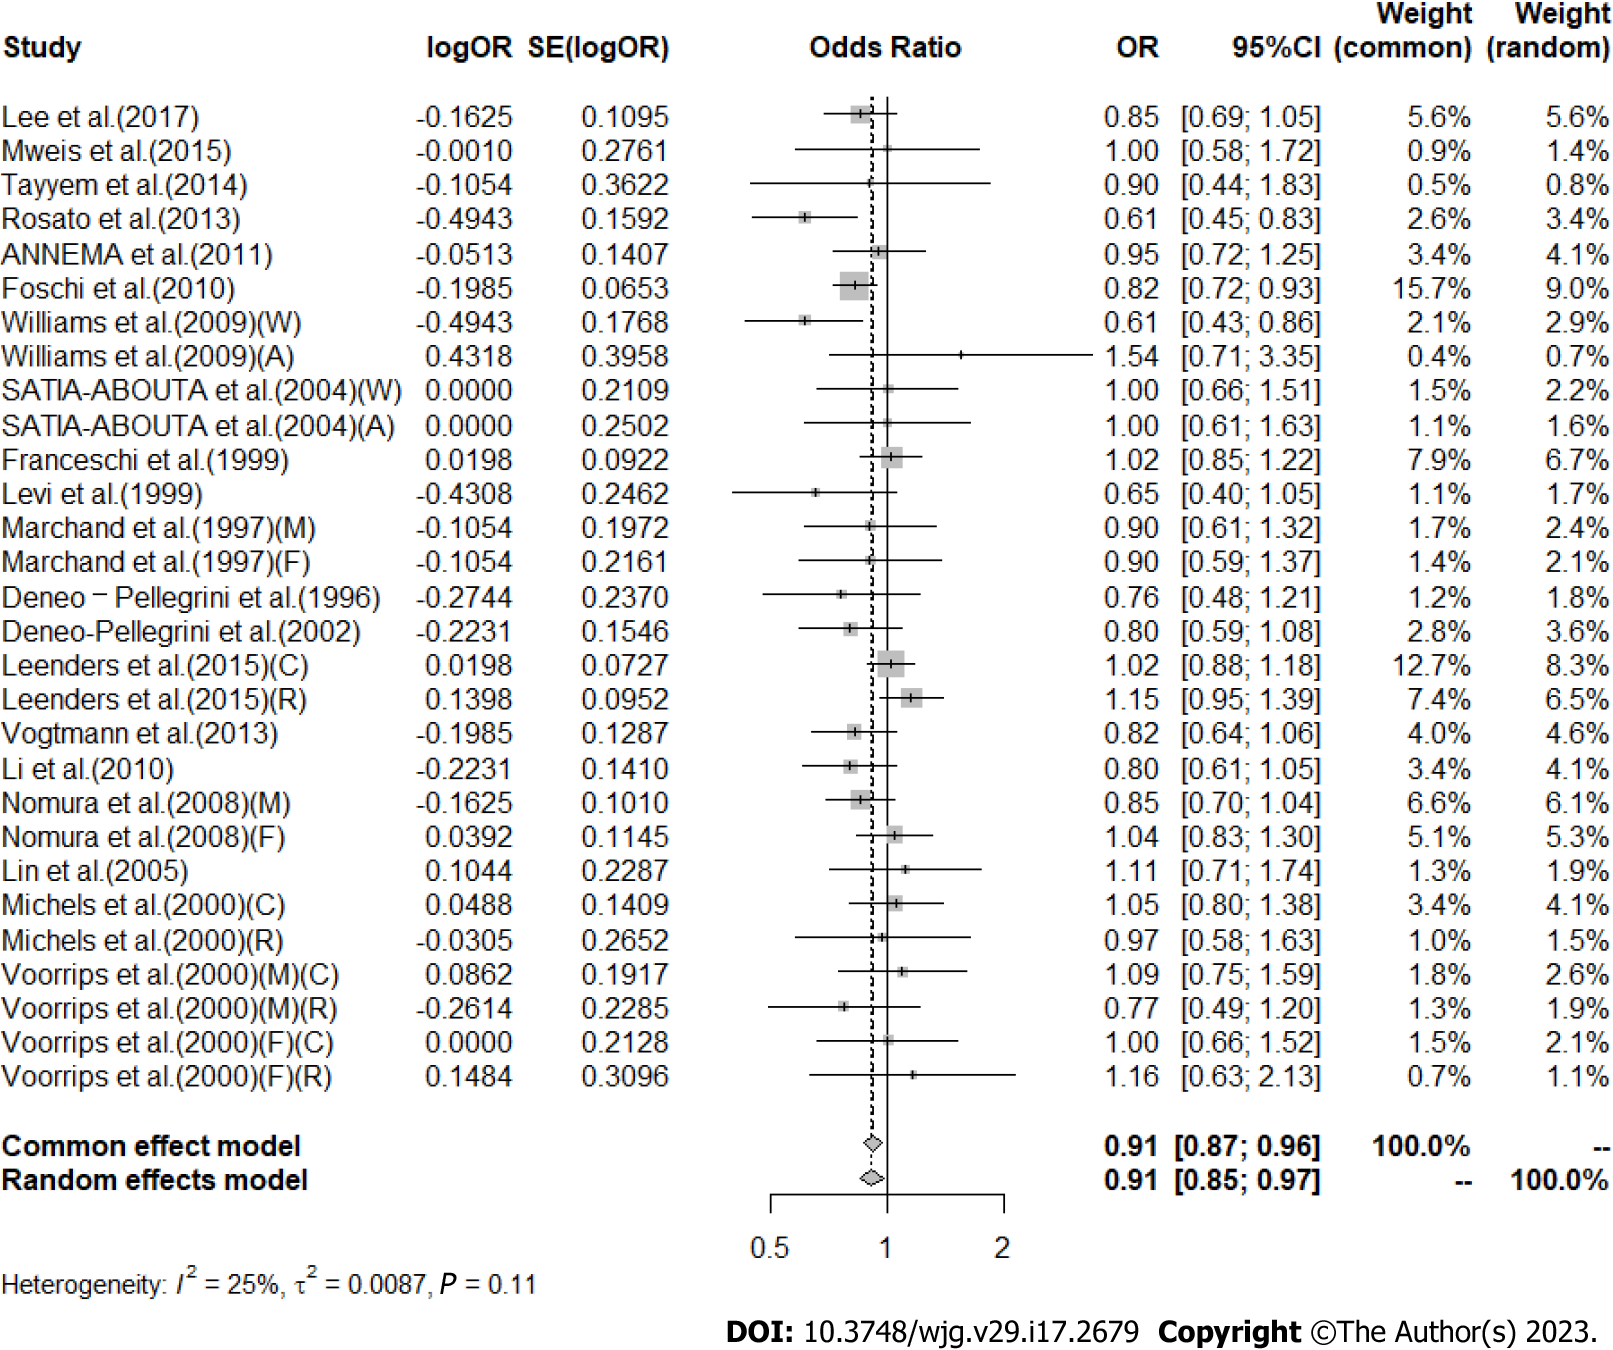
Figure 2 Meta-analysis of the risk of colorectal cancer in the highest vs lowest category of Citrus intake.
F: Female, M: Male; W: Whites, A: African-Americans; C: Colon cancer, R: Rectal cancer. OR: Odds ratio; CI: Confidence intervals.
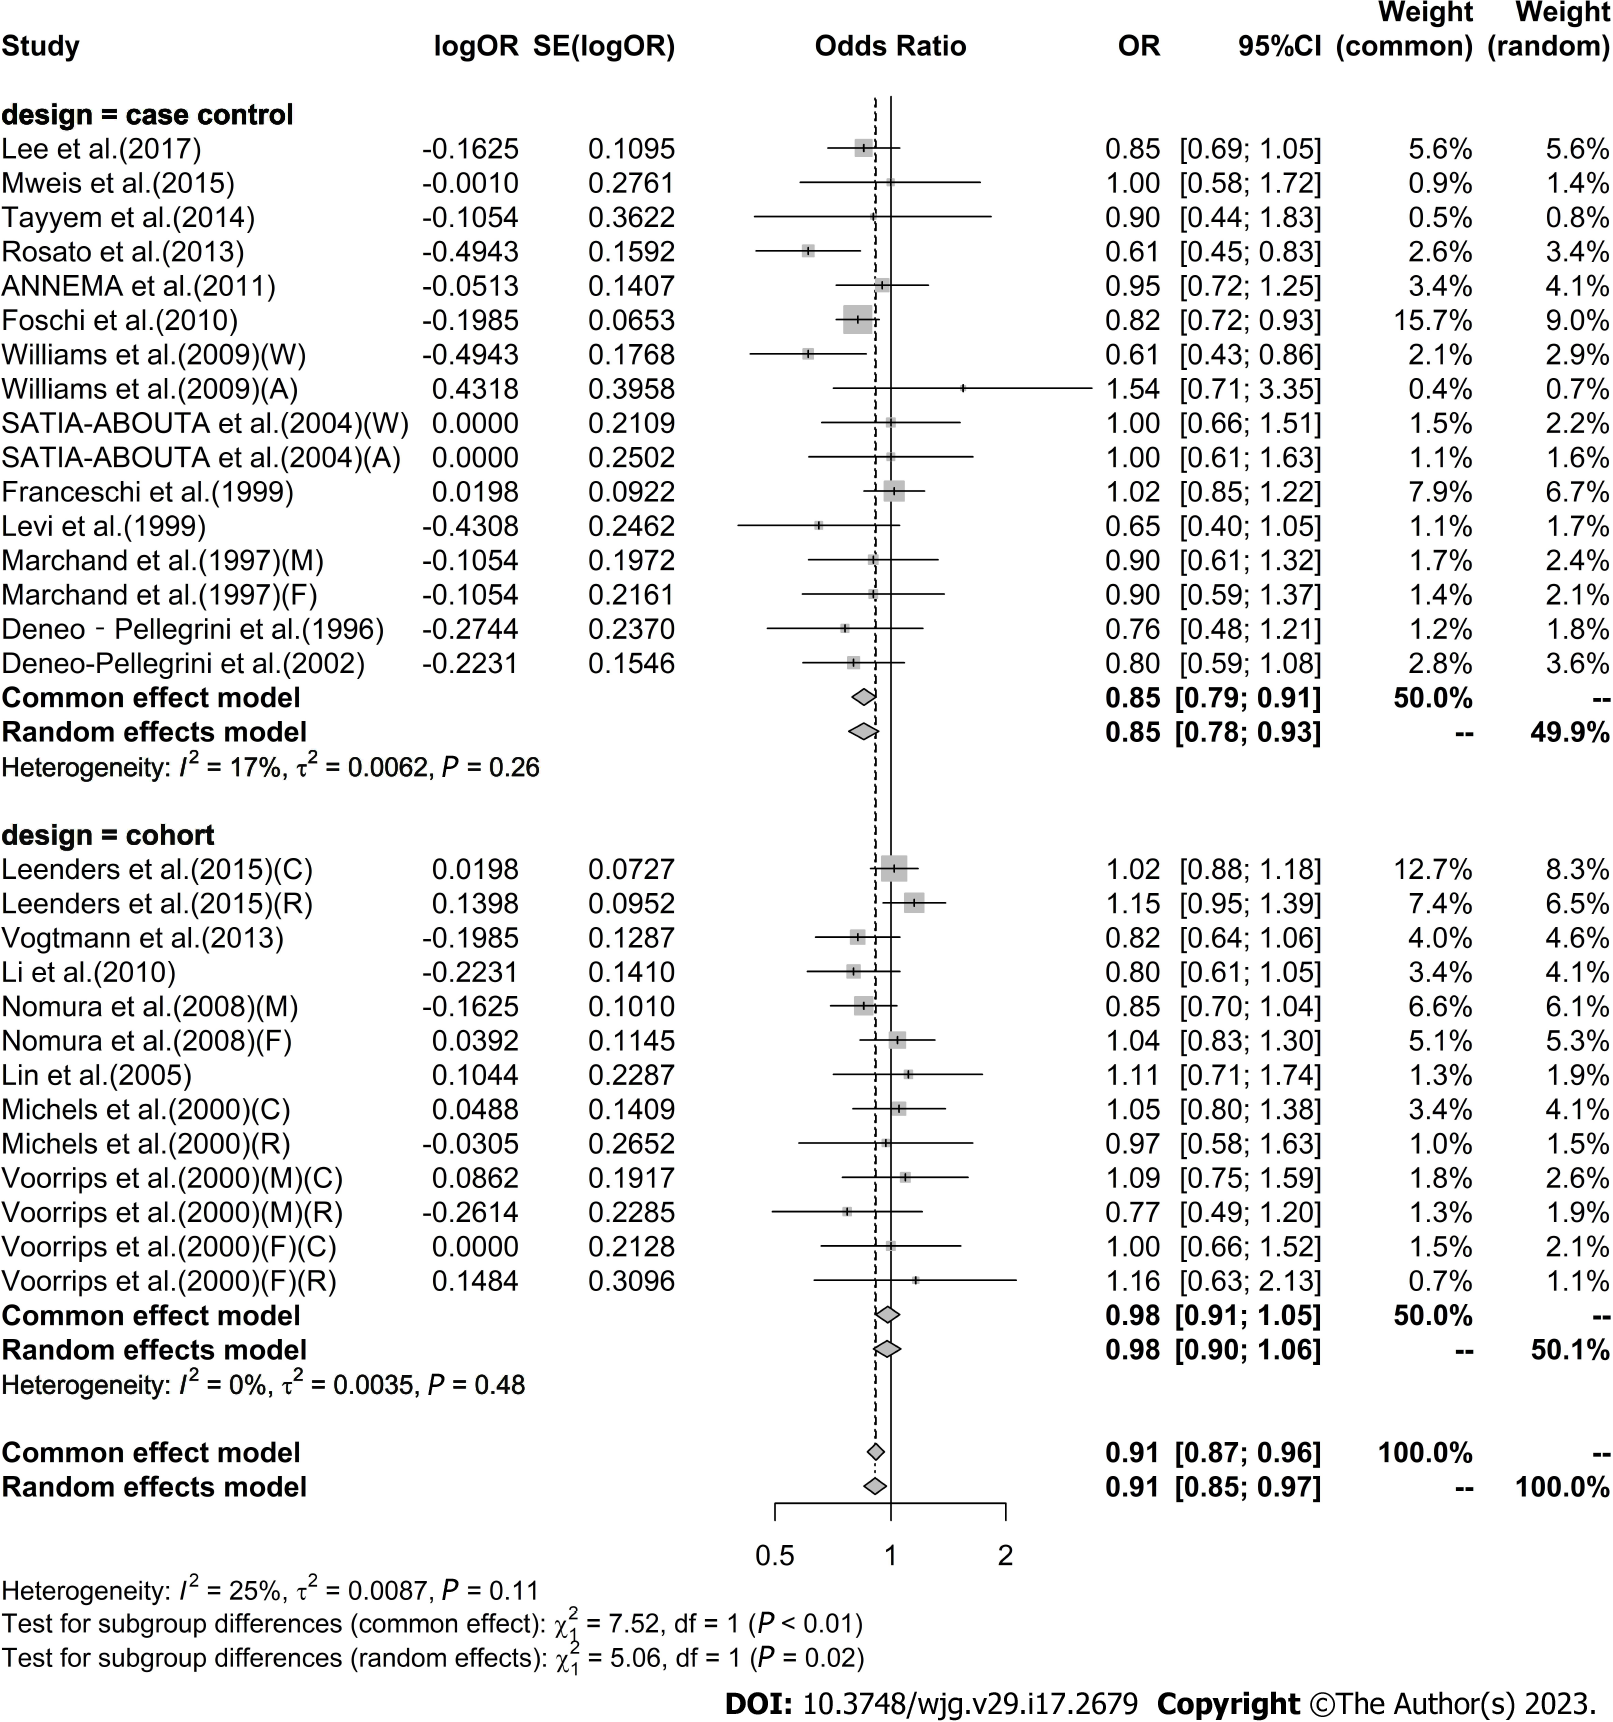
Figure 3 Subgroup analysis of the risk of colorectal cancer in the highest vs lowest category of Citrus intake by study type.
F: Female; M: Male; W: Whites; A: African-Americans; C: Colon cancer; R: Rectal cancer; OR: Odds ratio; CI: Confidence intervals.
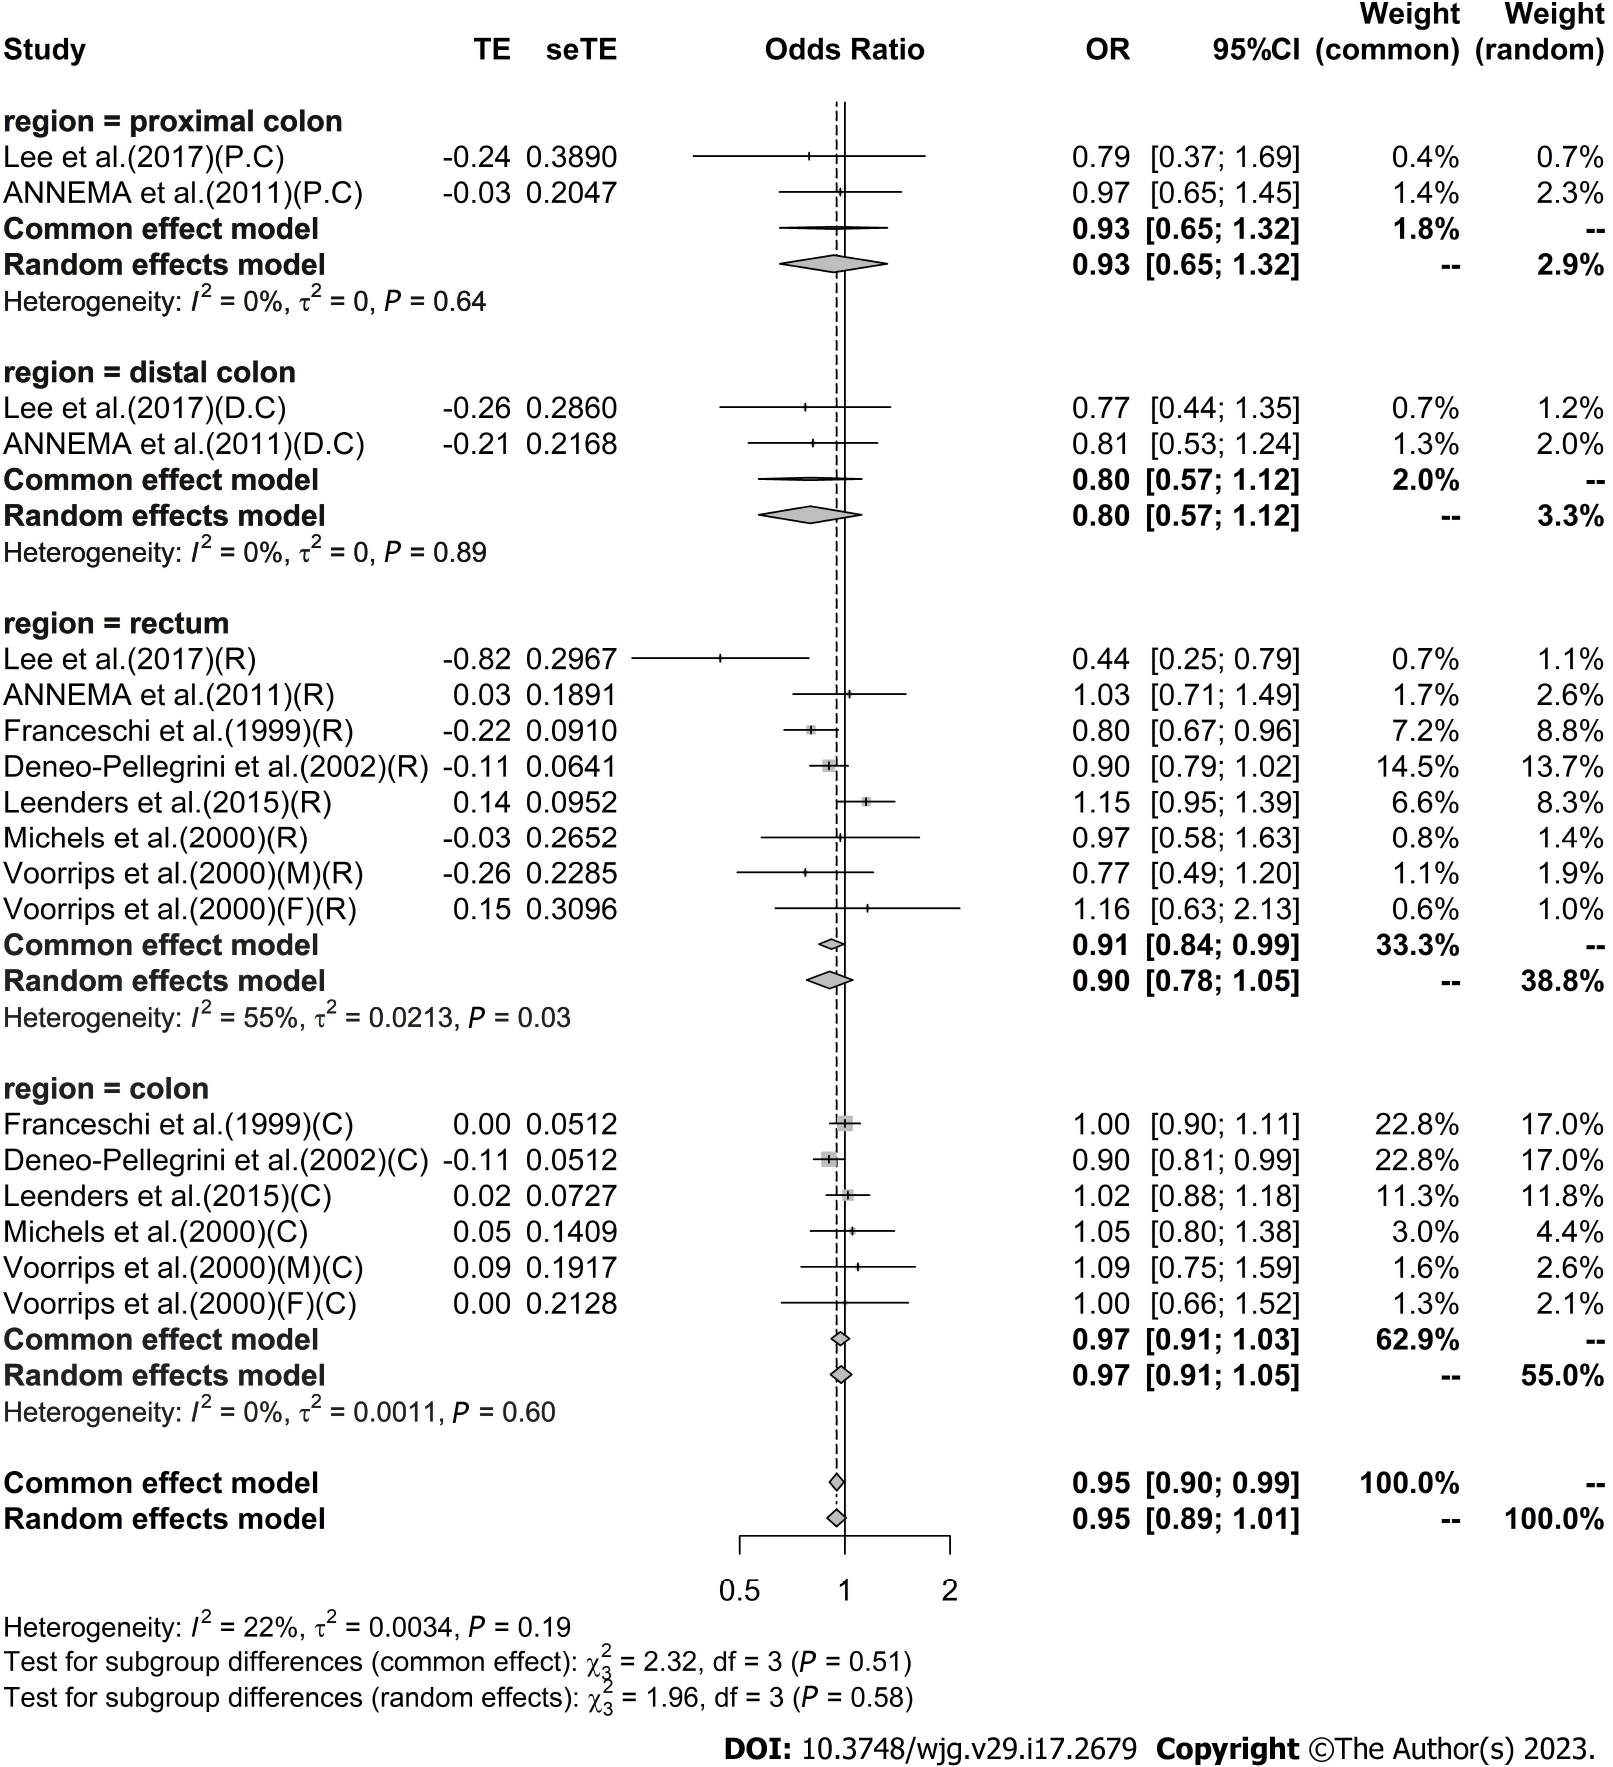
Figure 4 Subgroup analysis of the risk of colorectal cancer in the highest vs lowest category of Citrus intake by region of cancer.
PC: Proximal colon cancer; DC: Distal colon cancer; C: Colon cancer; R: Rectal cancer; F: Female; M: Male; OR: Odds ratio; CI: Confidence intervals.
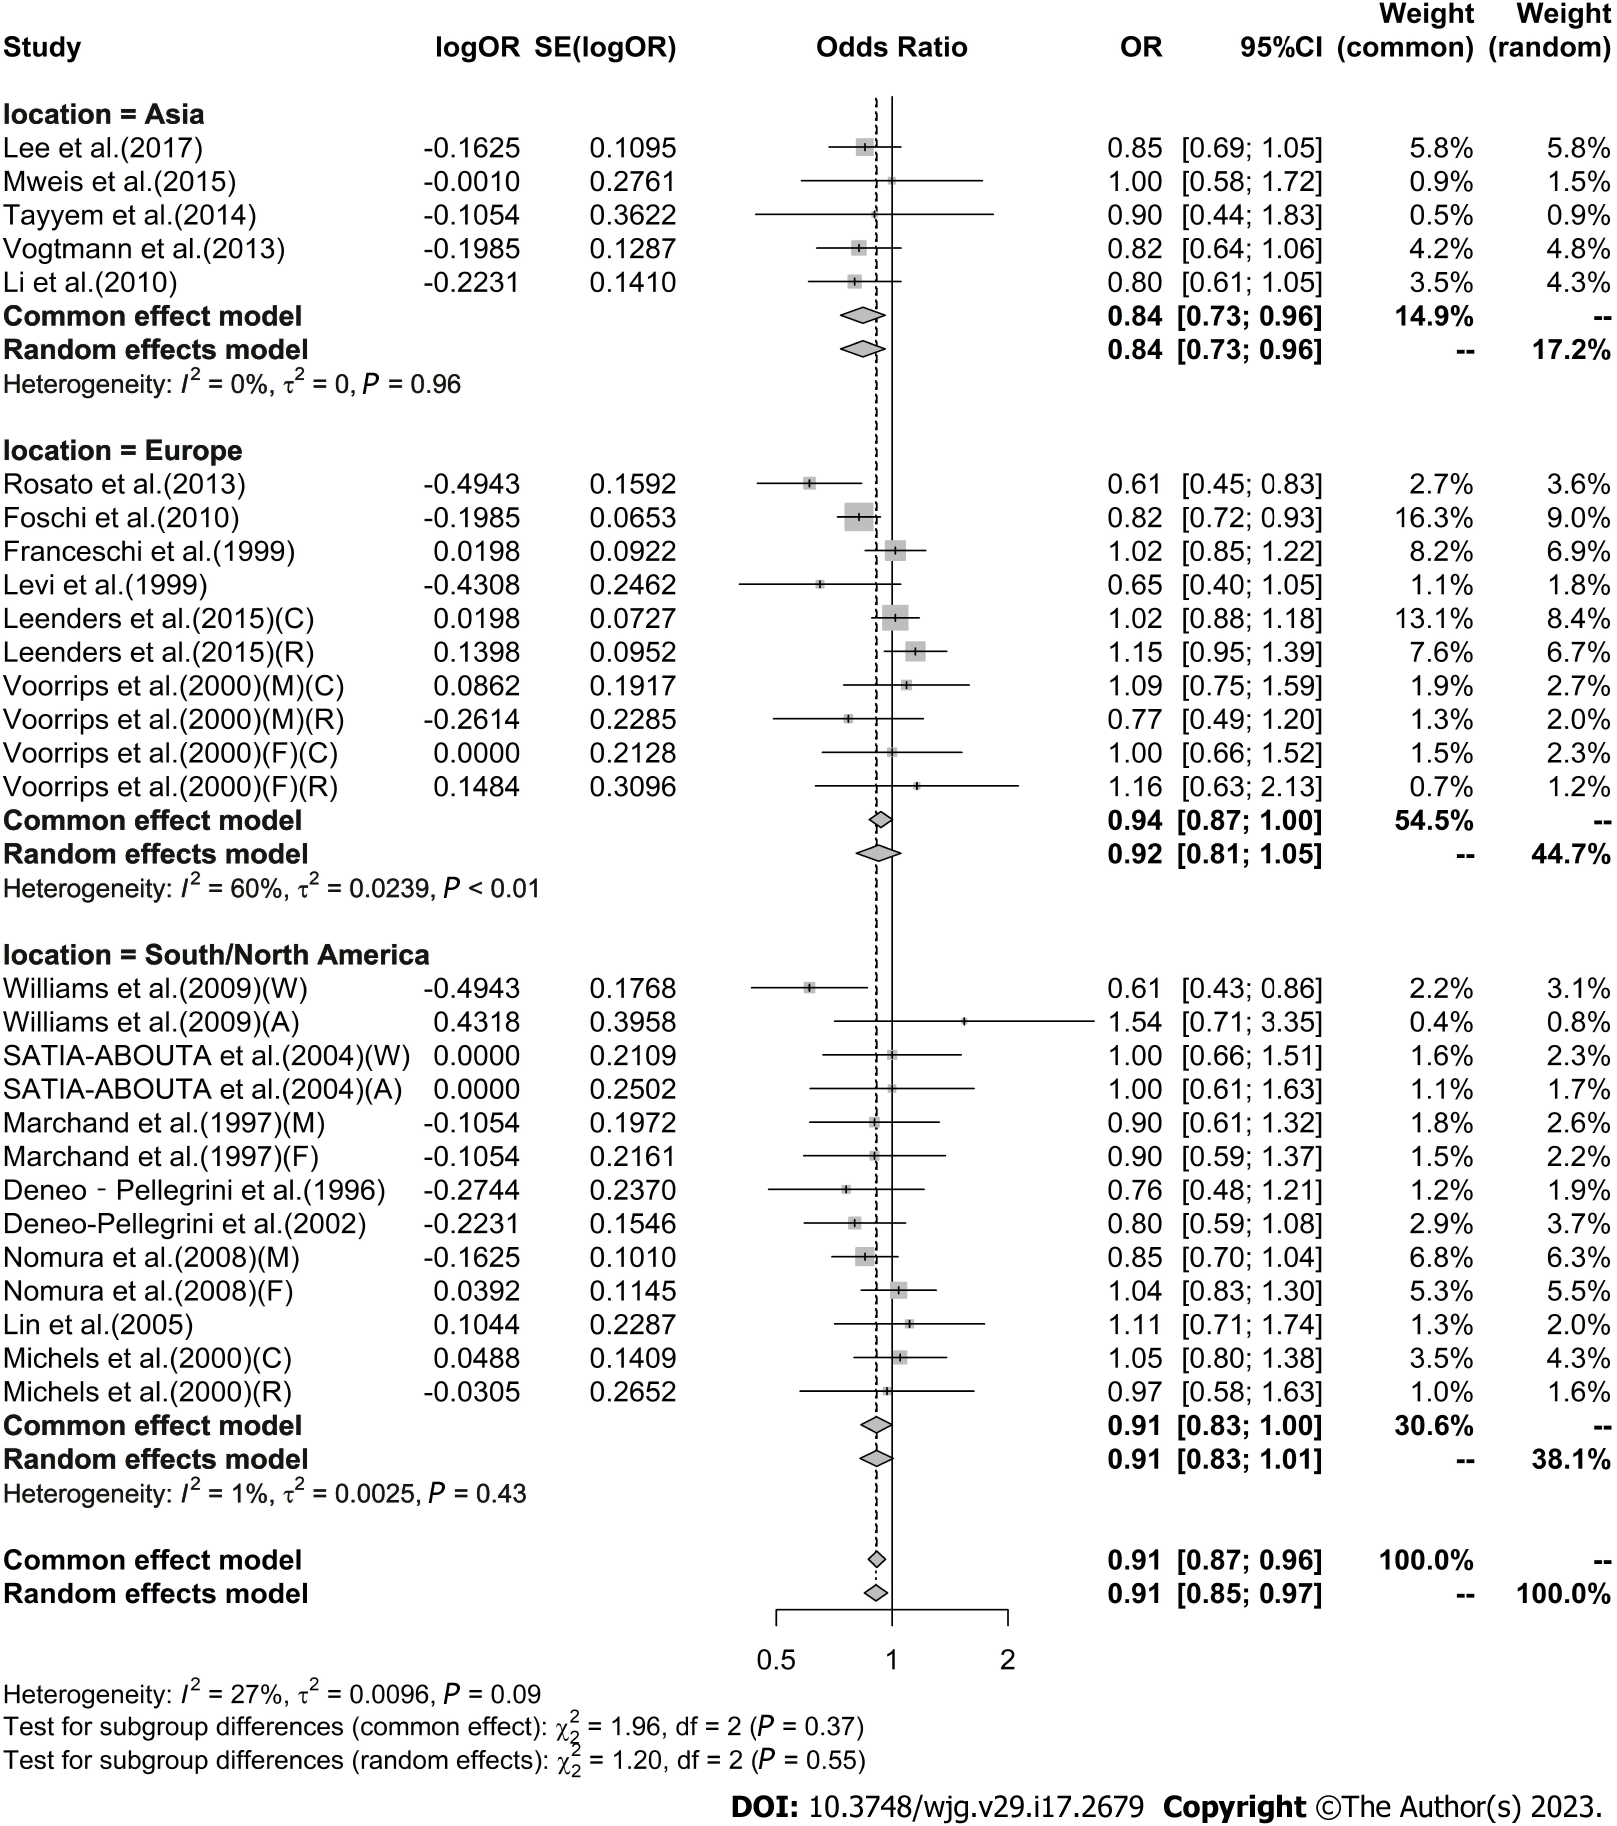
Figure 5 Subgroup analysis of the risk of colorectal cancer in the highest vs lowest category of Citrus intake by location.
F: Female; M: Male; W: Whites; A: African-Americans; C: Colon cancer; R: Rectal cancer; OR: Odds ratio; CI: Confidence intervals.
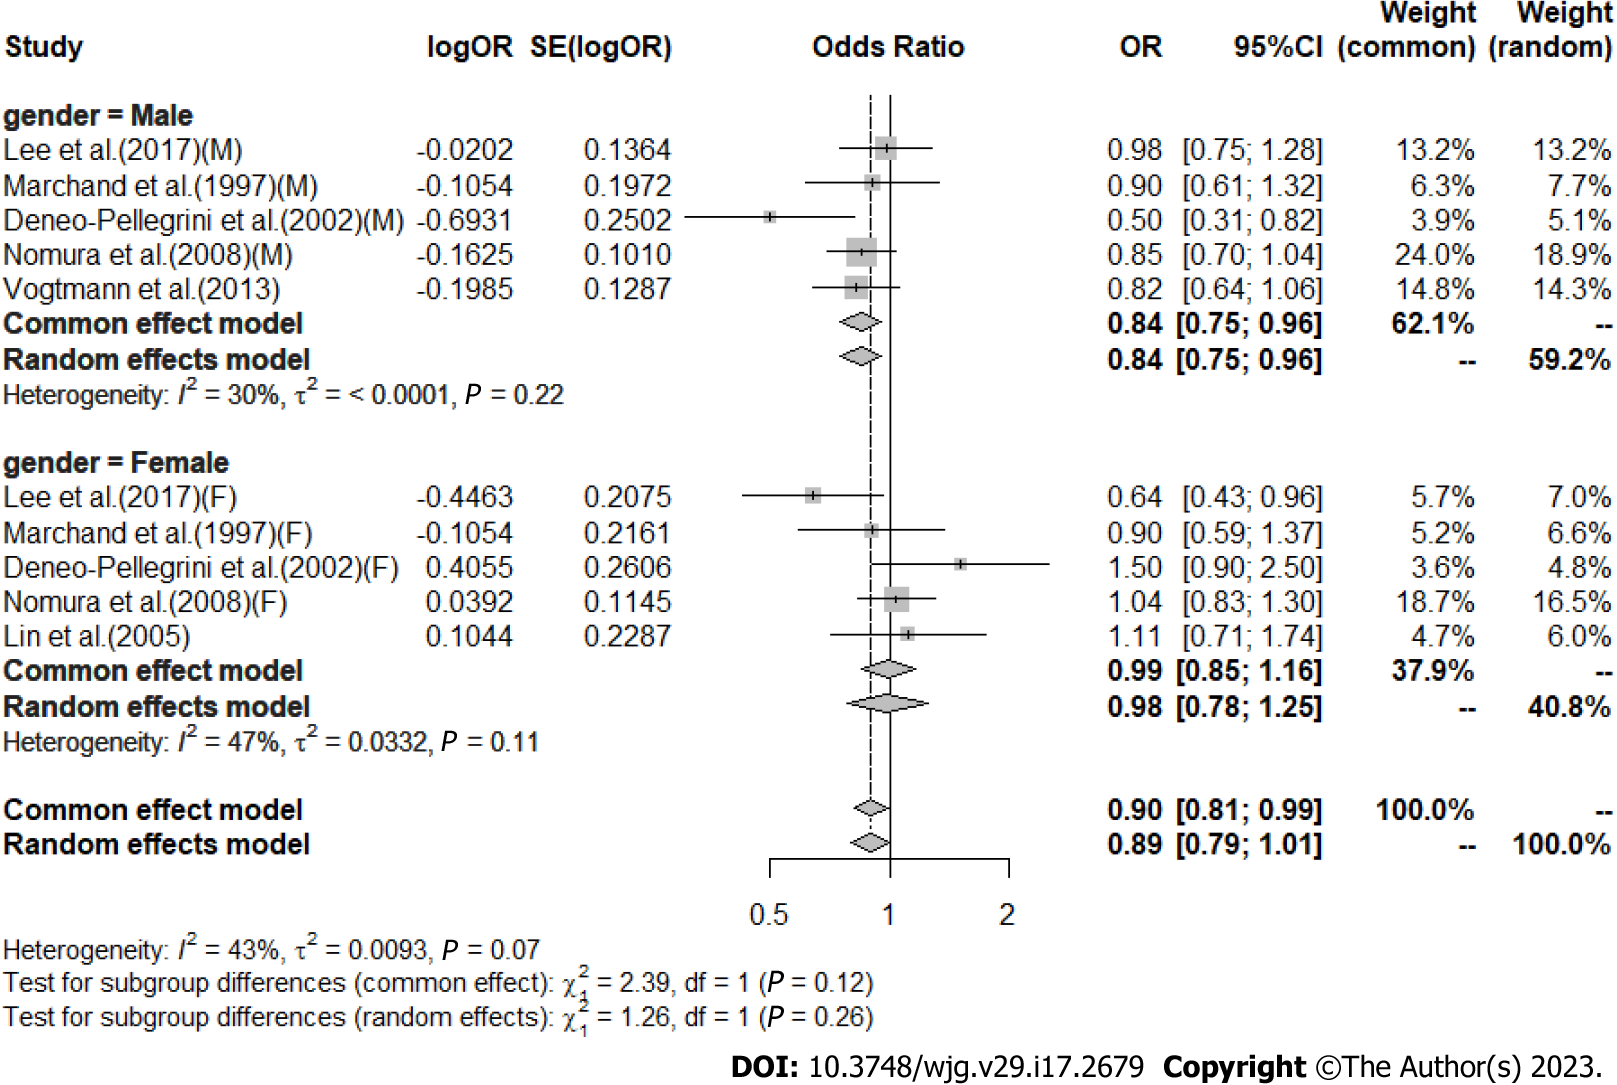
Figure 6 Subgroup analysis of the risk of colorectal cancer in the highest vs lowest category of Citrus intake by gender.
F: Female; M: Male; OR: Odds ratio; CI: Confidence intervals.
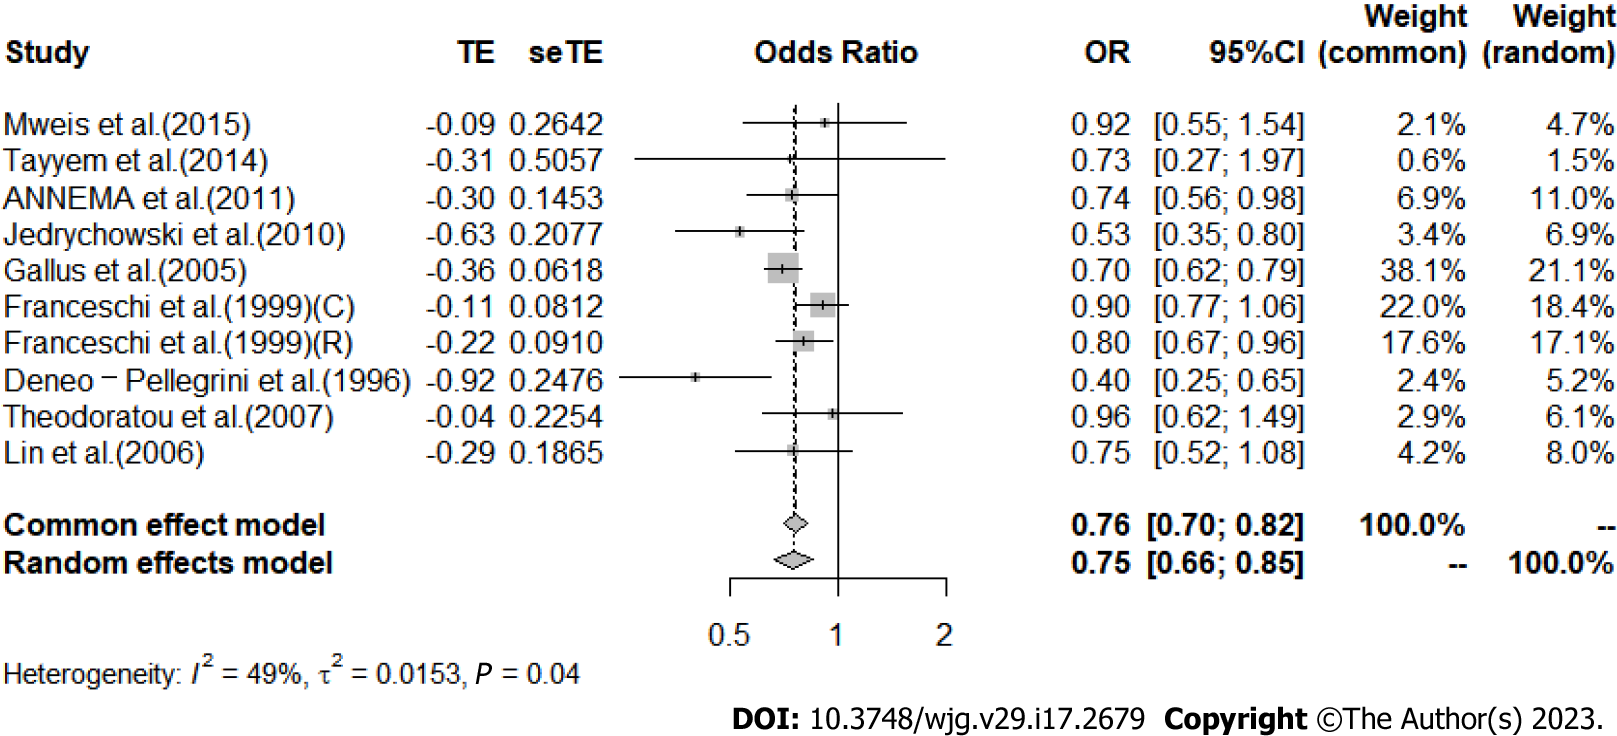
Figure 7 Meta-analysis of the risk of colorectal cancer in the highest vs lowest category of Apple intake.
C: Colon cancer; R: Rectal cancer; OR: Odds ratio; CI: Confidence intervals.
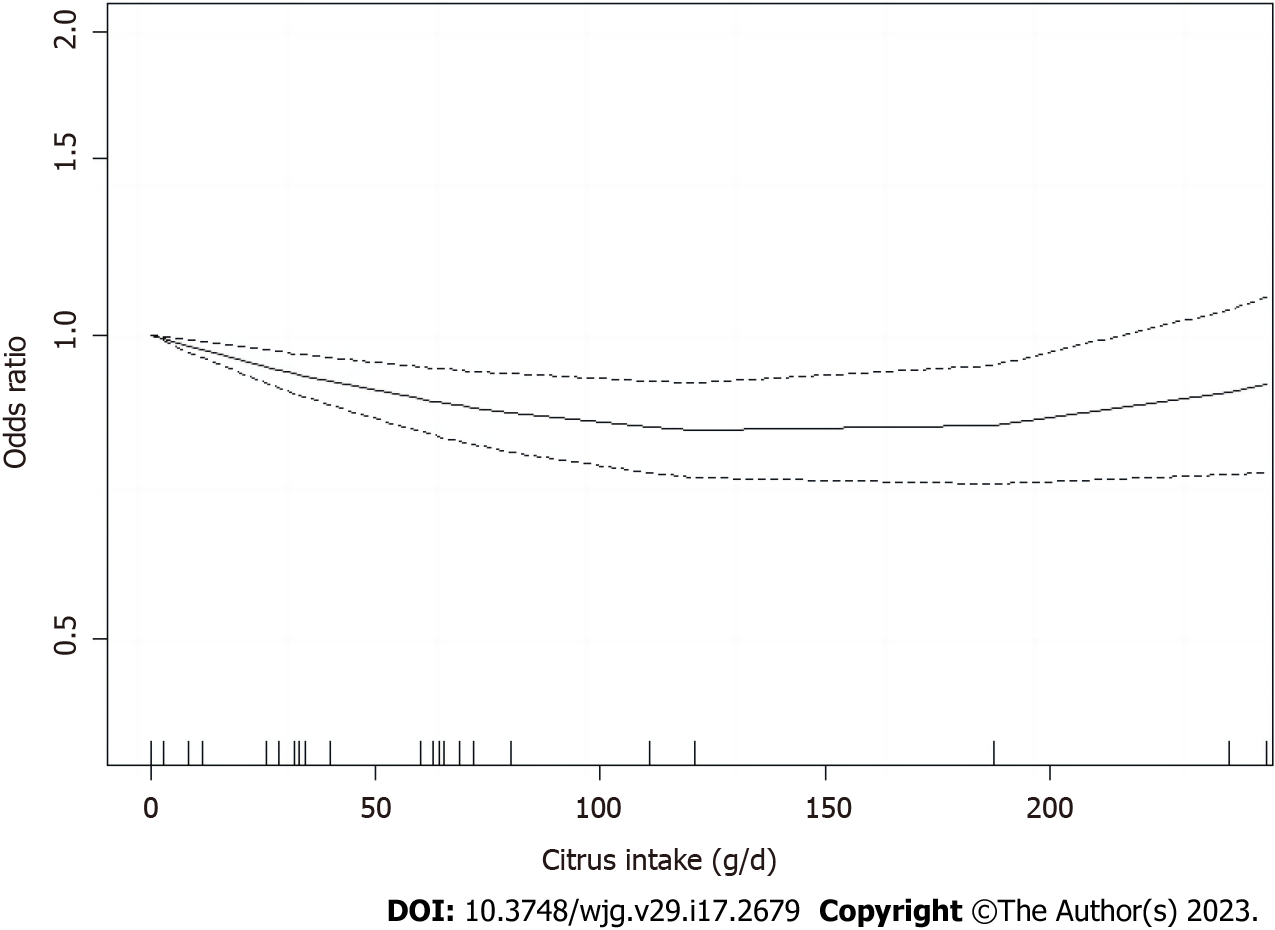
Figure 8 Nonlinear relation between Citrus fruit intake and the risk of colorectal cancer.
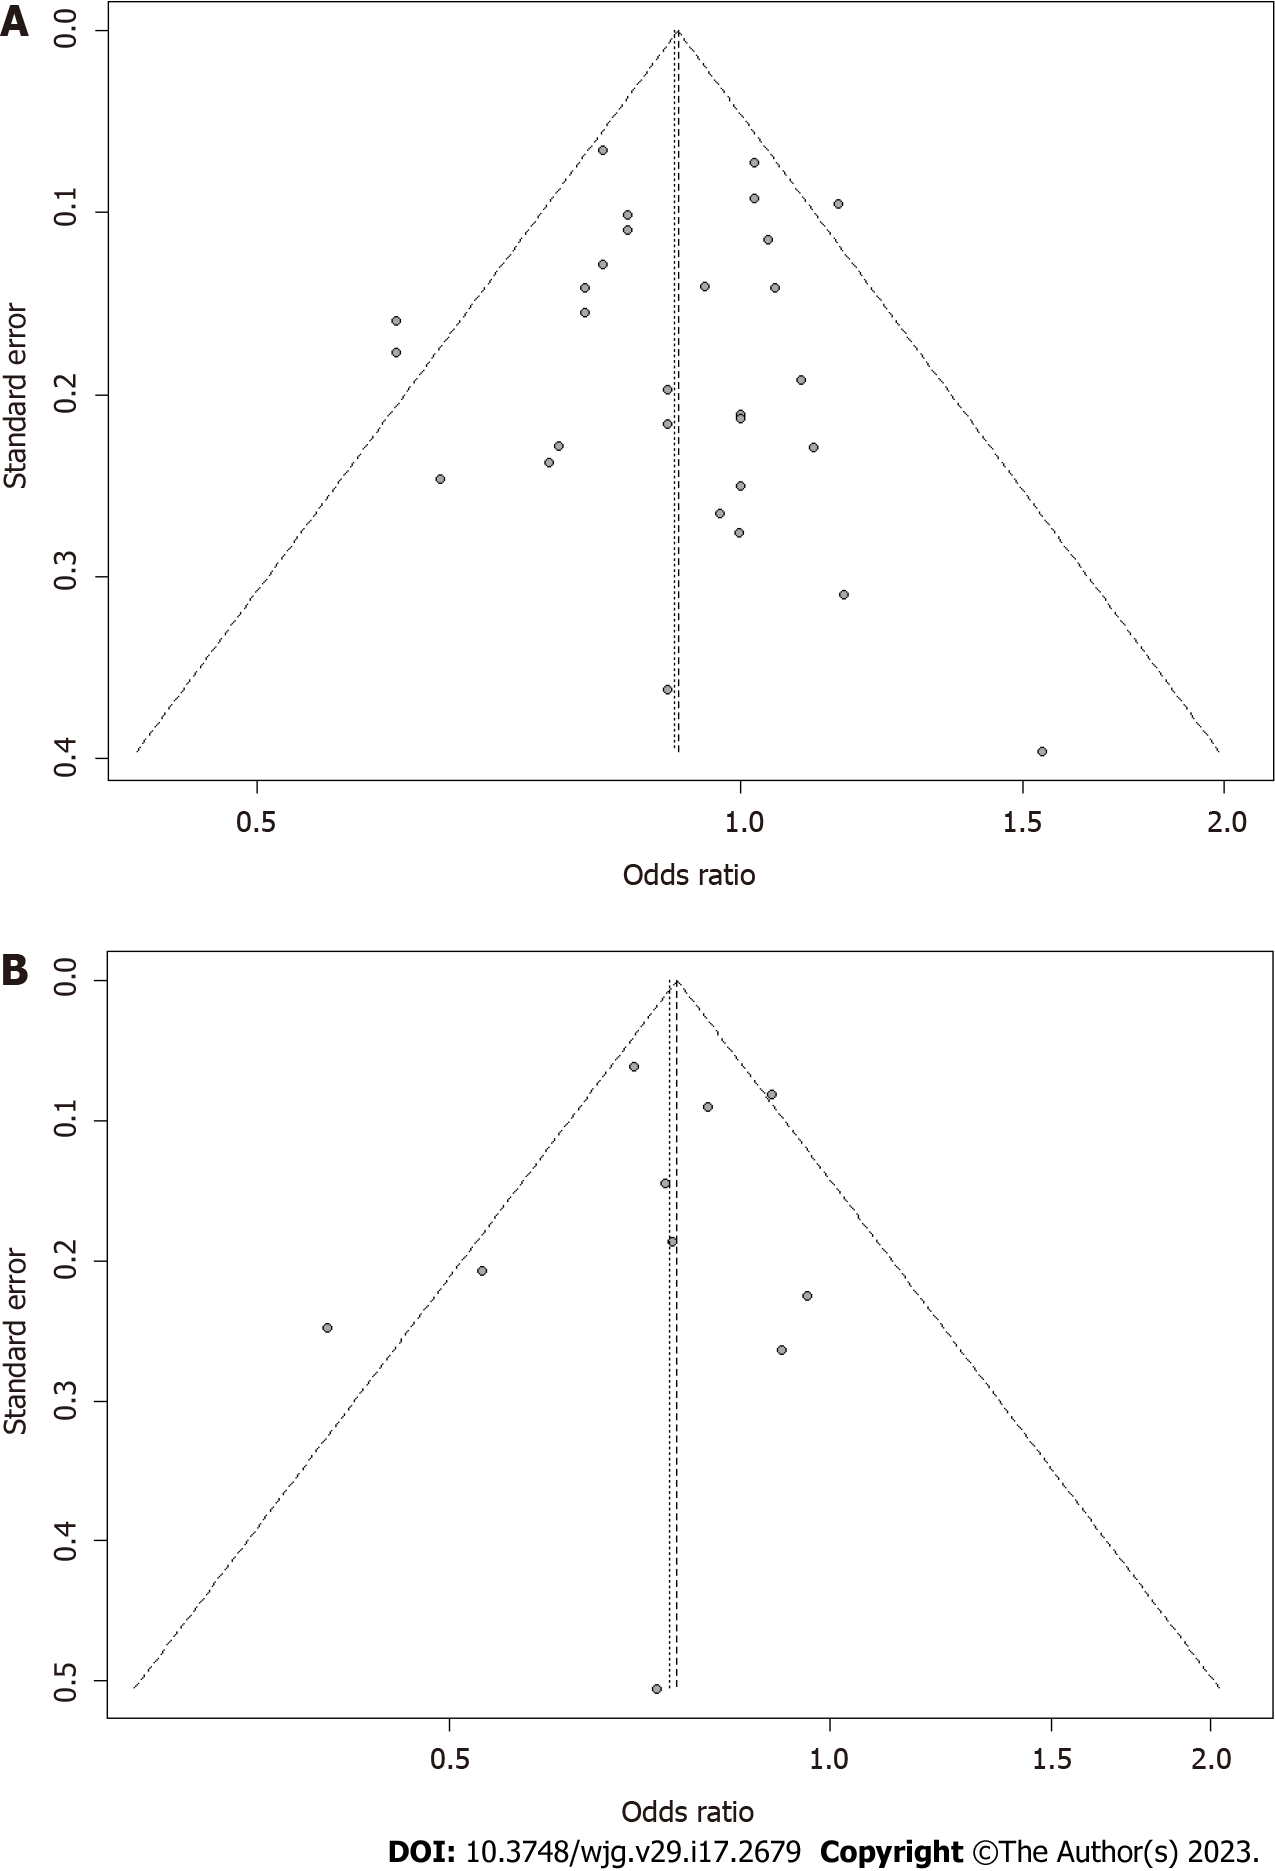
Figure 9 Funnel plot.
A: Funnel plot of studies evaluating for the association between Citrus fruit intake and risk of colorectal cancer. Dotted lines on both sides indicate 95% pseudo-confidence intervals; B: Funnel plot of studies evaluating for the association between Apple intake and risk of colorectal cancer. OR: Odds ratio; CI: Confidence intervals.
- Citation: Wu ZY, Chen JL, Li H, Su K, Han YW. Different types of fruit intake and colorectal cancer risk: A meta-analysis of observational studies. World J Gastroenterol 2023; 29(17): 2679-2700
- URL: https://www.wjgnet.com/1007-9327/full/v29/i17/2679.htm
- DOI: https://dx.doi.org/10.3748/wjg.v29.i17.2679


