Copyright
©The Author(s) 2023.
World J Gastroenterol. May 7, 2023; 29(17): 2666-2678
Published online May 7, 2023. doi: 10.3748/wjg.v29.i17.2666
Published online May 7, 2023. doi: 10.3748/wjg.v29.i17.2666
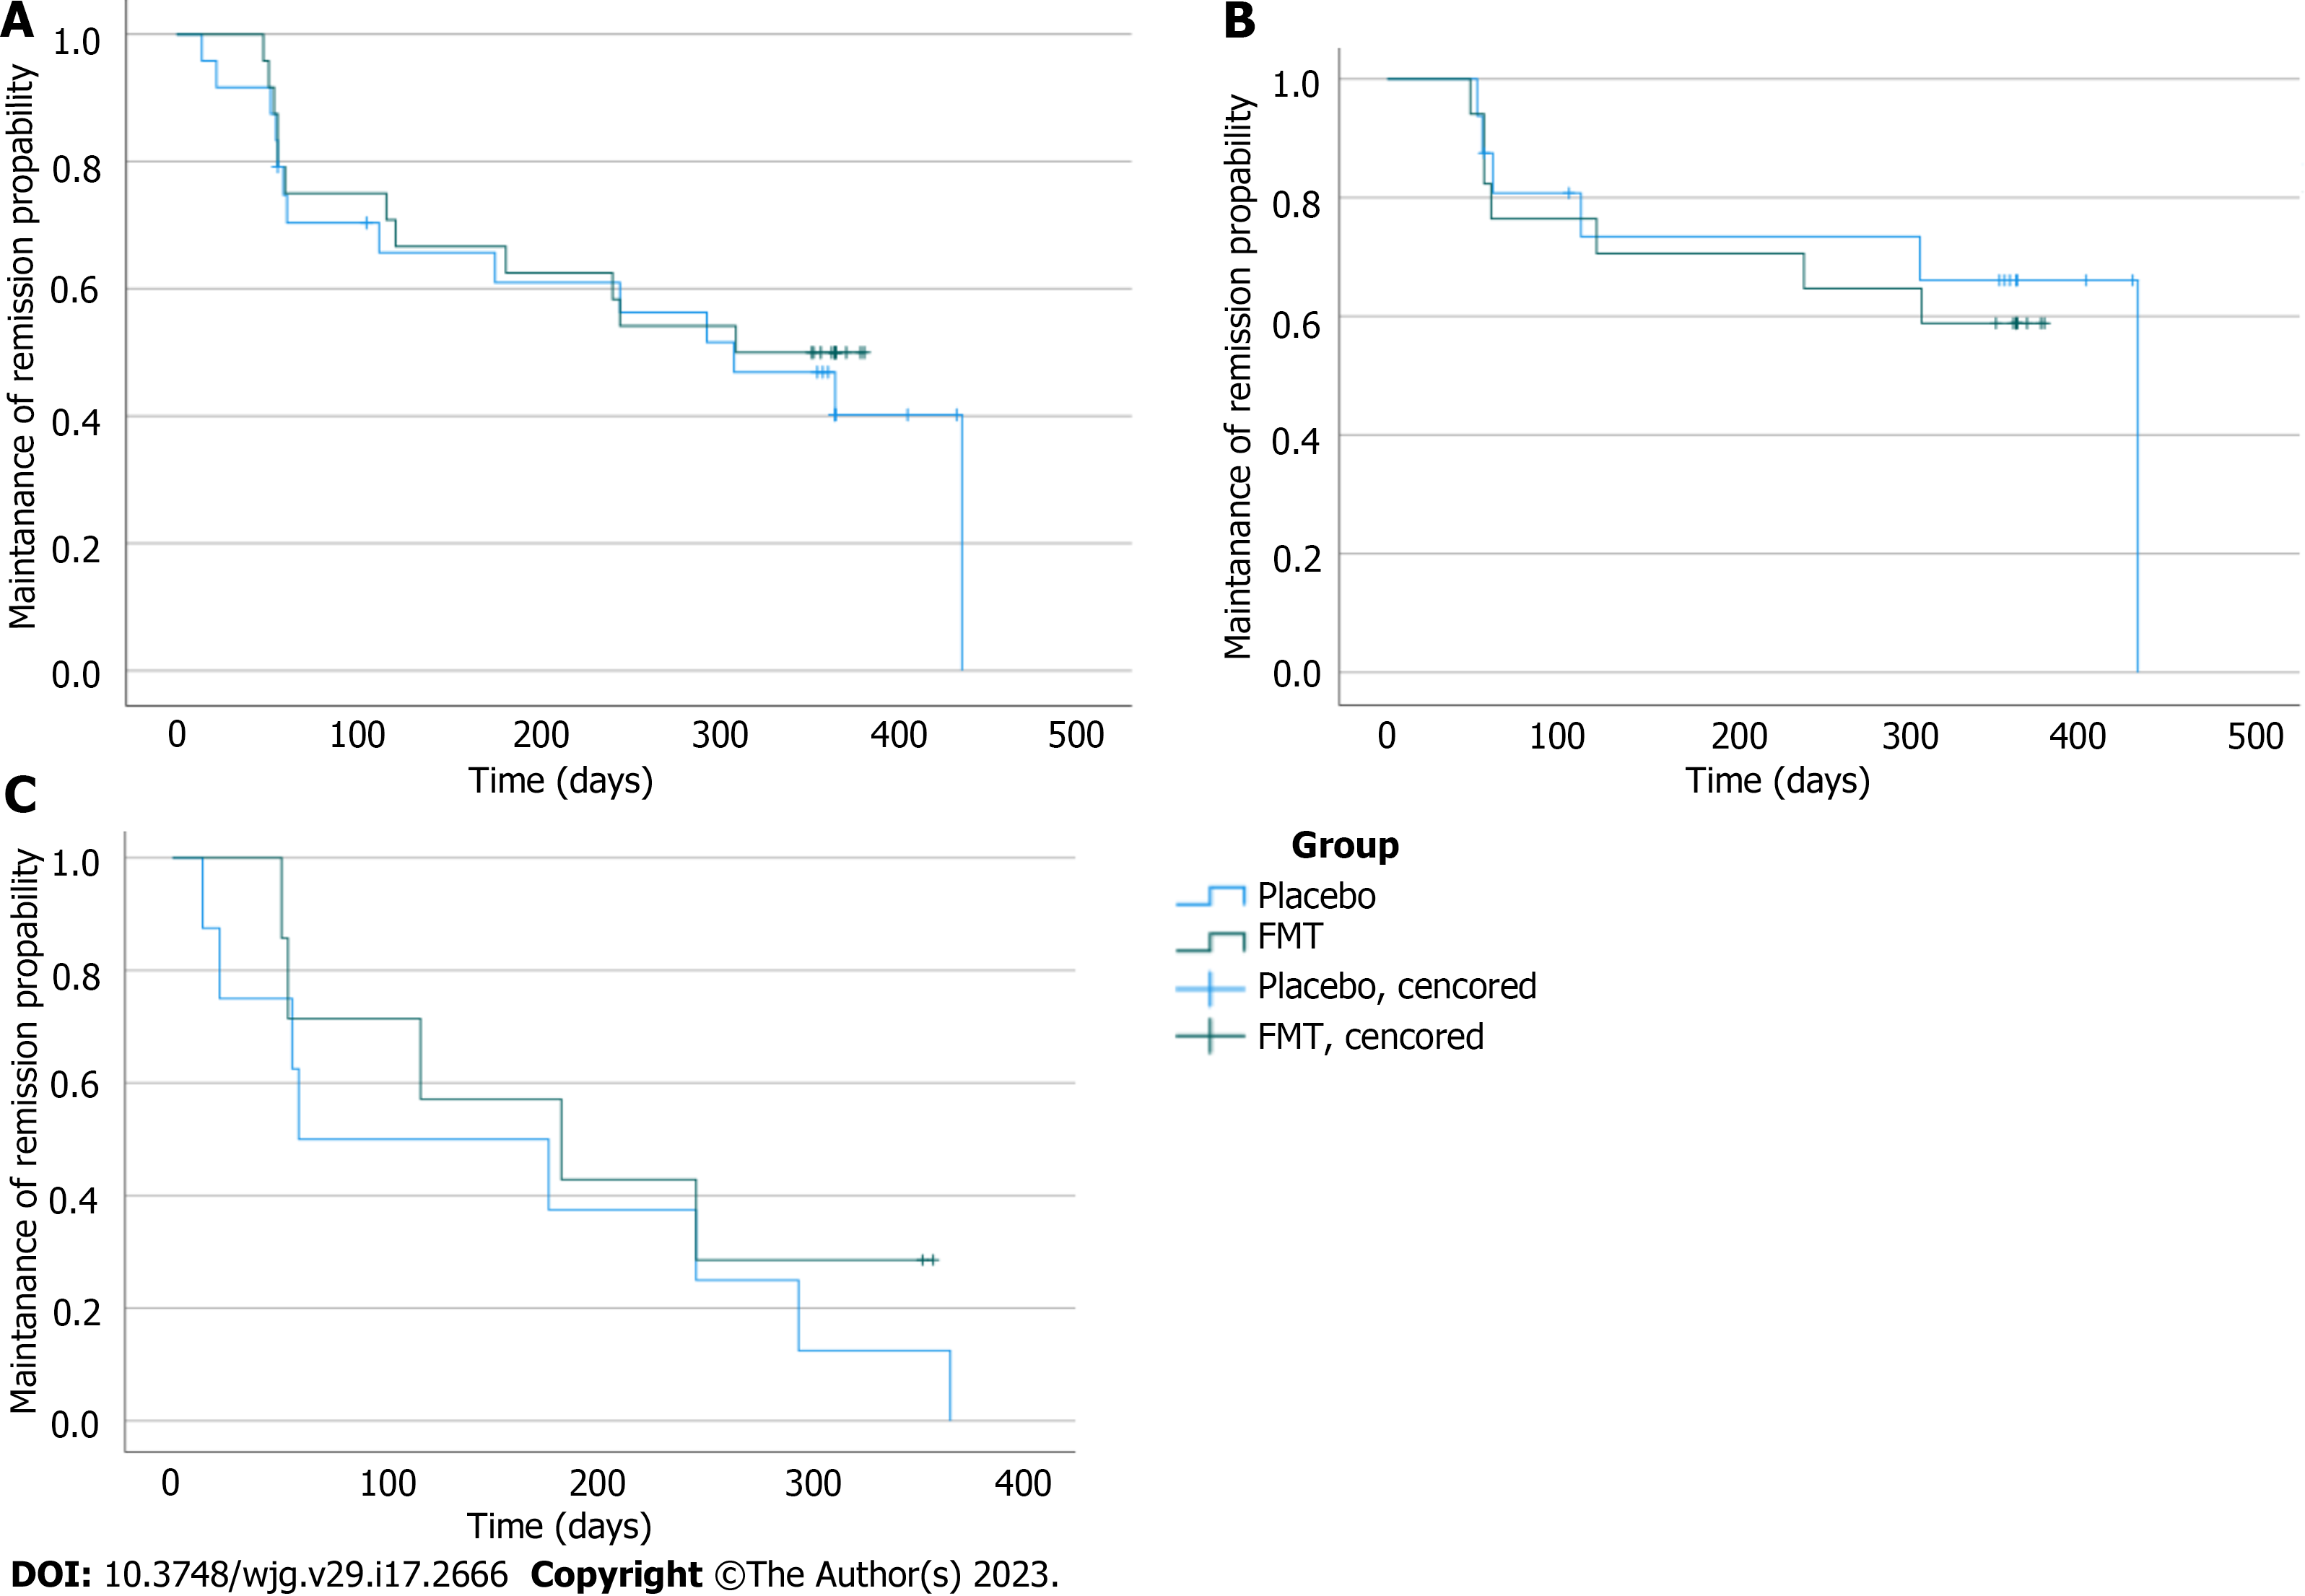
Figure 1 Kaplan-Meier survival curve demonstrating the maintenance of remission defined as fecal calprotectin < 200 μg/g and the clinical Mayo score < 3 or an overt relapse in between the measurement points.
A: All patients included in analysis (log rank test P = 0.660); B: Subgroup A, i.e. the patients with fecal calprotectin < 200 μg/g and clinical Mayo score < 3 at the baseline (P = 0.703); C: Subgroup B, i.e. the patients with fecal calprotectin ≥ 200 μg/g or the clinical Mayo score ≥ 3 at the baseline (P = 0.556). Censored means the end of follow-up without a relapse. FMT: Fecal microbiota transplantation.
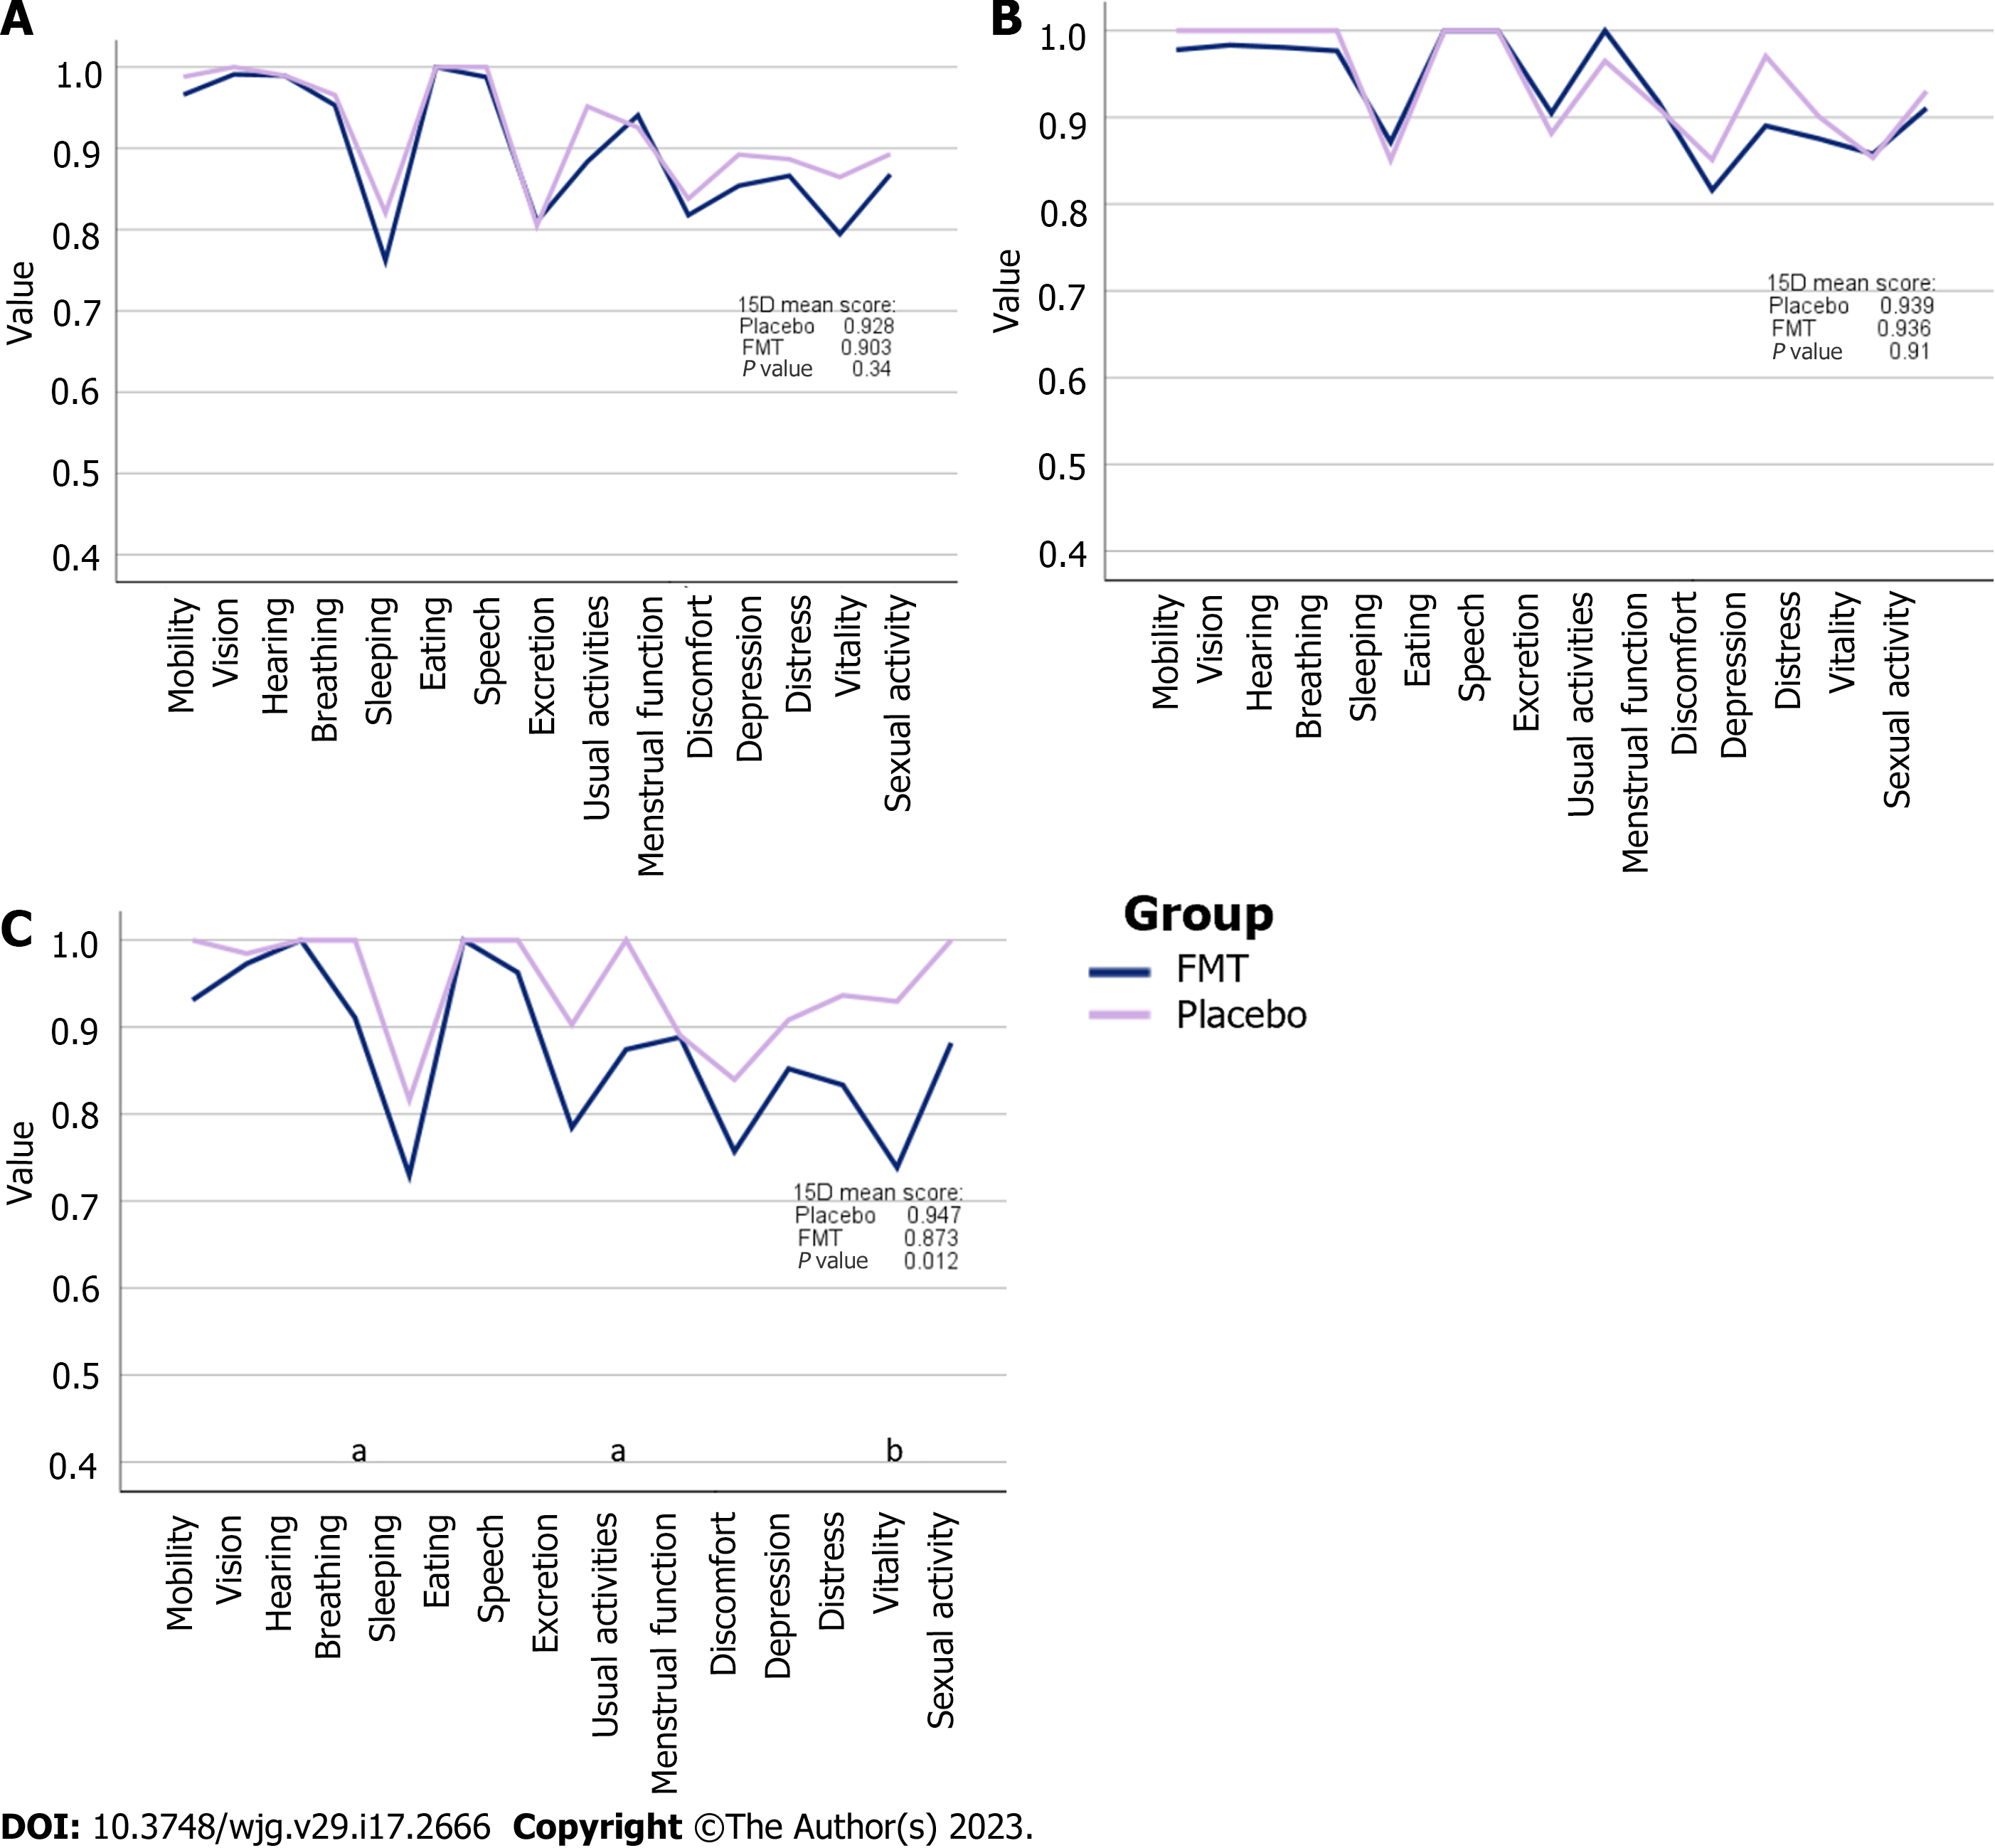
Figure 2 The general quality of life of the complete study group shown according to the 15 dimensions and the mean total score and P value as expressed numerically within the picture.
A: The total score of the 15 dimensions quality of life questionnaire (15D) profiles at the baseline (n = 48); B: 15D profiles at 12 mo (n = 21); C: 15D profiles at 4 mo (n = 30). aP ≤ 0.05 and bP ≤ 0.01. FMT: Fecal microbiota transplantation; 15D: The total score of the 15 dimensions quality of life questionnaire.
- Citation: Lahtinen P, Jalanka J, Mattila E, Tillonen J, Bergman P, Satokari R, Arkkila P. Fecal microbiota transplantation for the maintenance of remission in patients with ulcerative colitis: A randomized controlled trial. World J Gastroenterol 2023; 29(17): 2666-2678
- URL: https://www.wjgnet.com/1007-9327/full/v29/i17/2666.htm
- DOI: https://dx.doi.org/10.3748/wjg.v29.i17.2666


