Copyright
©The Author(s) 2023.
World J Gastroenterol. May 7, 2023; 29(17): 2642-2656
Published online May 7, 2023. doi: 10.3748/wjg.v29.i17.2642
Published online May 7, 2023. doi: 10.3748/wjg.v29.i17.2642
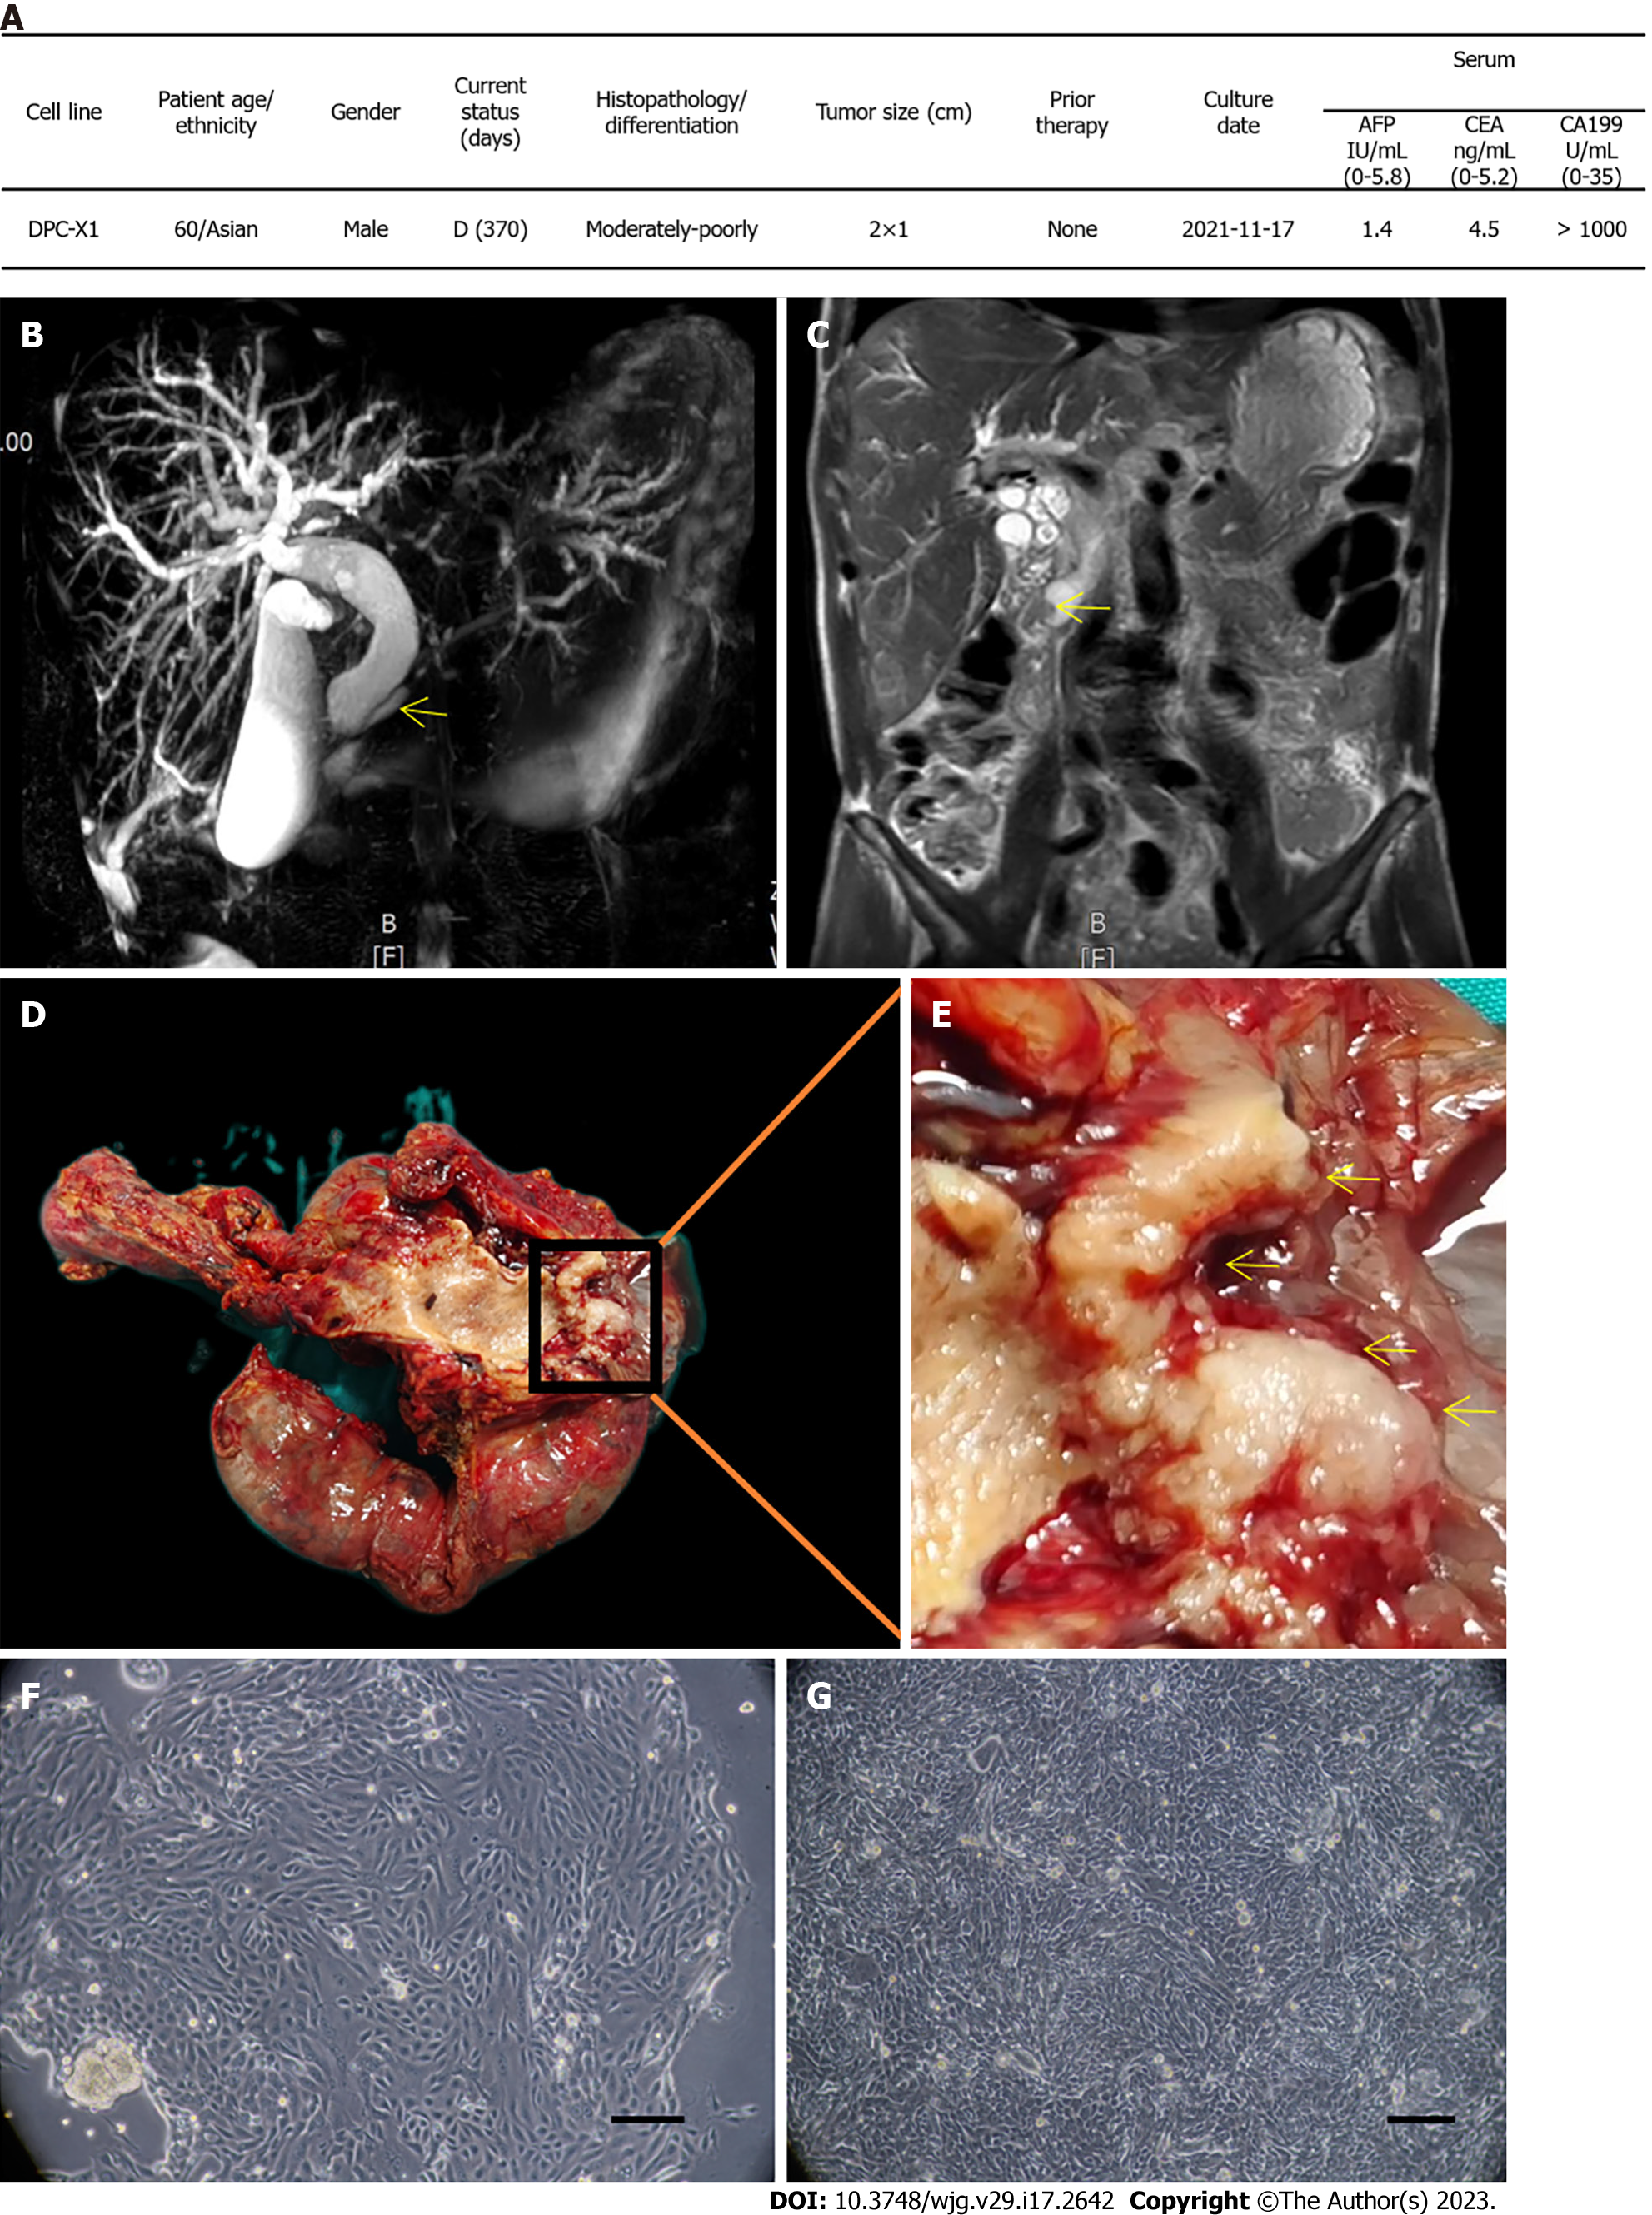
Figure 1 Clinical data and cell morphology.
A: Clinical data of the patient; B: Magnetic resonance cholangiopancreatography shows the expansion of intrahepatic and extrahepatic bile ducts, gallbladder enlargement, and pancreatic duct expansion (arrow); C: In the coronal view of magnetic resonance imaging, soft tissue shadow (arrow) can be seen in the ampulla, and the upper bile duct is dilated; D: General view of the surgical specimen; E: The enlarged appearance of the ampulla tumor shows the gray-white tumor growing around the ampulla (arrow); F: DPC-X1 primary cell morphology; multinucleated cells and megakaryocytes can be seen; G: DPC-X1 cell morphology of the 80th generation. Scale bars: 100 μm. D: Death; AFP: alpha-fetoprotein; CEA: Carcinoembryonic antigen; CA199: Carbohydrate antigen 199.
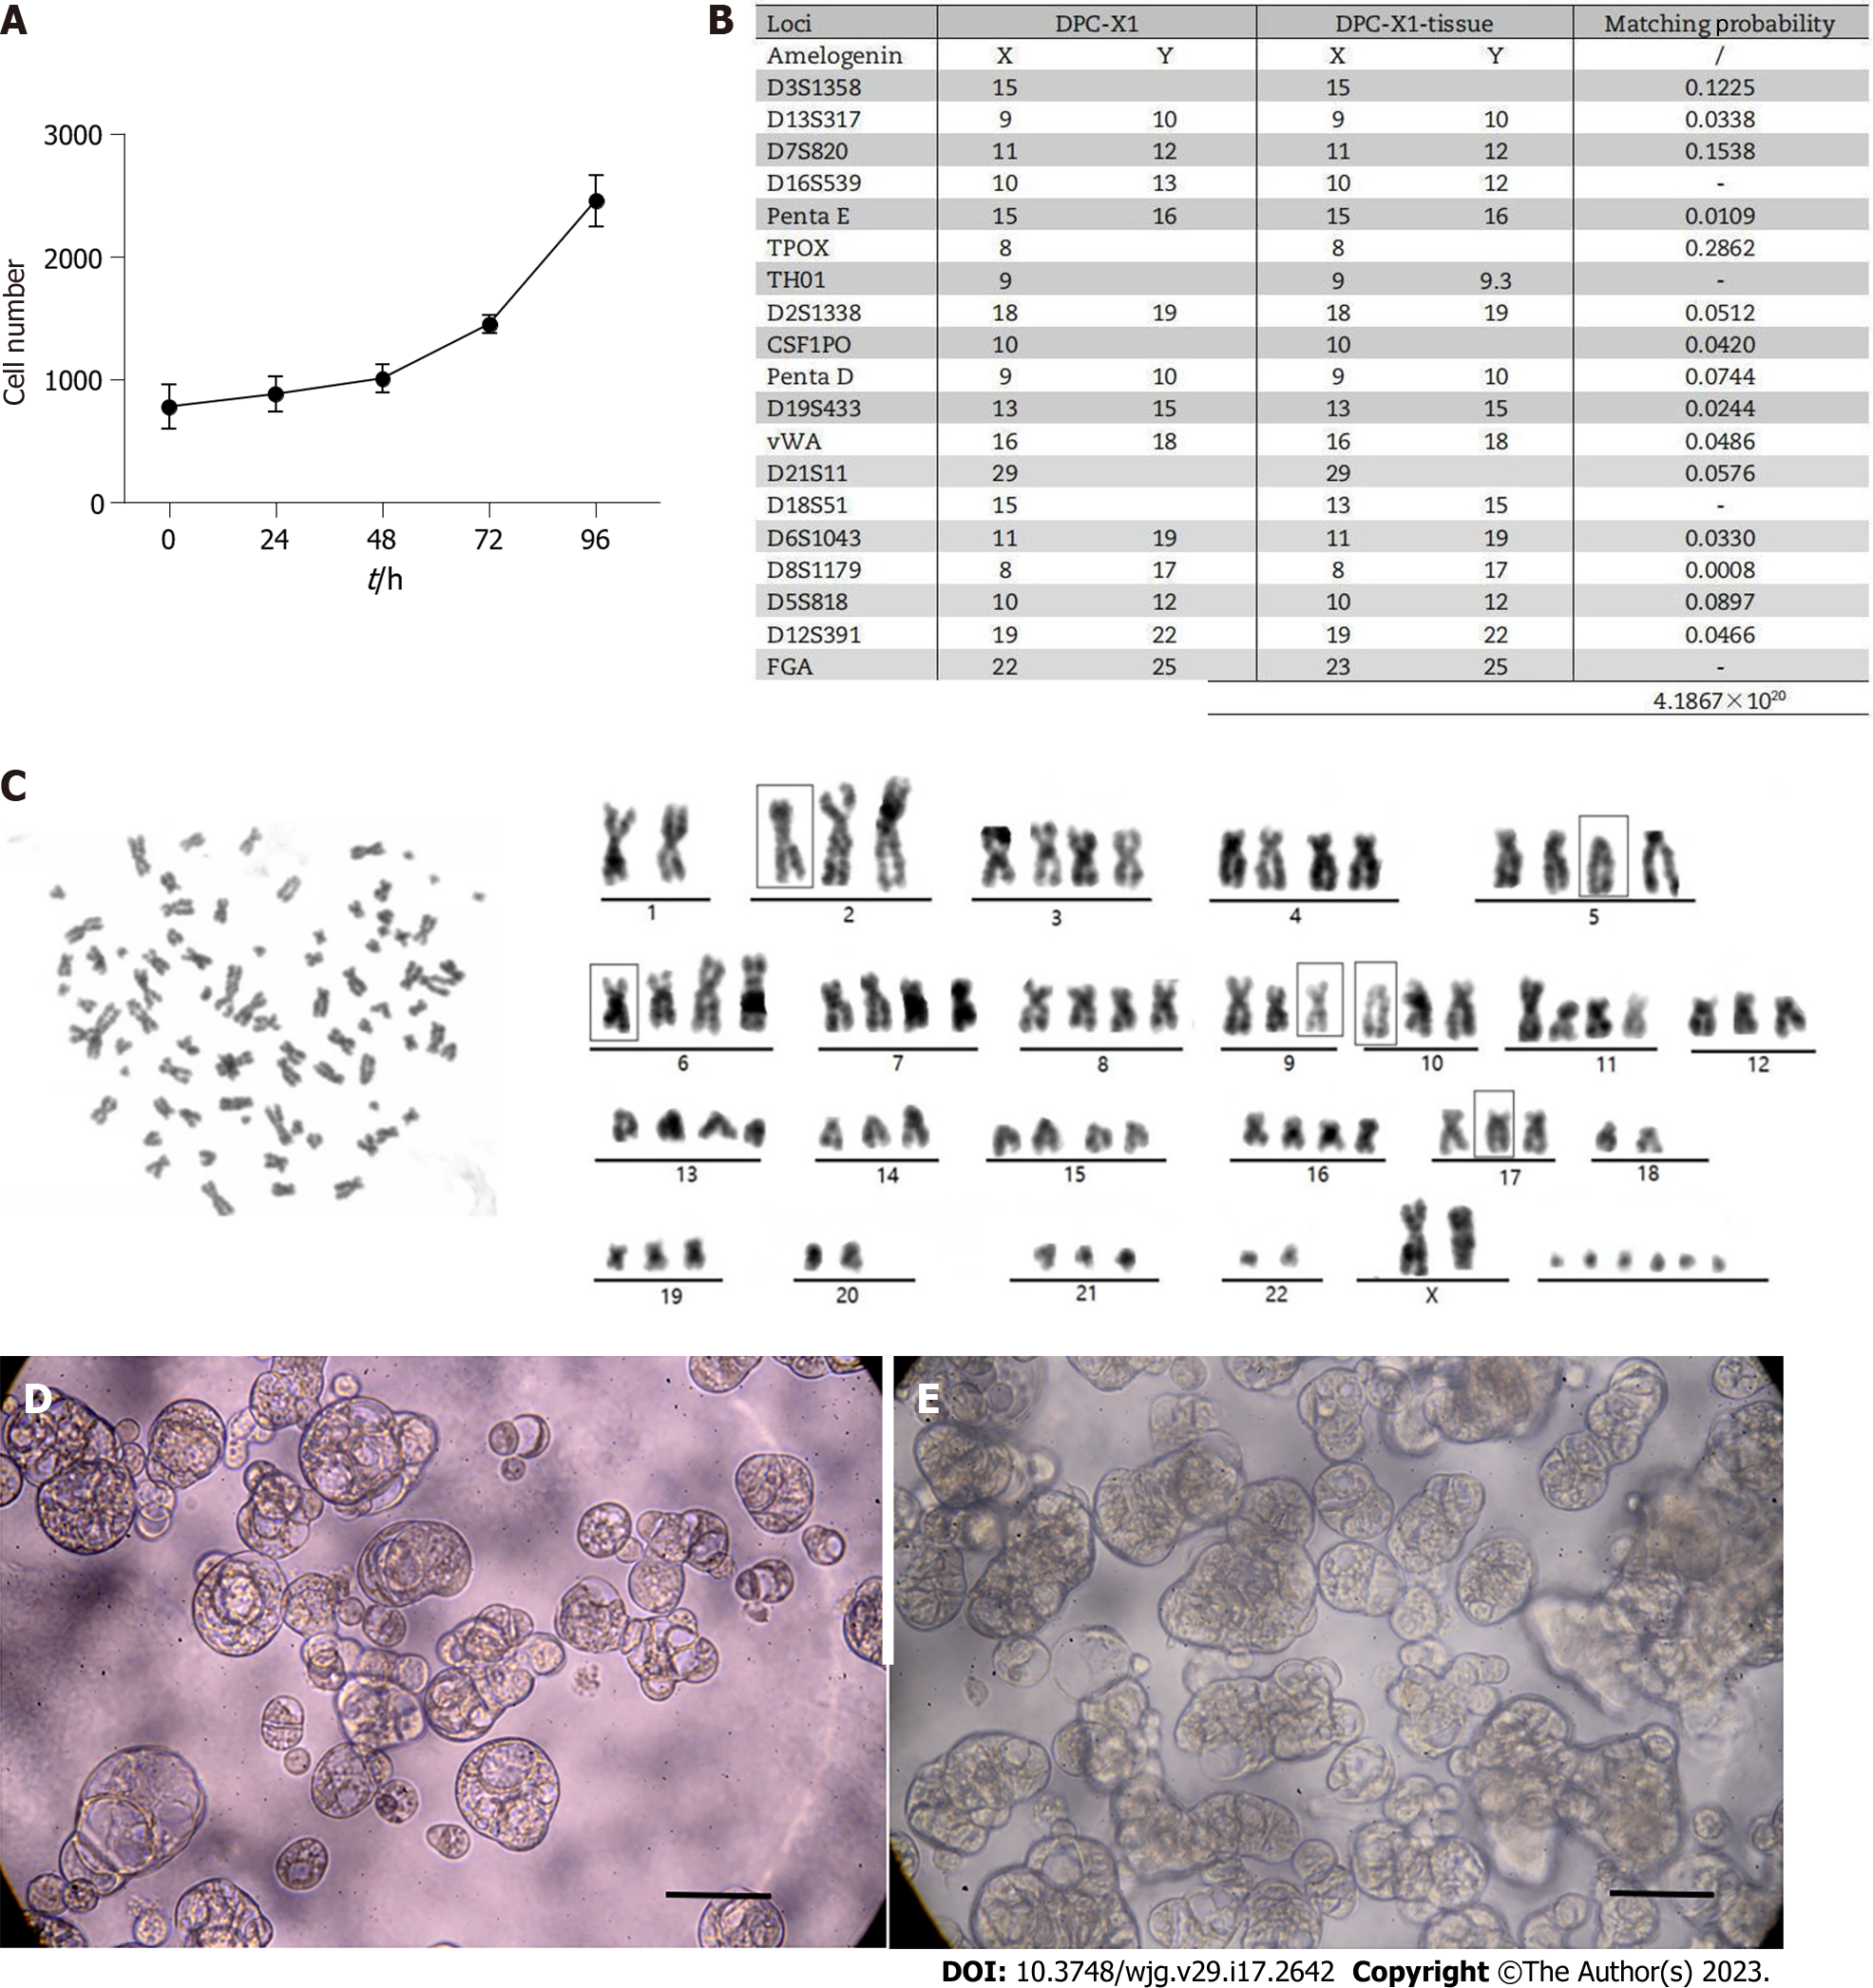
Figure 2 DPC-X1 population doubling time, short tandem repeat detection, karyotype analysis and Organoid culture.
A: DPC-X1 growth curve; cell doubling time is 48 h; B: The likelihood ratio between the short tandem repeat results of DPC-X1 and the primary tumor tissue is 4.1867 × 10²⁰. The cells are not contaminated by other cell lines; C: Karyotype analysis shows that DPC-X1 cells are mainly sub-tetraploid, with large differences in chromosome number and morphology. The representative karyotype is 80, XX del (2) (q32) del (5) (p12) del (6) (q24) inv (9) del (10) p (13) del (17) p (12); D: Morphology of DPC-X1organoids after one week. The organoids are spherical or cystic in shape; E: Morphology of DPC-X1 organoids after two weeks. The organoids are spore-like or branch-like in shape. Scale bars: 100 μm.
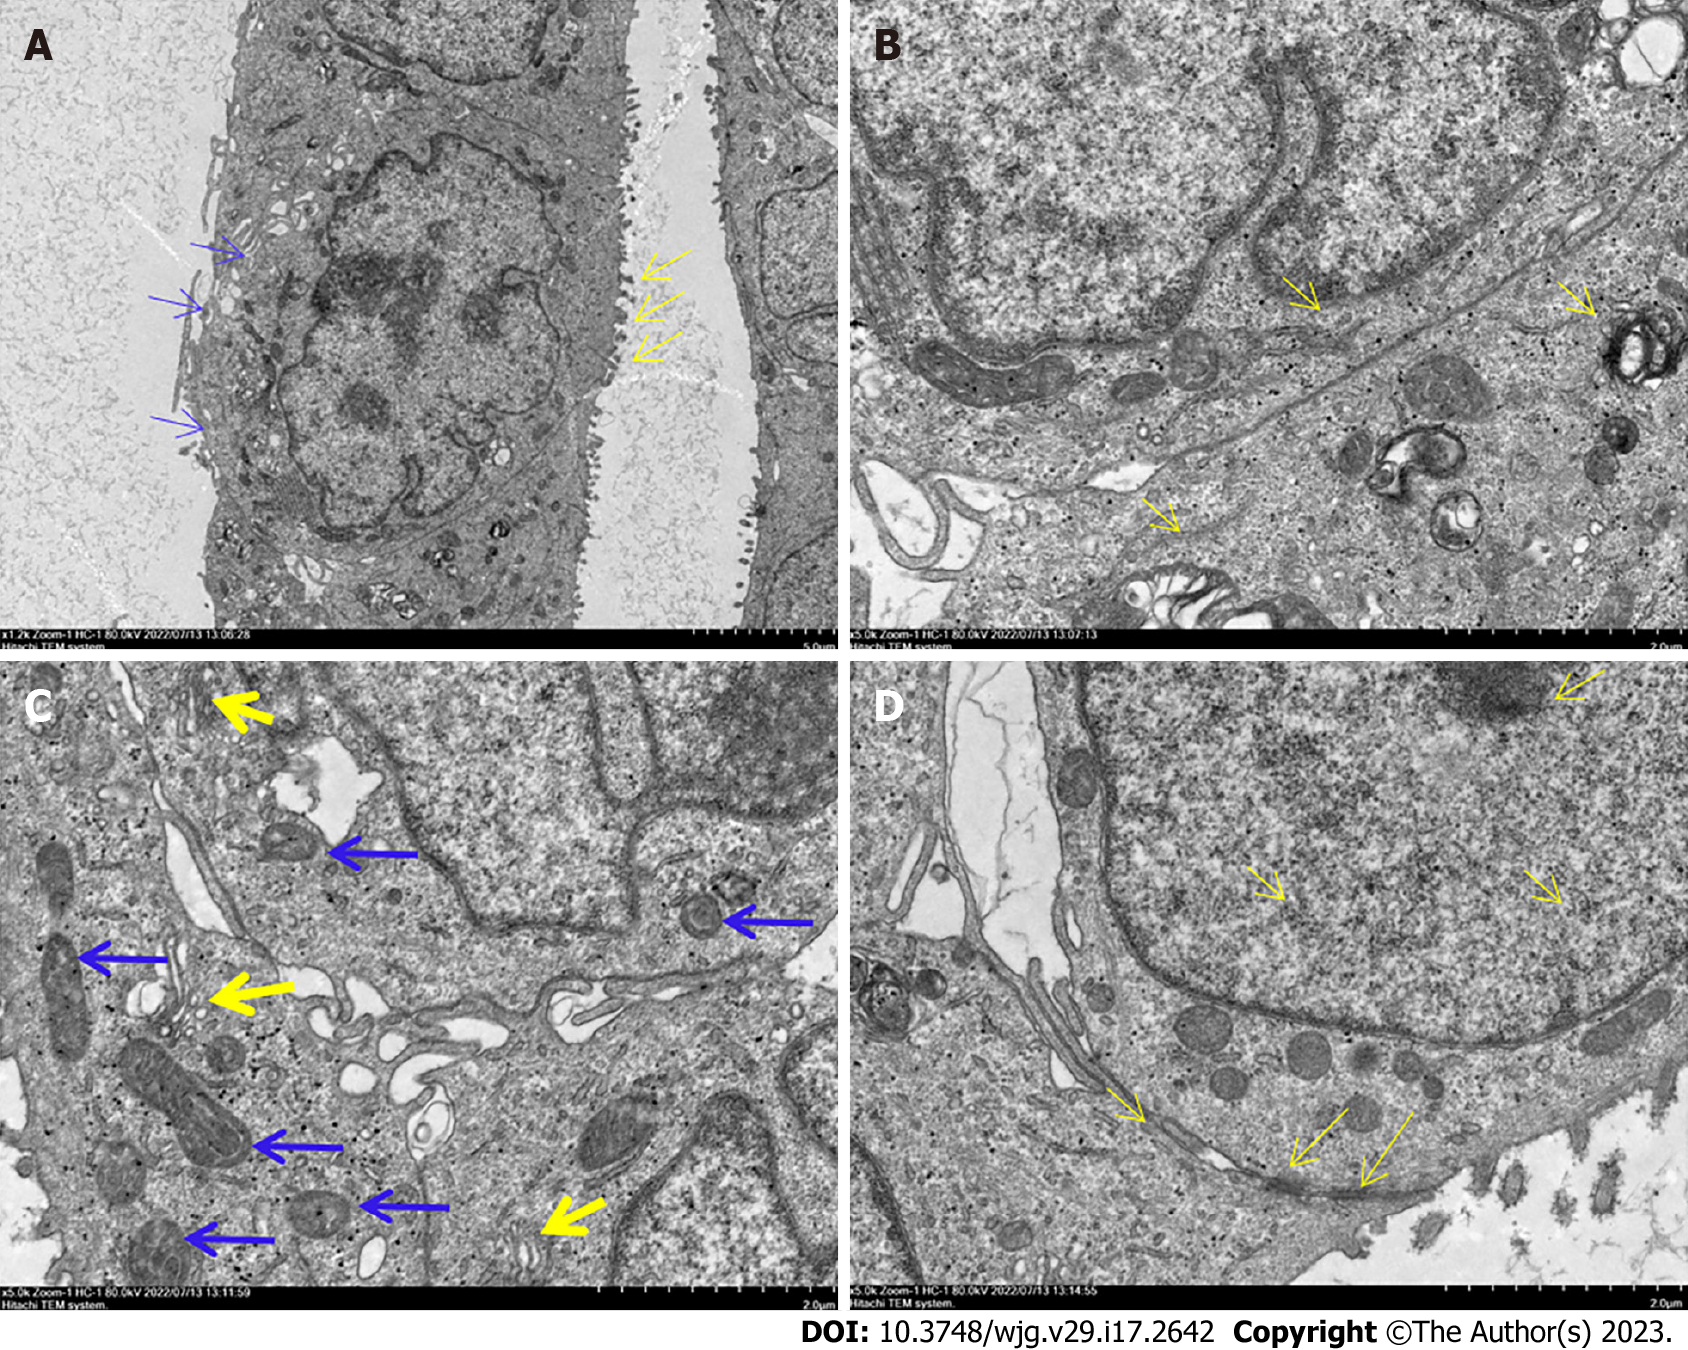
Figure 3 Ultrastructure of DPC-X1 under a transmission electron microscope.
A: DPC-X1 has a large and deformed nucleus; it is increased in number. The nucleolus is clustered in the nuclear membrane. There are fewer cytoplasm. Microvilli (yellow arrow) and pseudopodia (blue arrow) were visible on the cell surface; B: DPC-X1 cells are rich in the endoplasmic reticulum (yellow arrow) and ribosome; C: DPC-X1 cells have well-developed Golgi apparatus (yellow arrow), and the size and shape of the mitochondria are different (blue arrow); D: DPC-X1 desmosome structure can be seen between the cells (arrow).
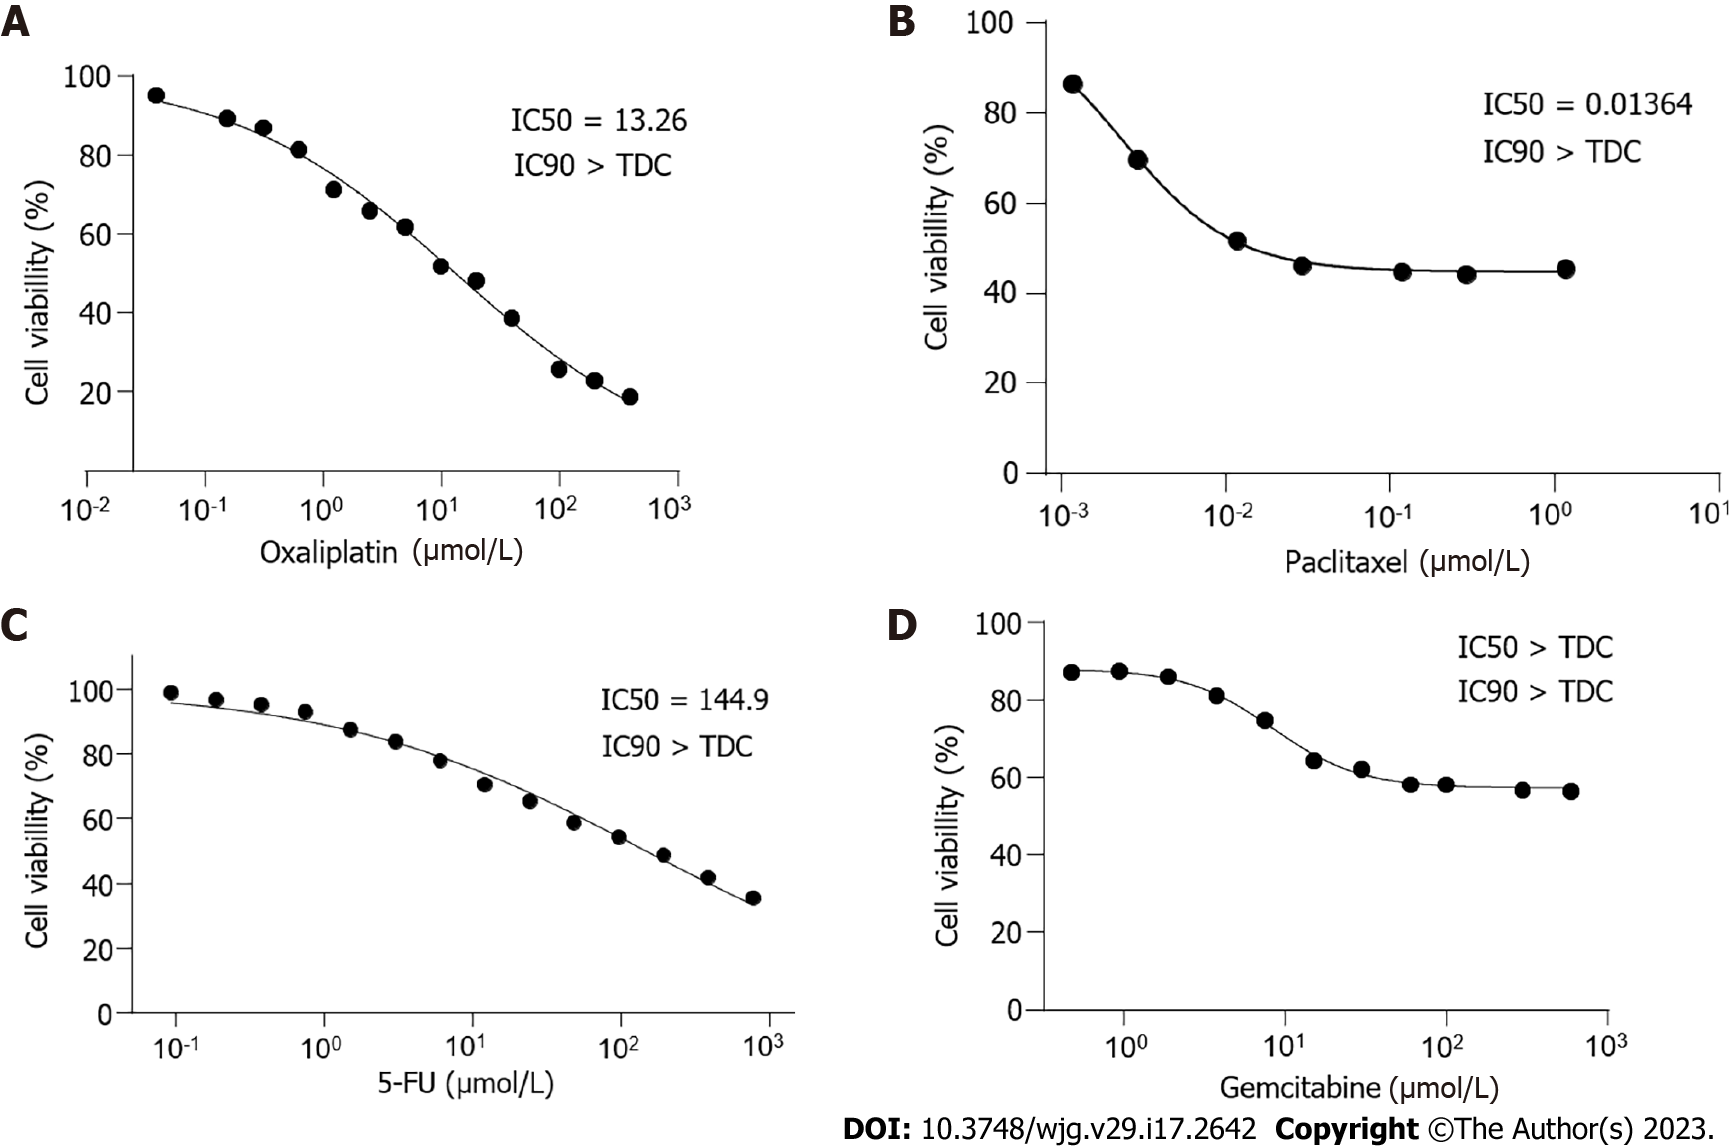
Figure 4 Drug sensitivity test.
A: DPC-X1 is sensitive to oxaliplatin; IC50 = 13.26 μmol/L; B: DPC-X1 is sensitive to paclitaxel; IC50 = 0.014 μmol/L; C: DPC-X1 is resistant to fluorouracil; IC50 = 144.9 µmol/L; D: DPC-X1 is resistant to gemcitabine; IC50 > 600 μmol/L. IC50: Half maximal inhibitory concentration; TDC: Test drug concentrations.
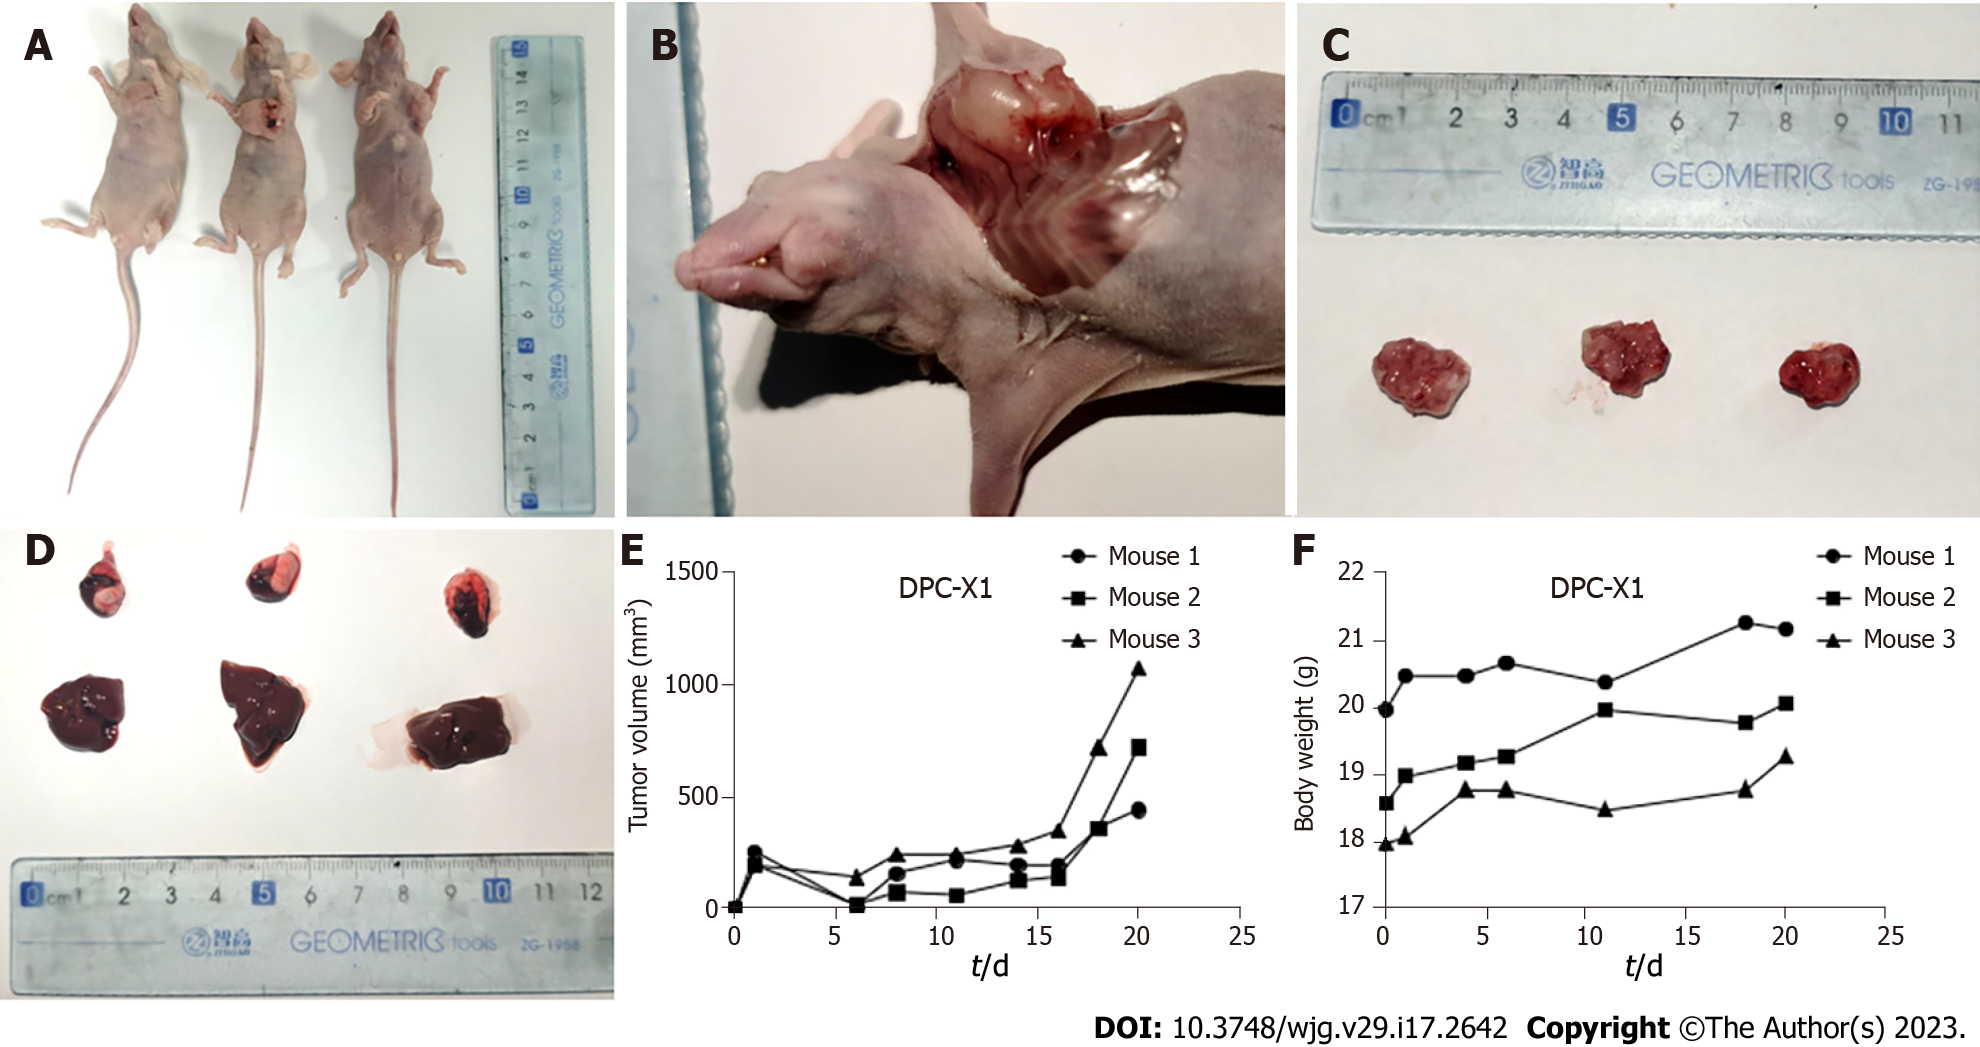
Figure 5 Xenograft tumor formation experiment.
A: In four weeks, DPC-X1 quickly formed xenograft tumors under the skin of BALB/c nude mice. The tumor formation rate is 100%; B: Anatomically, the xenograft tumor and muscle tissue of the mouse shows invasive growth, and new blood vessels can be seen on the surface of the tumor; C: General view of the xenograft tumor; D: No metastatic lesions were found in the lungs and liver of BALB/c nude mice within four weeks; E: Growth curve of DPC-X1 transplanted tumor; F: Body weight curve of BALB/c nude mice.
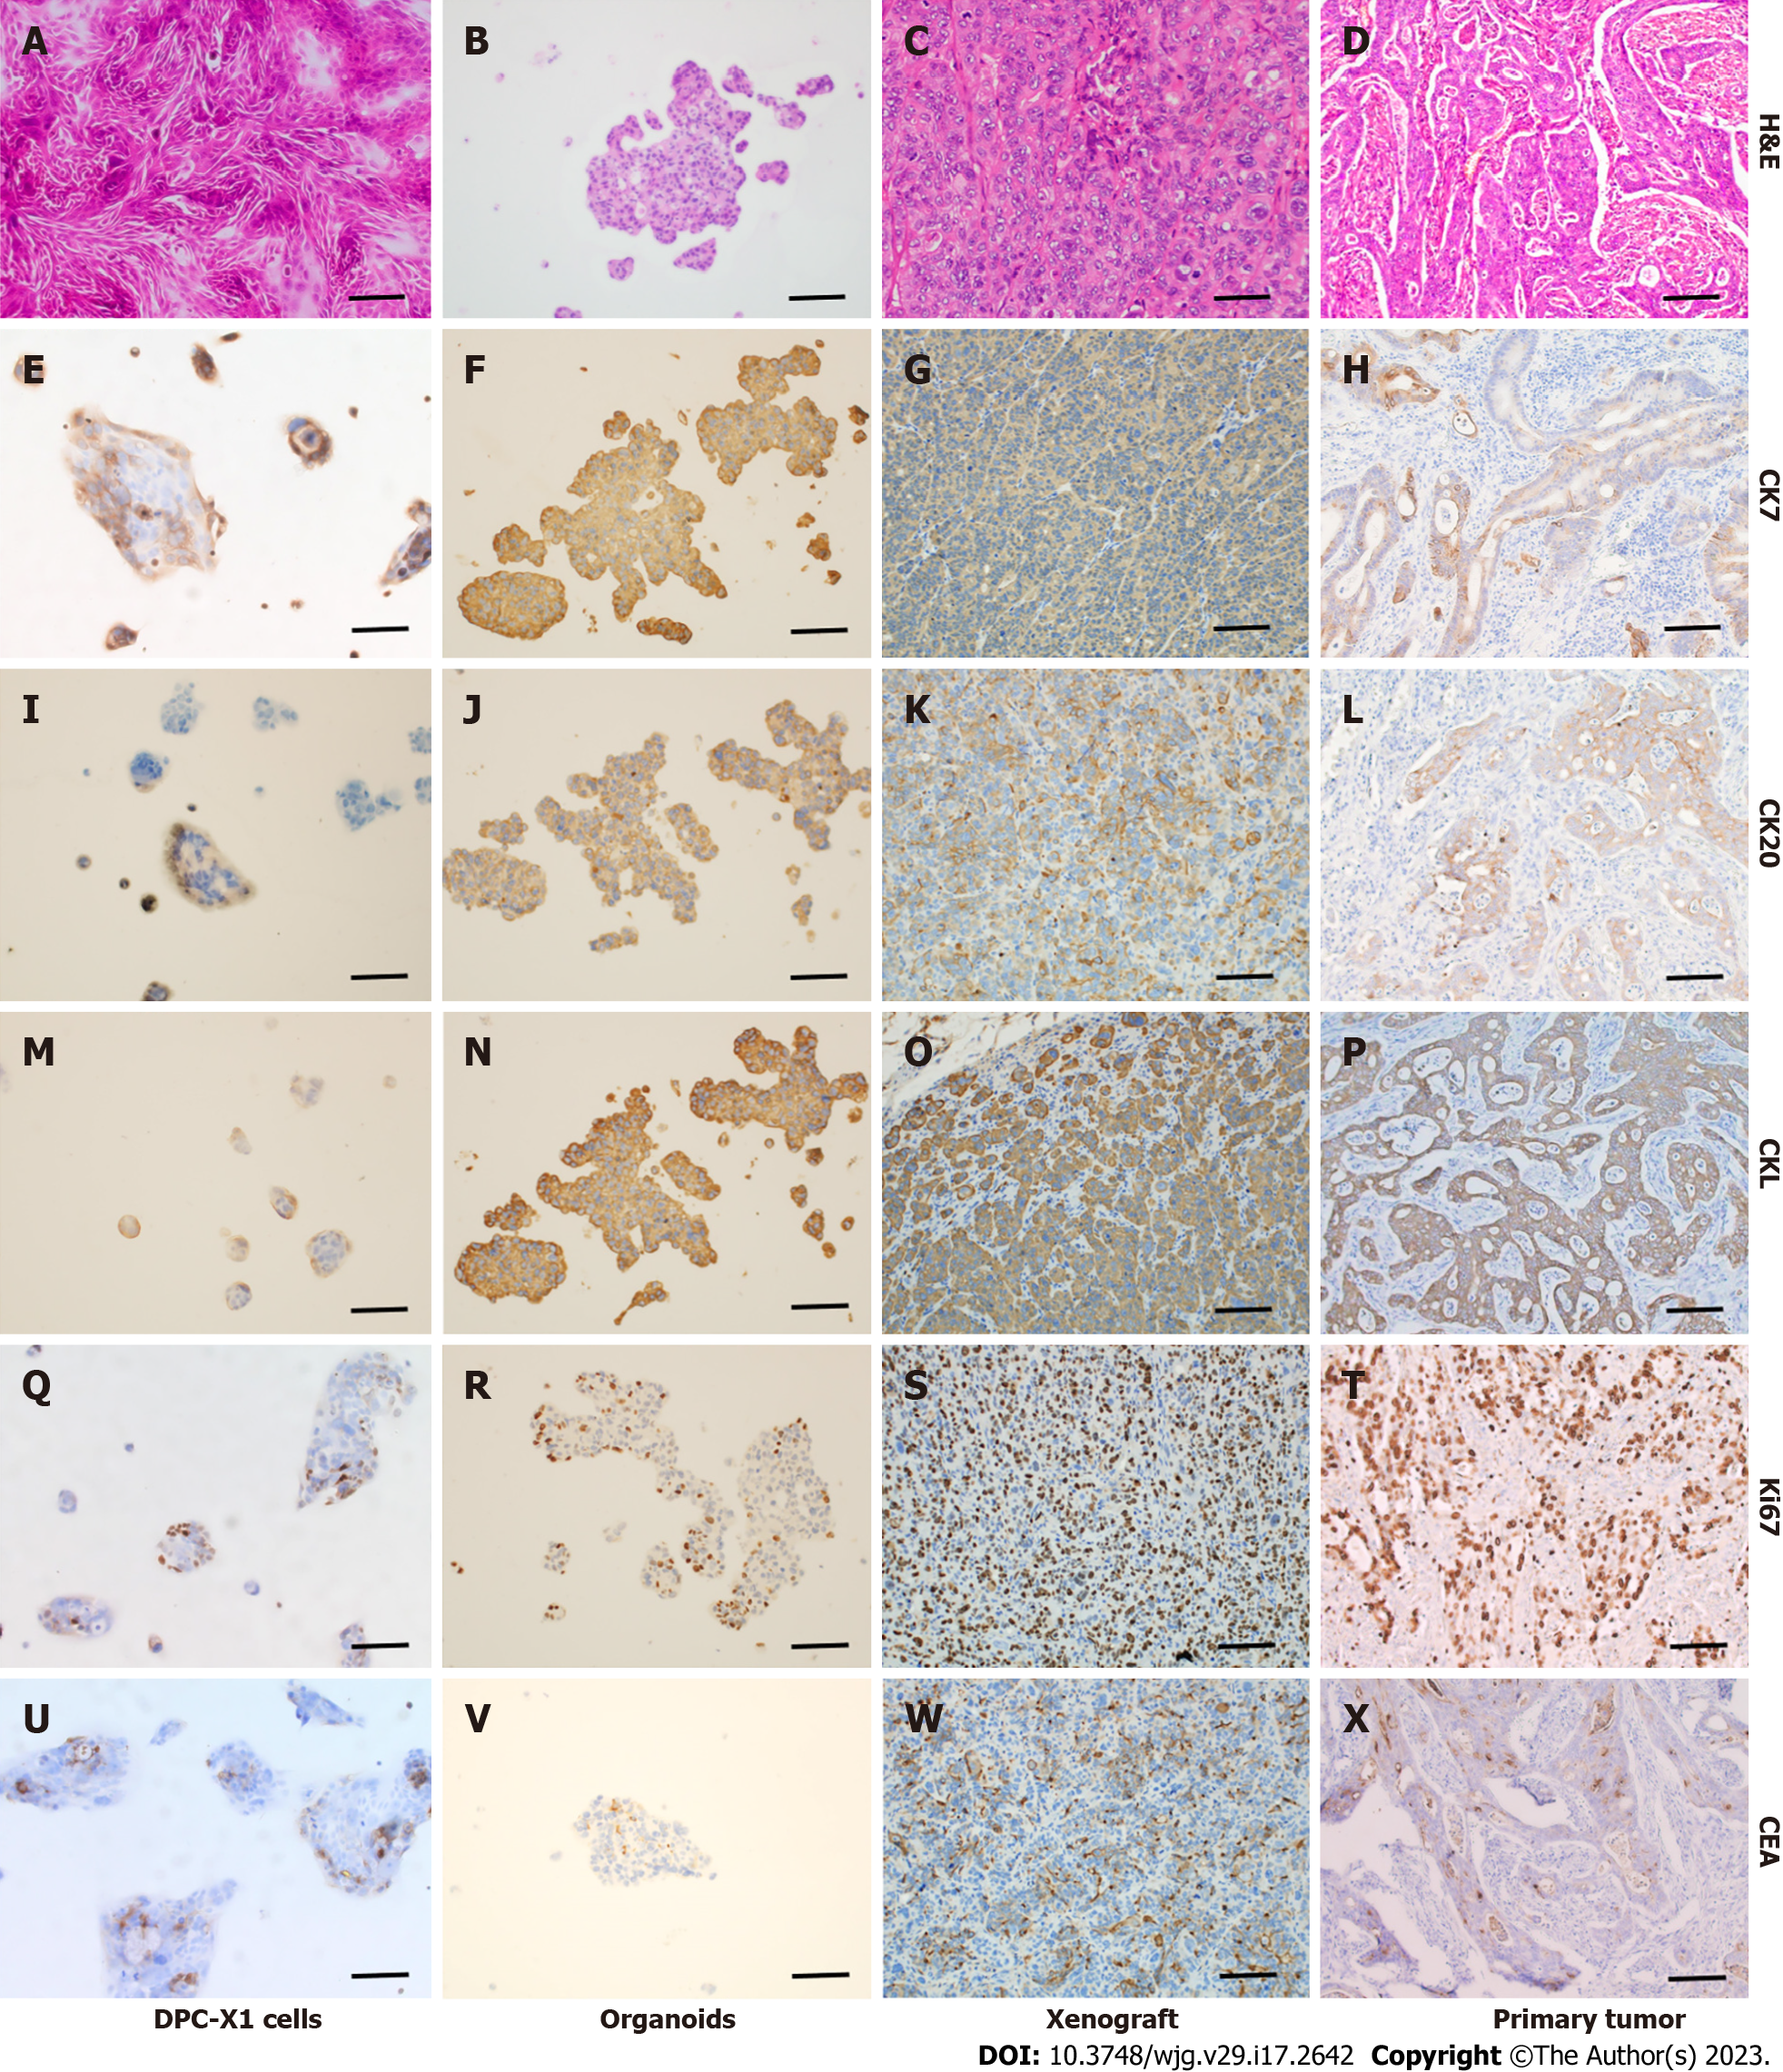
Figure 6 Hematoxylin and eosin and immunohistochemical staining of DPC-X1 cells, organoid, xenograft tumor, and primary tumor.
A-D: Hematoxylin and eosin staining of DPC-X1 cells, organoids, xenograft tumor, and primary tumor; E-H: Strong cytokeratin (CK)7 positive staining of DPC-X1 cells, organoids, xenograft tumor, and primary tumor; I-L: Strong CK20 positive staining of DPC-X1 cells, organoids, xenograft tumor, and primary tumor; M-P: Strong cytokeratin low molecular weight positive staining of DPC-X1 cells, organoids, xenograft tumor, and primary tumor; Q-T: Ki67 staining of DPC-X1 cells, organoids, xenograft tumor, and primary tumor; U-X: Carcinoembryonic antigen focal staining of DPC-X1 cells, organoids, xenograft tumor, and primary tumor. Scale bars: 100 μm. H&E: Hematoxylin and eosin; CK7: Cytokeratin 7; CK20: Cytokeratin 20; CKL: Cytokeratin low molecular weight; CEA: Carcinoembryonic antigen.
- Citation: Xu H, Chai CP, Miao X, Tang H, Hu JJ, Zhang H, Zhou WC. Establishment and characterization of a new human ampullary carcinoma cell line, DPC-X1. World J Gastroenterol 2023; 29(17): 2642-2656
- URL: https://www.wjgnet.com/1007-9327/full/v29/i17/2642.htm
- DOI: https://dx.doi.org/10.3748/wjg.v29.i17.2642


