Copyright
©The Author(s) 2023.
World J Gastroenterol. May 7, 2023; 29(17): 2534-2550
Published online May 7, 2023. doi: 10.3748/wjg.v29.i17.2534
Published online May 7, 2023. doi: 10.3748/wjg.v29.i17.2534
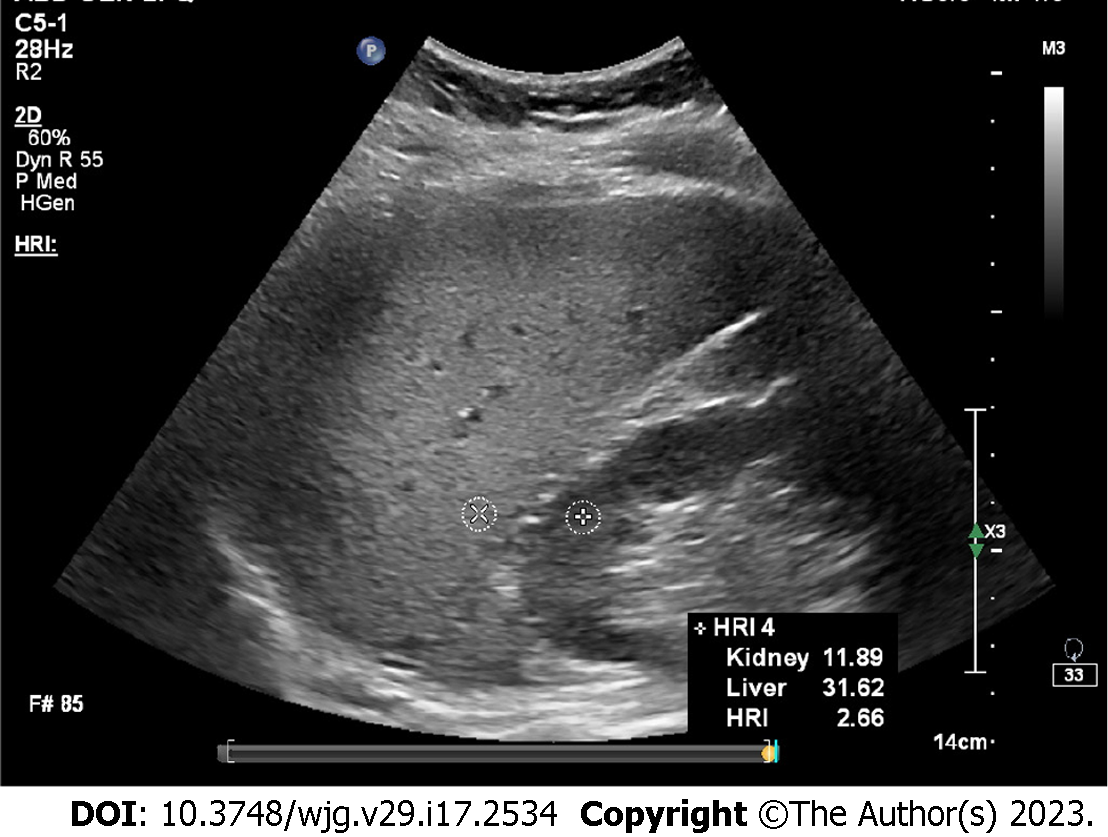
Figure 1 Hepatorenal index.
In this case, the result was 2.66, indicating severe hepatic steatosis.
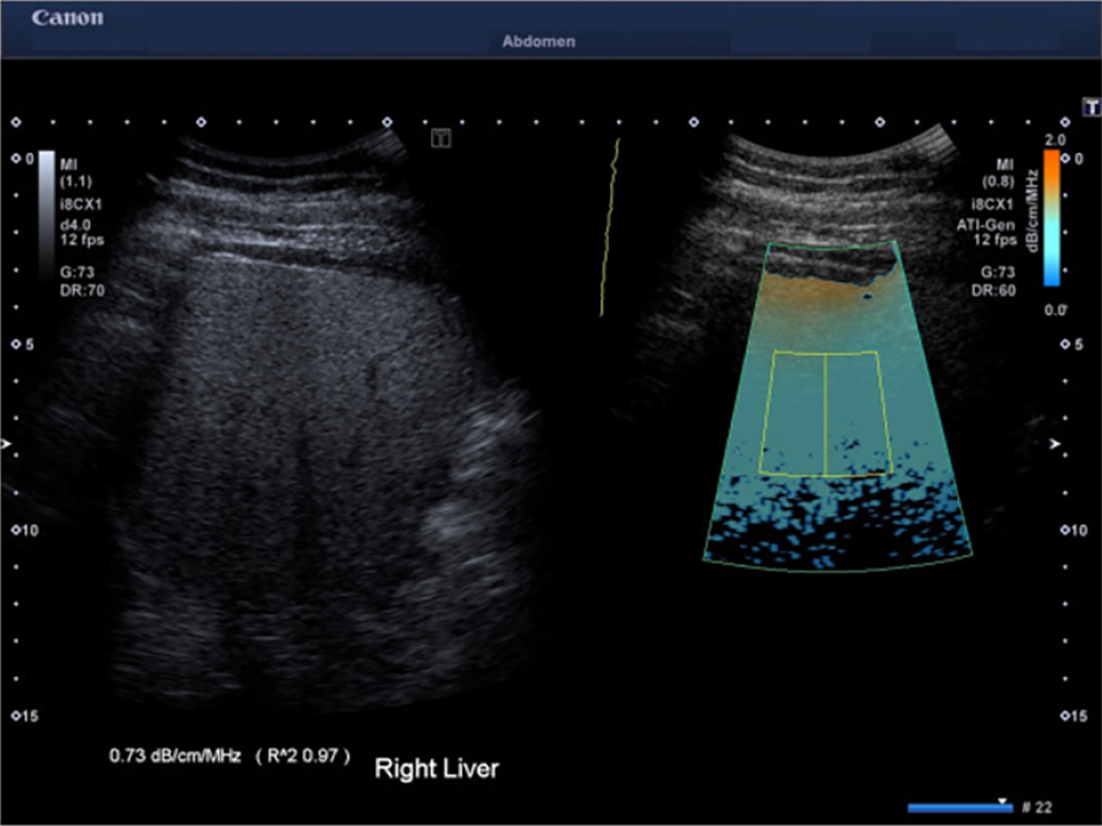
Figure 2 Attenuation imaging technique by Canon with reliability indicator (R2)[40].
The Gray scale image and the corresponding attenuation imaging image are shown side by side. The attenuation coefficient measurement of the images shown here is 0.73 dB/cm/MHz with an R2 of 0.97, indicating a valid measurement. Citation: Seneviratne N, Fang C, Sidhu PS. Ultrasound-based hepatic fat quantification: current status and future directions. Clin Radiol 2023; 78: 187-200. Copyright© The Author(s) 2023. Published by Elsevier Ltd. The authors have obtained the permission for figure using (Supplementary material).
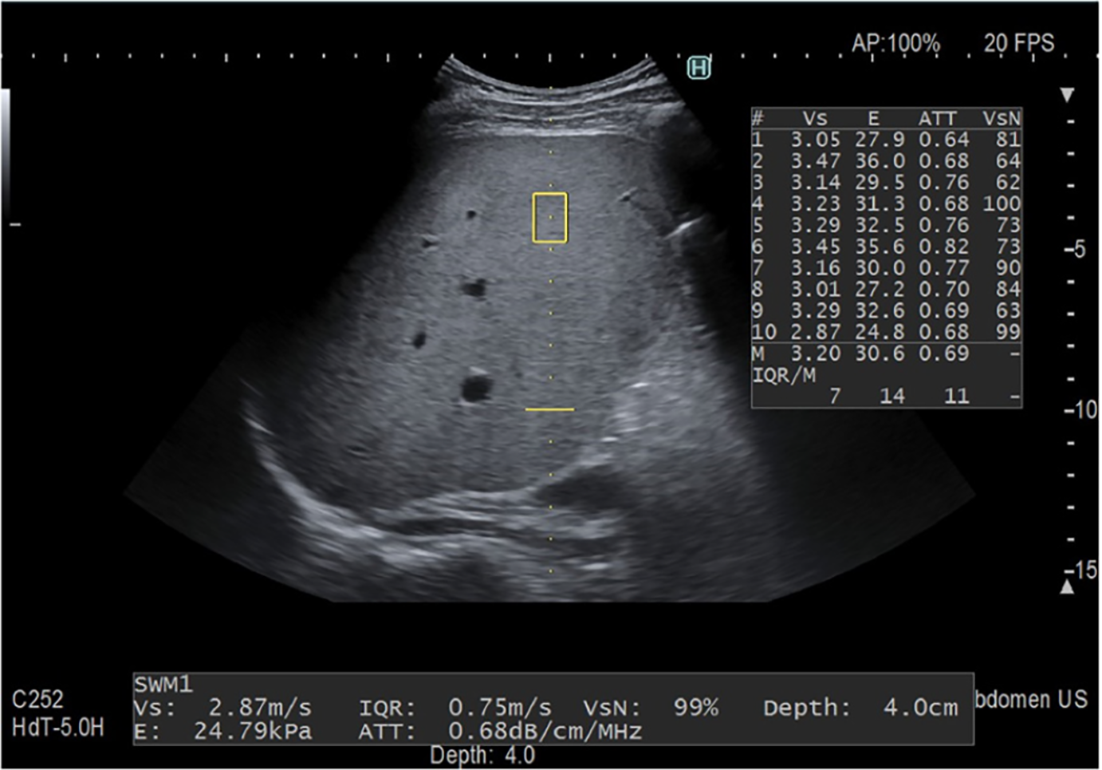
Figure 3 The attenuation measurement function technique was developed by Fujifilm Health Care company[4].
The attenuation coefficient (0.68 dB/cm/MHz) is measured in a fixed area (yellow box) along the same axis as the liver stiffness measurement. Ten acquisitions are performed, and the median value is utilized as the final metric. Citation: Ferraioli G, Berzigotti A, Barr RG, Choi BI, Cui XW, Dong Y, Gilja OH, Lee JY, Lee DH, Moriyasu F, Piscaglia F, Sugimoto K, Wong GL, Wong VW, Dietrich CF. Quantification of Liver Fat Content with Ultrasound: A WFUMB Position Paper. Ultrasound Med Biol 2021; 47: 2803-2820. Copyright© The Author(s) 2021. Published by Elsevier Ltd. The authors have obtained the permission for figure using (Supplementary material).
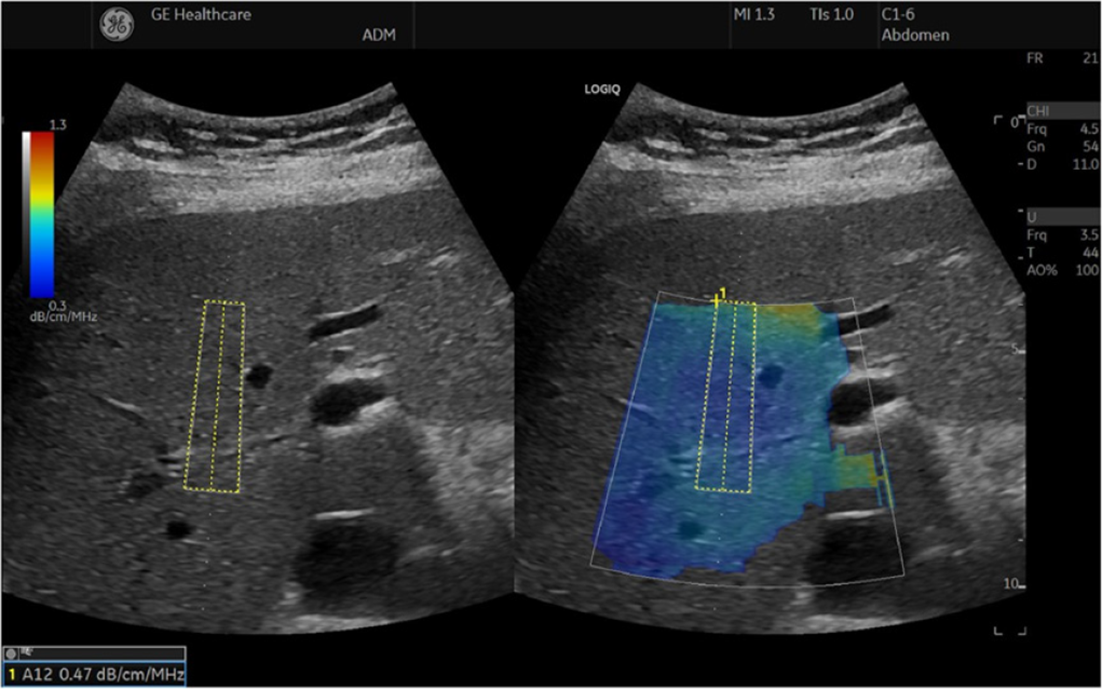
Figure 4 The ultrasound-guided attenuation parameter method implemented in the LOGIQ E9 XDclear 2.
0 US scanner[4]. The attenuation coefficient is 0.47 dB/cm/MHz, indicating less than 5% steatosis. Citation: Ferraioli G, Berzigotti A, Barr RG, Choi BI, Cui XW, Dong Y, Gilja OH, Lee JY, Lee DH, Moriyasu F, Piscaglia F, Sugimoto K, Wong GL, Wong VW, Dietrich CF. Quantification of Liver Fat Content with Ultrasound: A WFUMB Position Paper. Ultrasound Med Biol 2021; 47: 2803-2820. Copyright© The Author(s) 2021. Published by Elsevier Ltd. The authors have obtained the permission for figure using (Supplementary material).
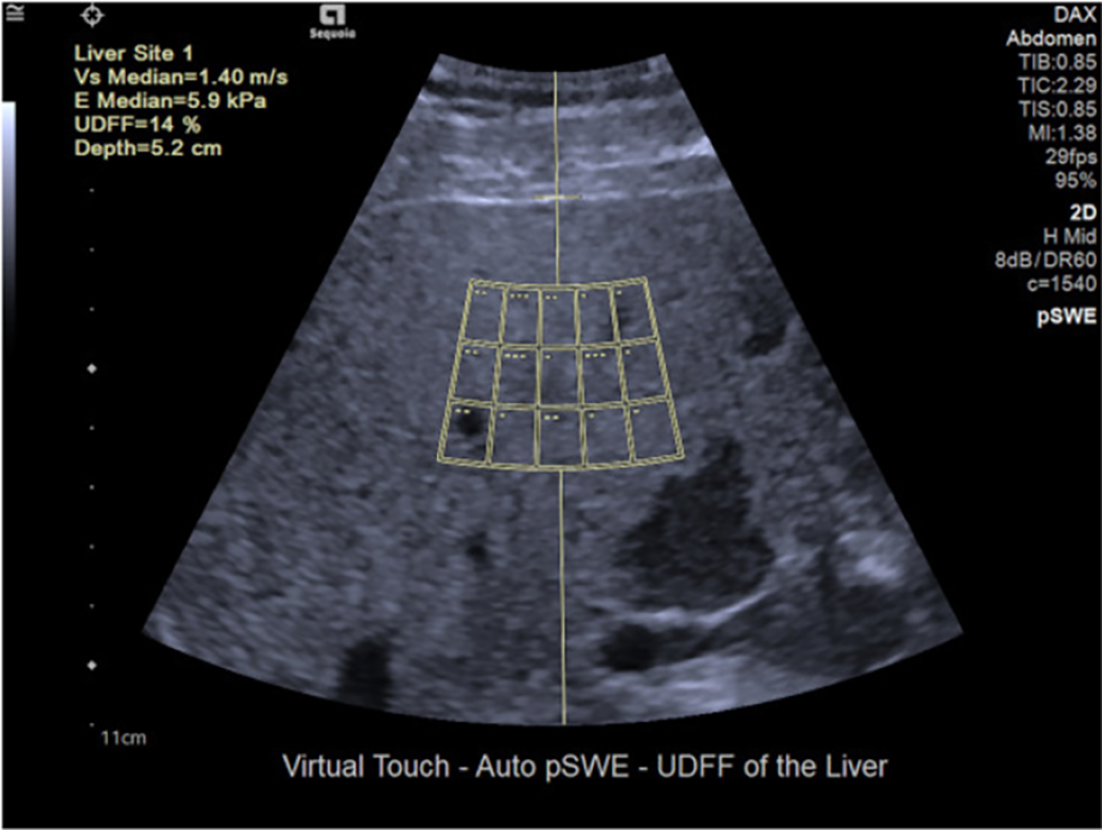
Figure 5 Ultrasound-derived fat fraction method[40].
The ultrasound-derived fat fraction method approximates the magnetic resonance imaging-derived proton density fat fraction and is based on the combination of the attenuation and backscatter coefficient. The method provides both liver stiffness measurement (5.9 kPa in this case) and the percentage of fat accumulation (14% in this case). Citation: Seneviratne N, Fang C, Sidhu PS. Ultrasound-based hepatic fat quantification: current status and future directions. Clin Radiol 2023; 78: 187-200. Copyright© The Author(s) 2023. Published by Elsevier Ltd. The authors have obtained the permission for figure using (Supplementary material).
- Citation: Zeng KY, Bao WYG, Wang YH, Liao M, Yang J, Huang JY, Lu Q. Non-invasive evaluation of liver steatosis with imaging modalities: New techniques and applications. World J Gastroenterol 2023; 29(17): 2534-2550
- URL: https://www.wjgnet.com/1007-9327/full/v29/i17/2534.htm
- DOI: https://dx.doi.org/10.3748/wjg.v29.i17.2534


