Copyright
©The Author(s) 2023.
World J Gastroenterol. Apr 28, 2023; 29(16): 2479-2494
Published online Apr 28, 2023. doi: 10.3748/wjg.v29.i16.2479
Published online Apr 28, 2023. doi: 10.3748/wjg.v29.i16.2479
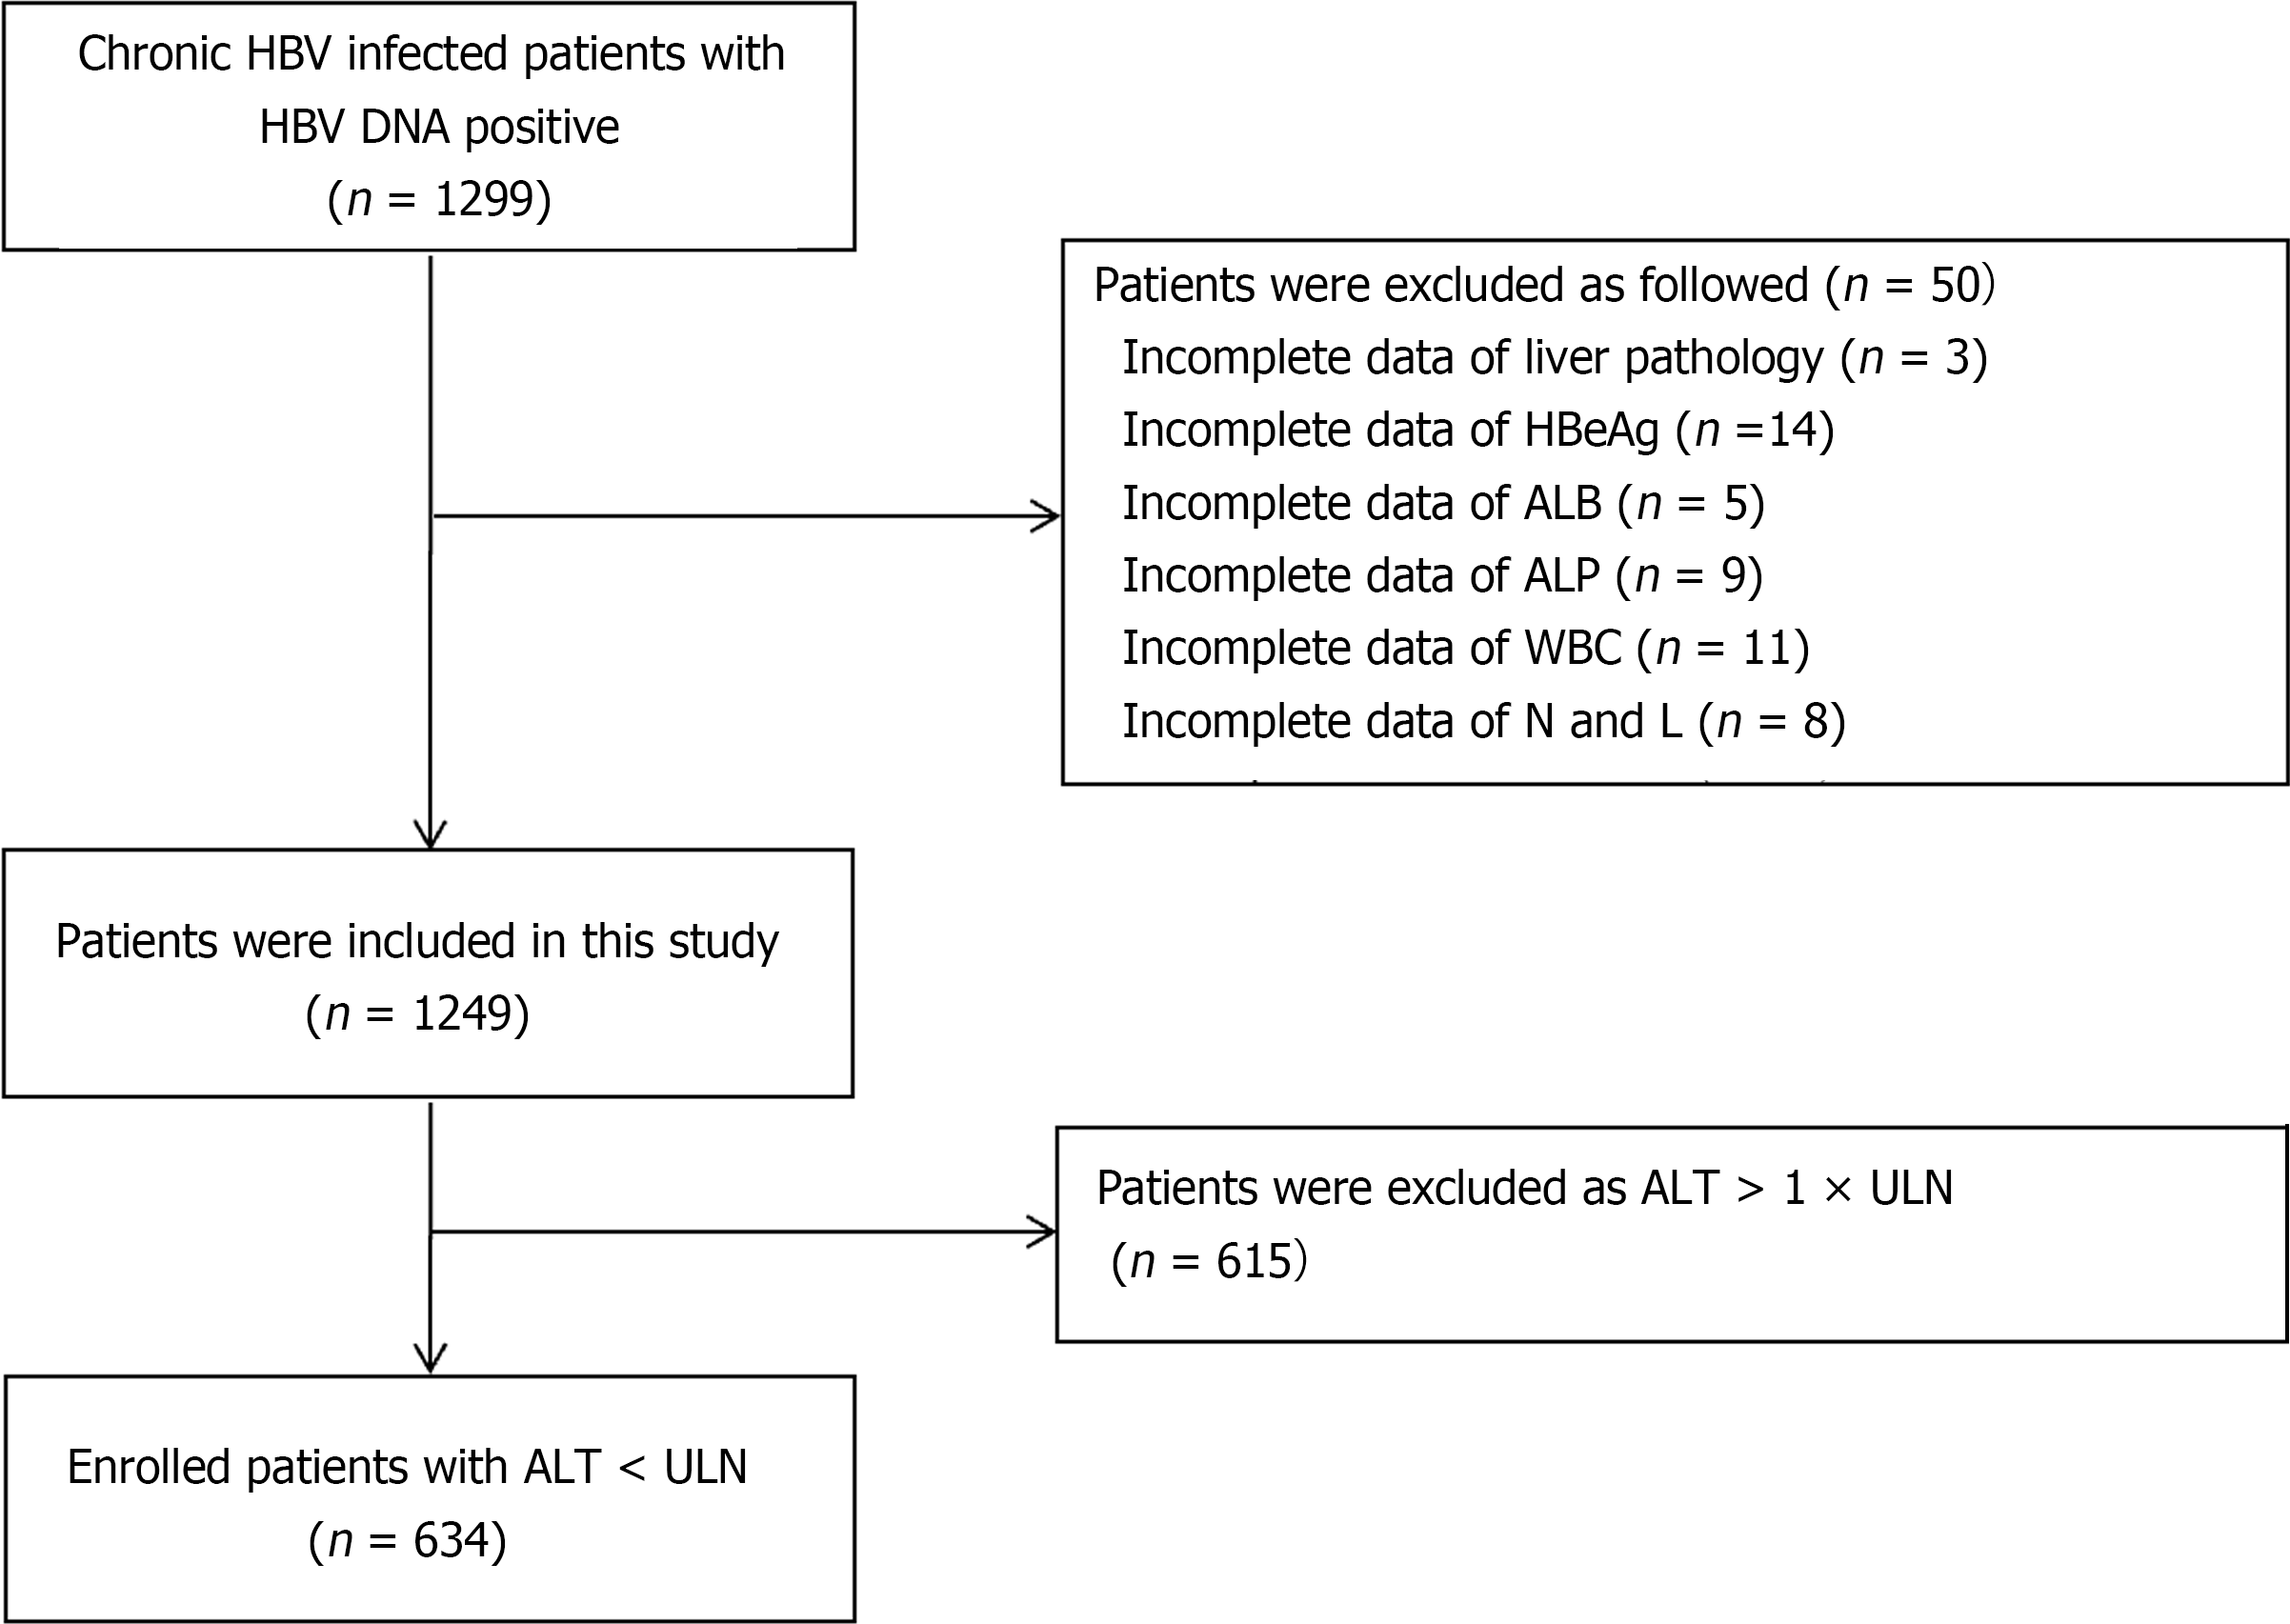
Figure 1 Flow diagram of enrolled patients.
ALB: Albumin; ALP: Alkaline phosphatase; ALT: Alanine aminotransferase; HBeAg: Hepatitis B e antigen; L: Lymphocyte; N: Neutrophils; WBC: White blood cell; HBV: Hepatitis B virus; ULN: Upper limit of normal.
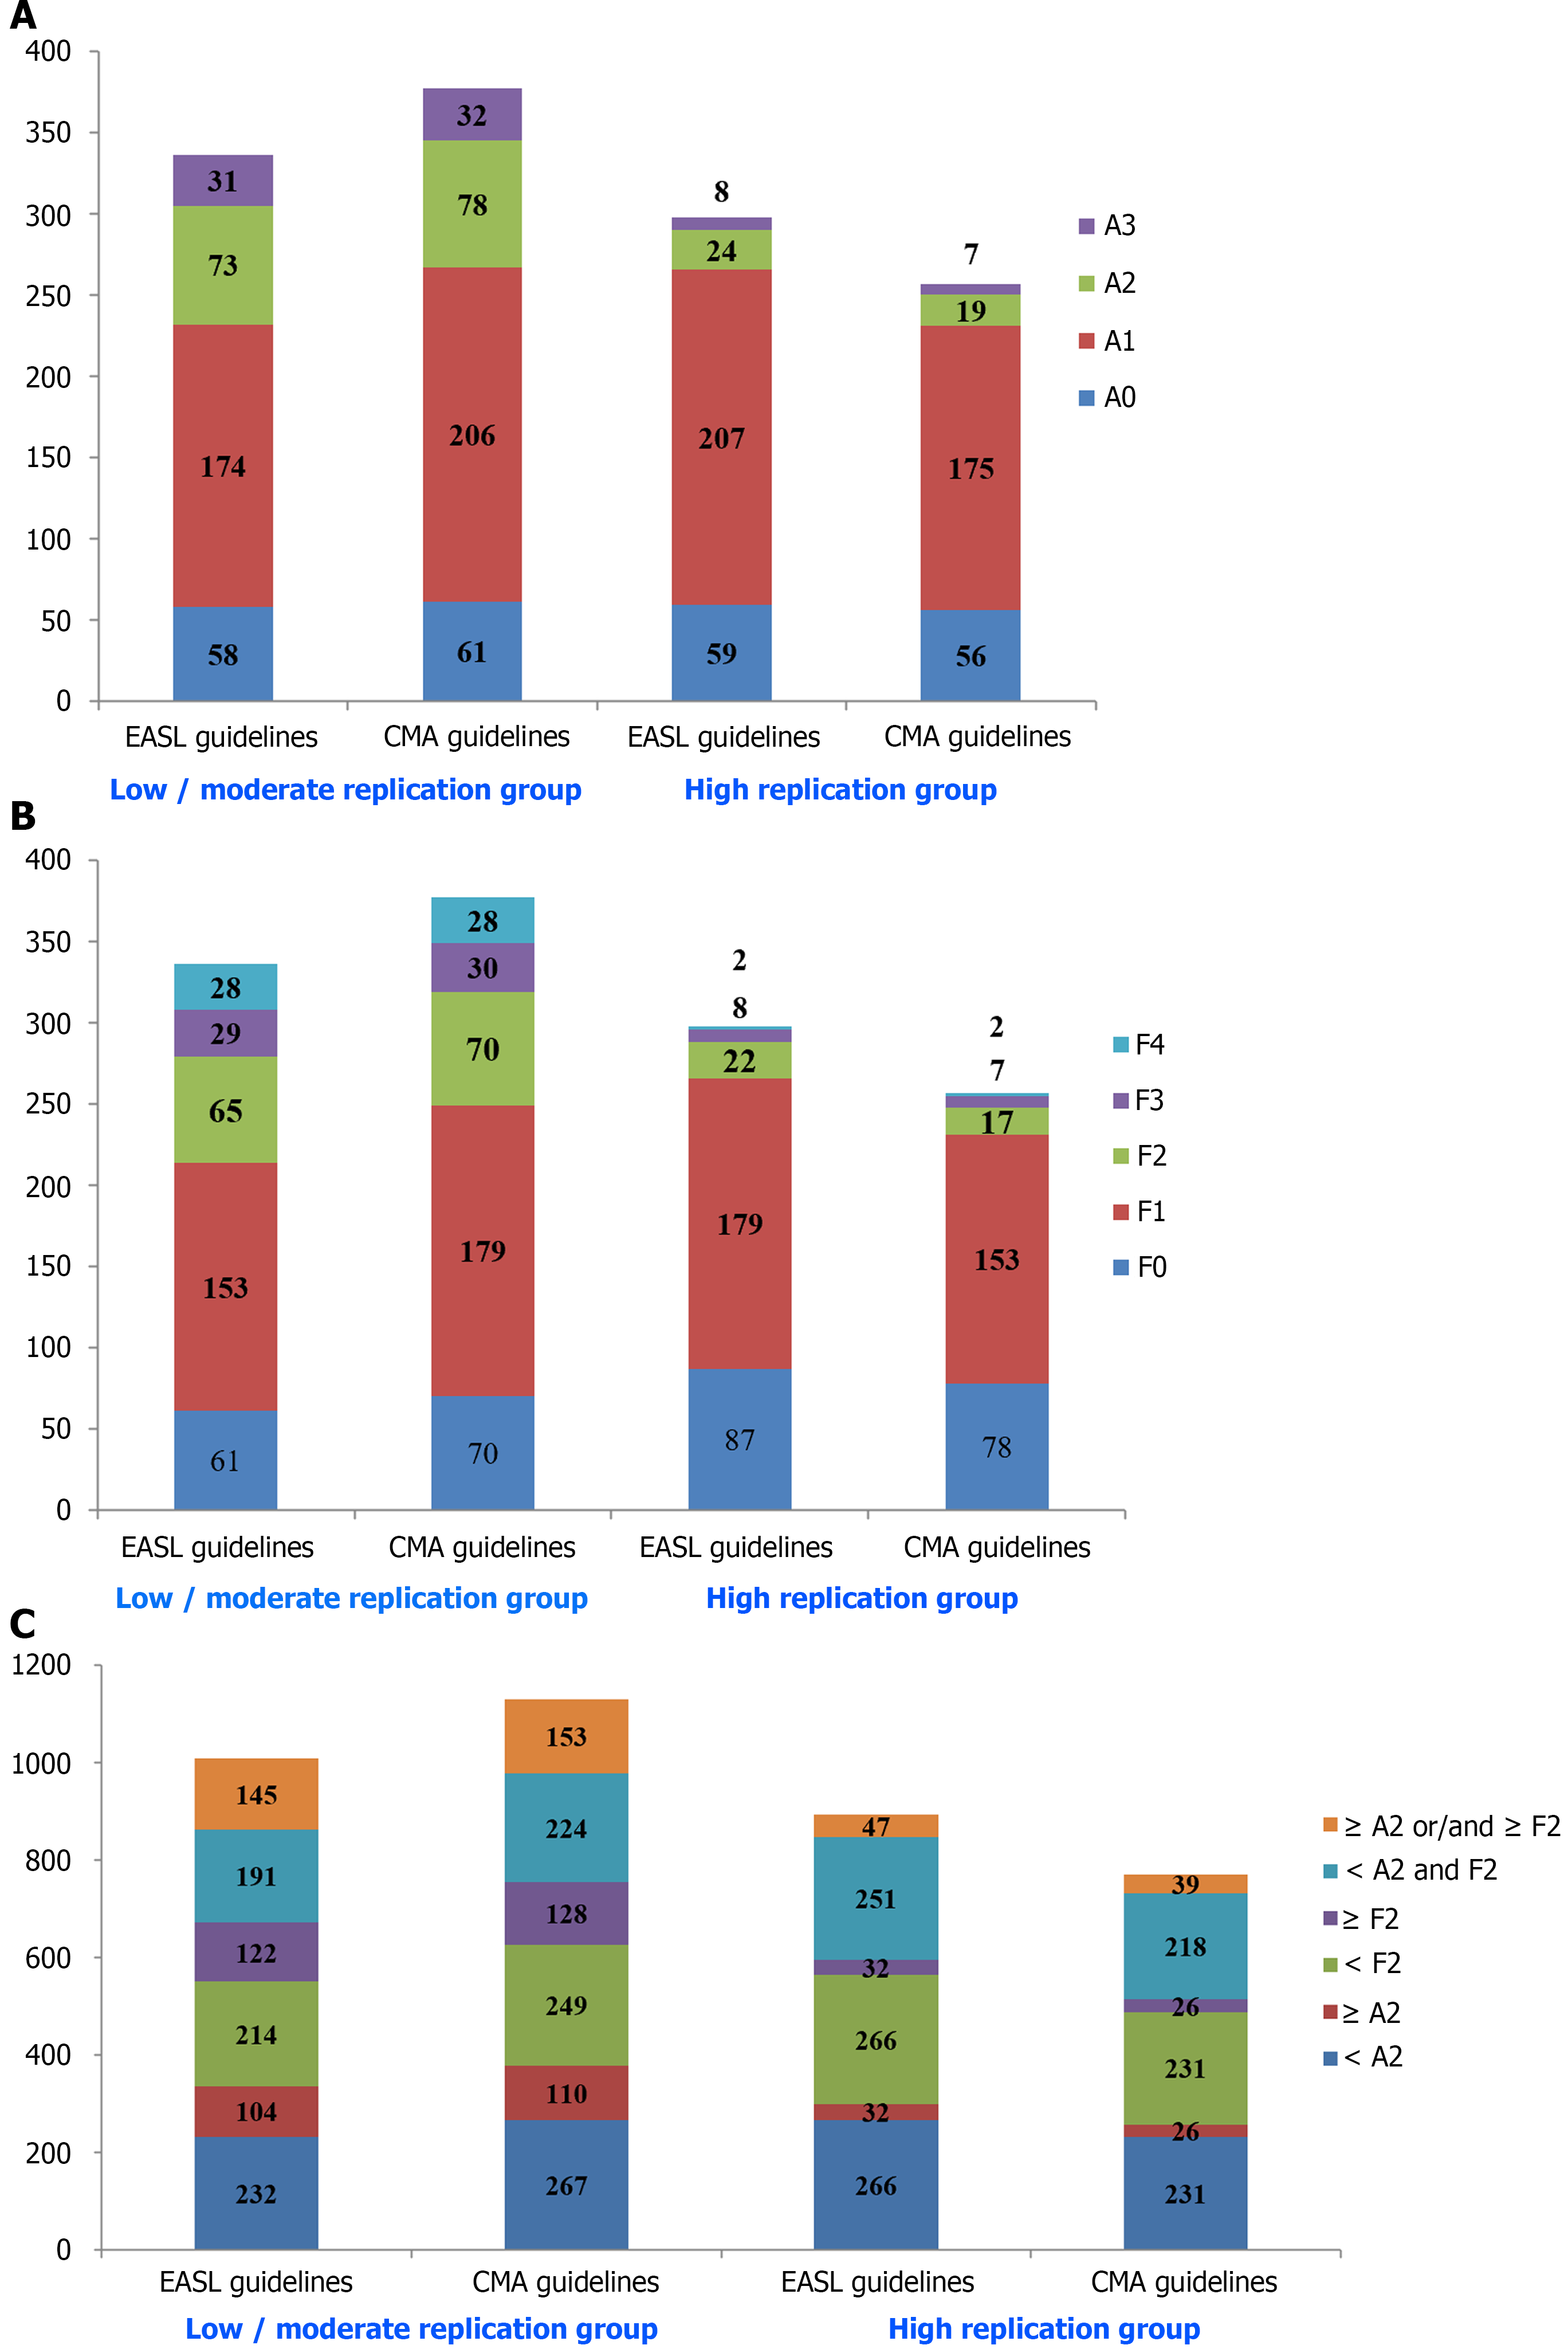
Figure 2 Liver pathological changes among 634 patients with normal alanine transaminase at different hepatitis B virus DNA levels.
A: Necroinflammatory activity grading among patients at different hepatitis B virus (HBV) DNA levels; B: Liver fibrosis staging among patients at different HBV DNA levels; C: Liver histopathological severity ≥ A2 or/and ≥ F2 among patients at different HBV DNA levels. A: Liver inflammatory activity; F: Liver fibrosis; CMA: Chinese Medical Association; EASL: European Association for the Study of the Liver.
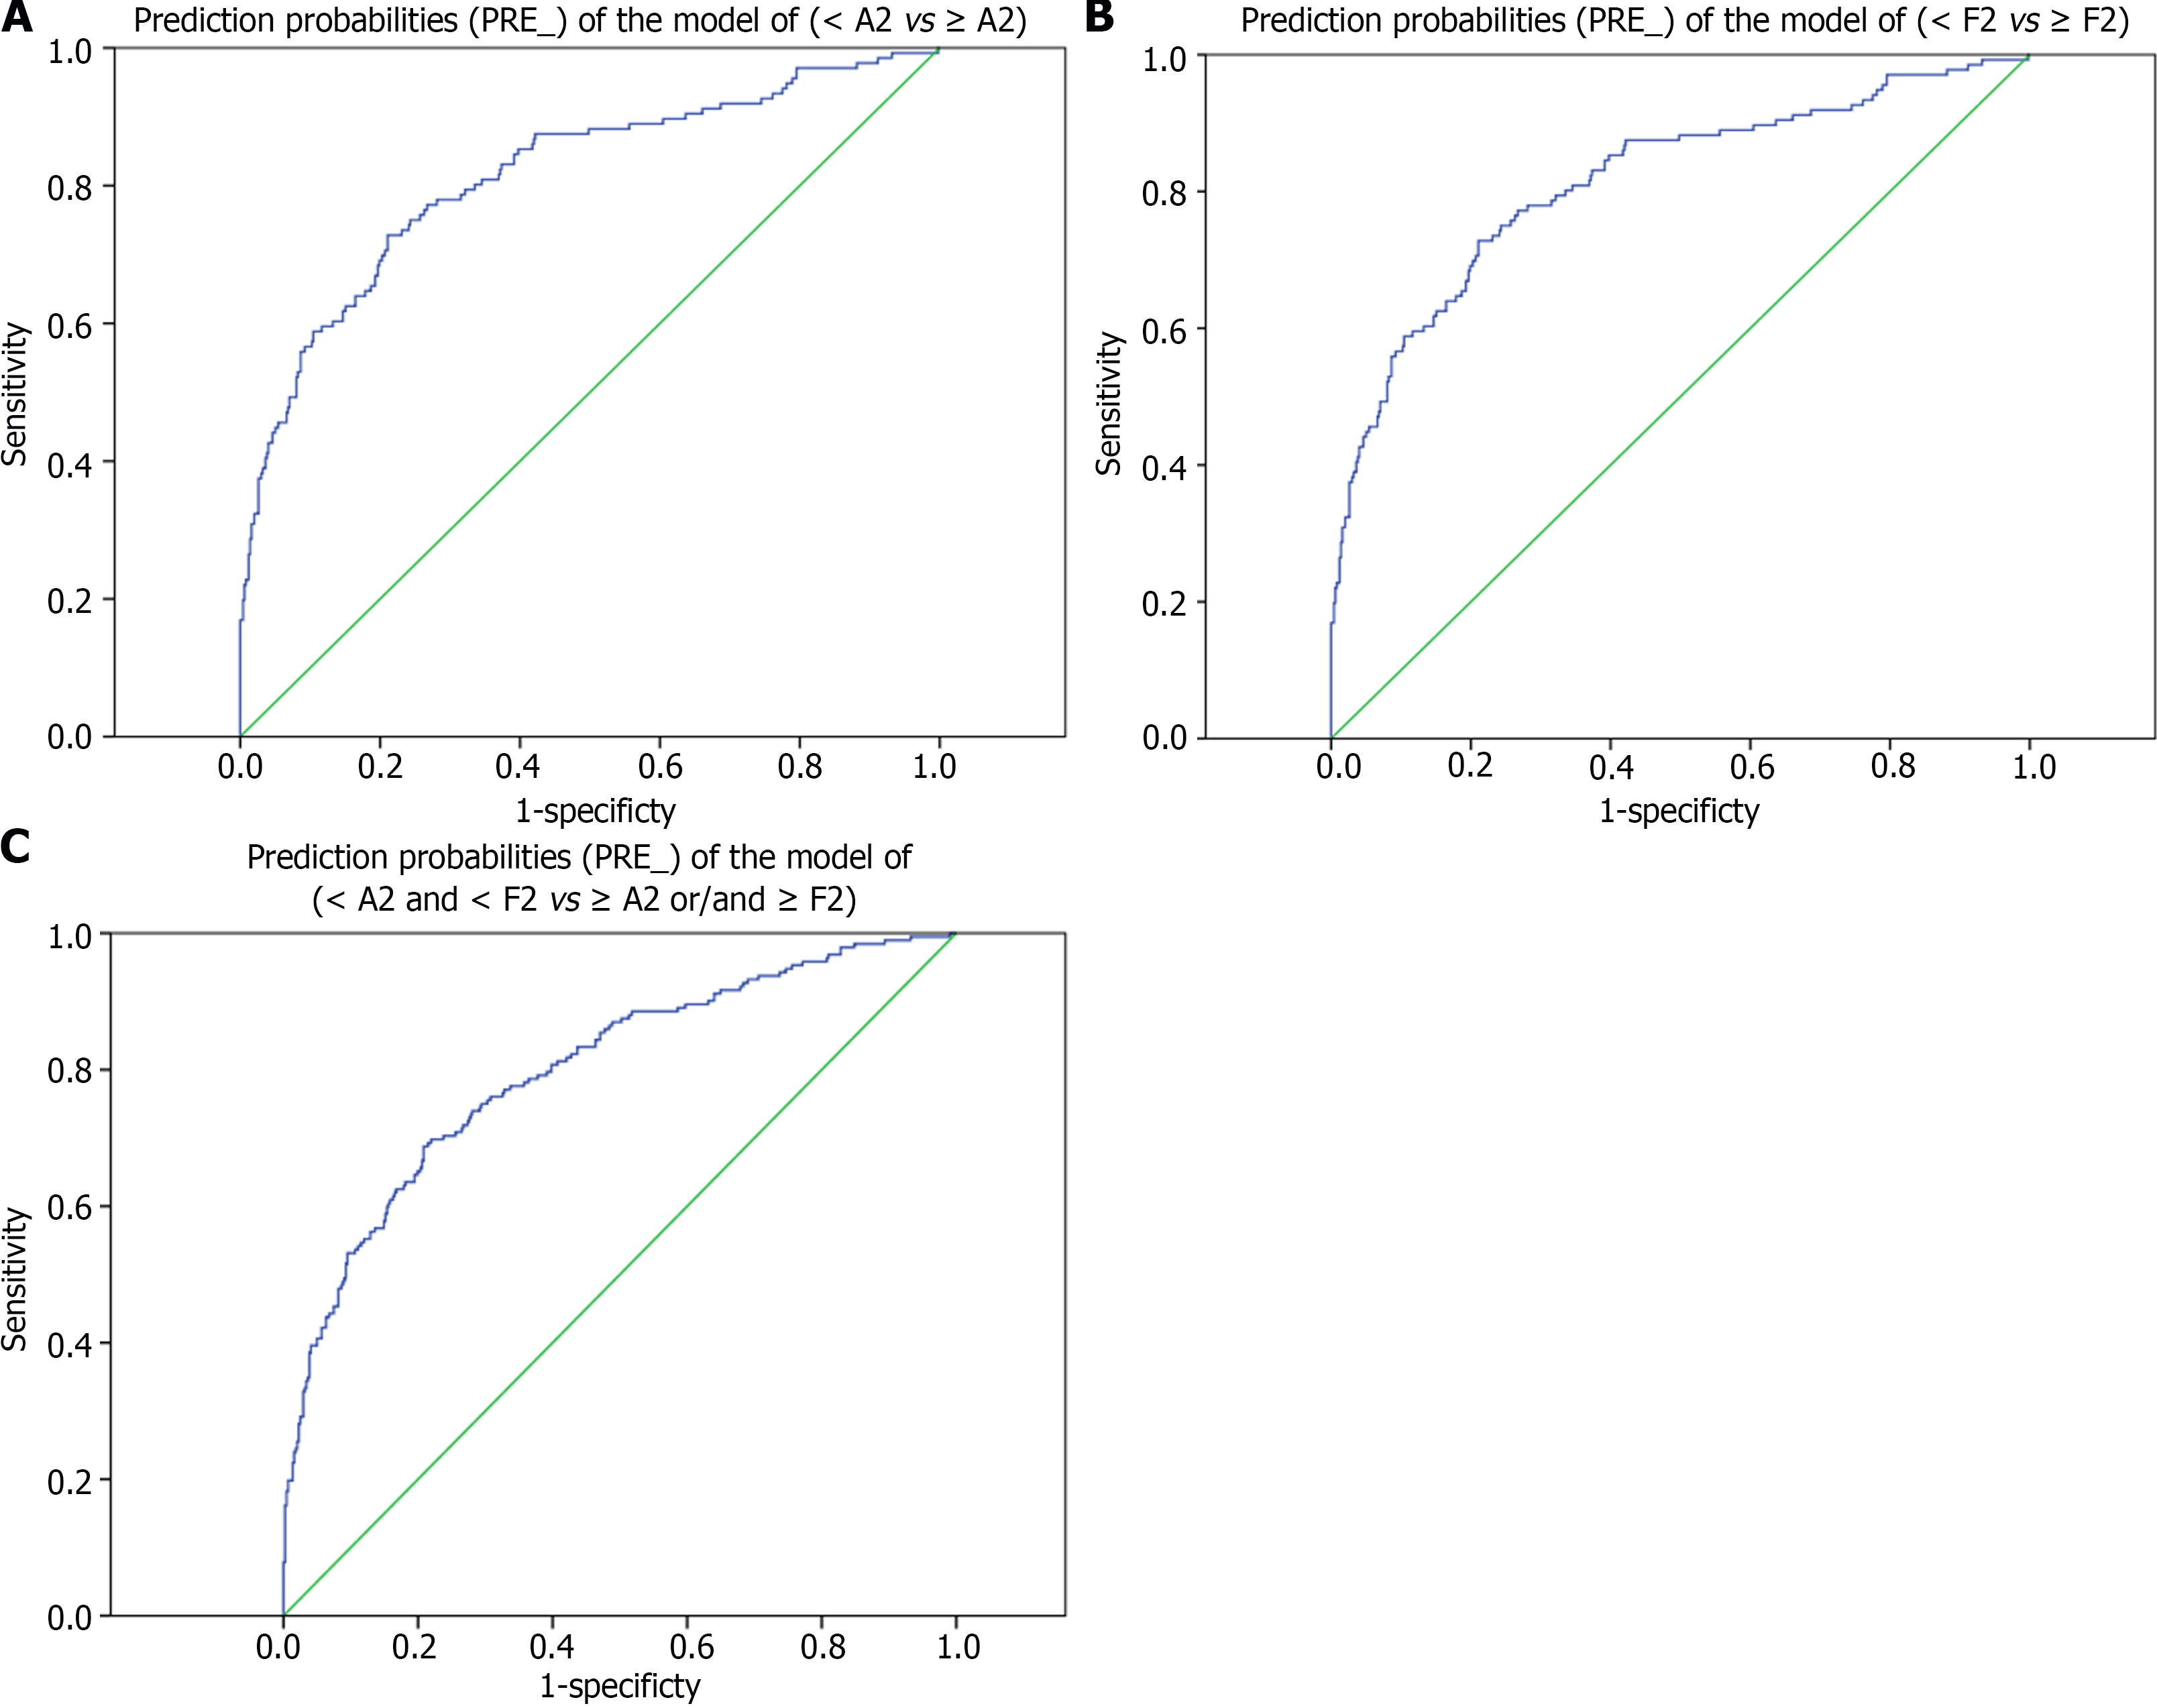
Figure 3 Prediction probabilities (PRE_) of the binary logistic regression model.
A: < A2 vs ≥ A2; B: < F2 vs ≥ F2; C: < A2 and < F2 vs ≥ A2 or/and ≥ F2). A: Liver inflammatory activity; F: Liver fibrosis.
- Citation: Jiang SW, Lian X, Hu AR, Lu JL, He ZY, Shi XJ, Zhu DD, Wang ZY, Huang GC. Liver histopathological lesions is severe in patients with normal alanine transaminase and low to moderate hepatitis B virus DNA replication. World J Gastroenterol 2023; 29(16): 2479-2494
- URL: https://www.wjgnet.com/1007-9327/full/v29/i16/2479.htm
- DOI: https://dx.doi.org/10.3748/wjg.v29.i16.2479


