Copyright
©The Author(s) 2023.
World J Gastroenterol. Apr 14, 2023; 29(14): 2134-2152
Published online Apr 14, 2023. doi: 10.3748/wjg.v29.i14.2134
Published online Apr 14, 2023. doi: 10.3748/wjg.v29.i14.2134
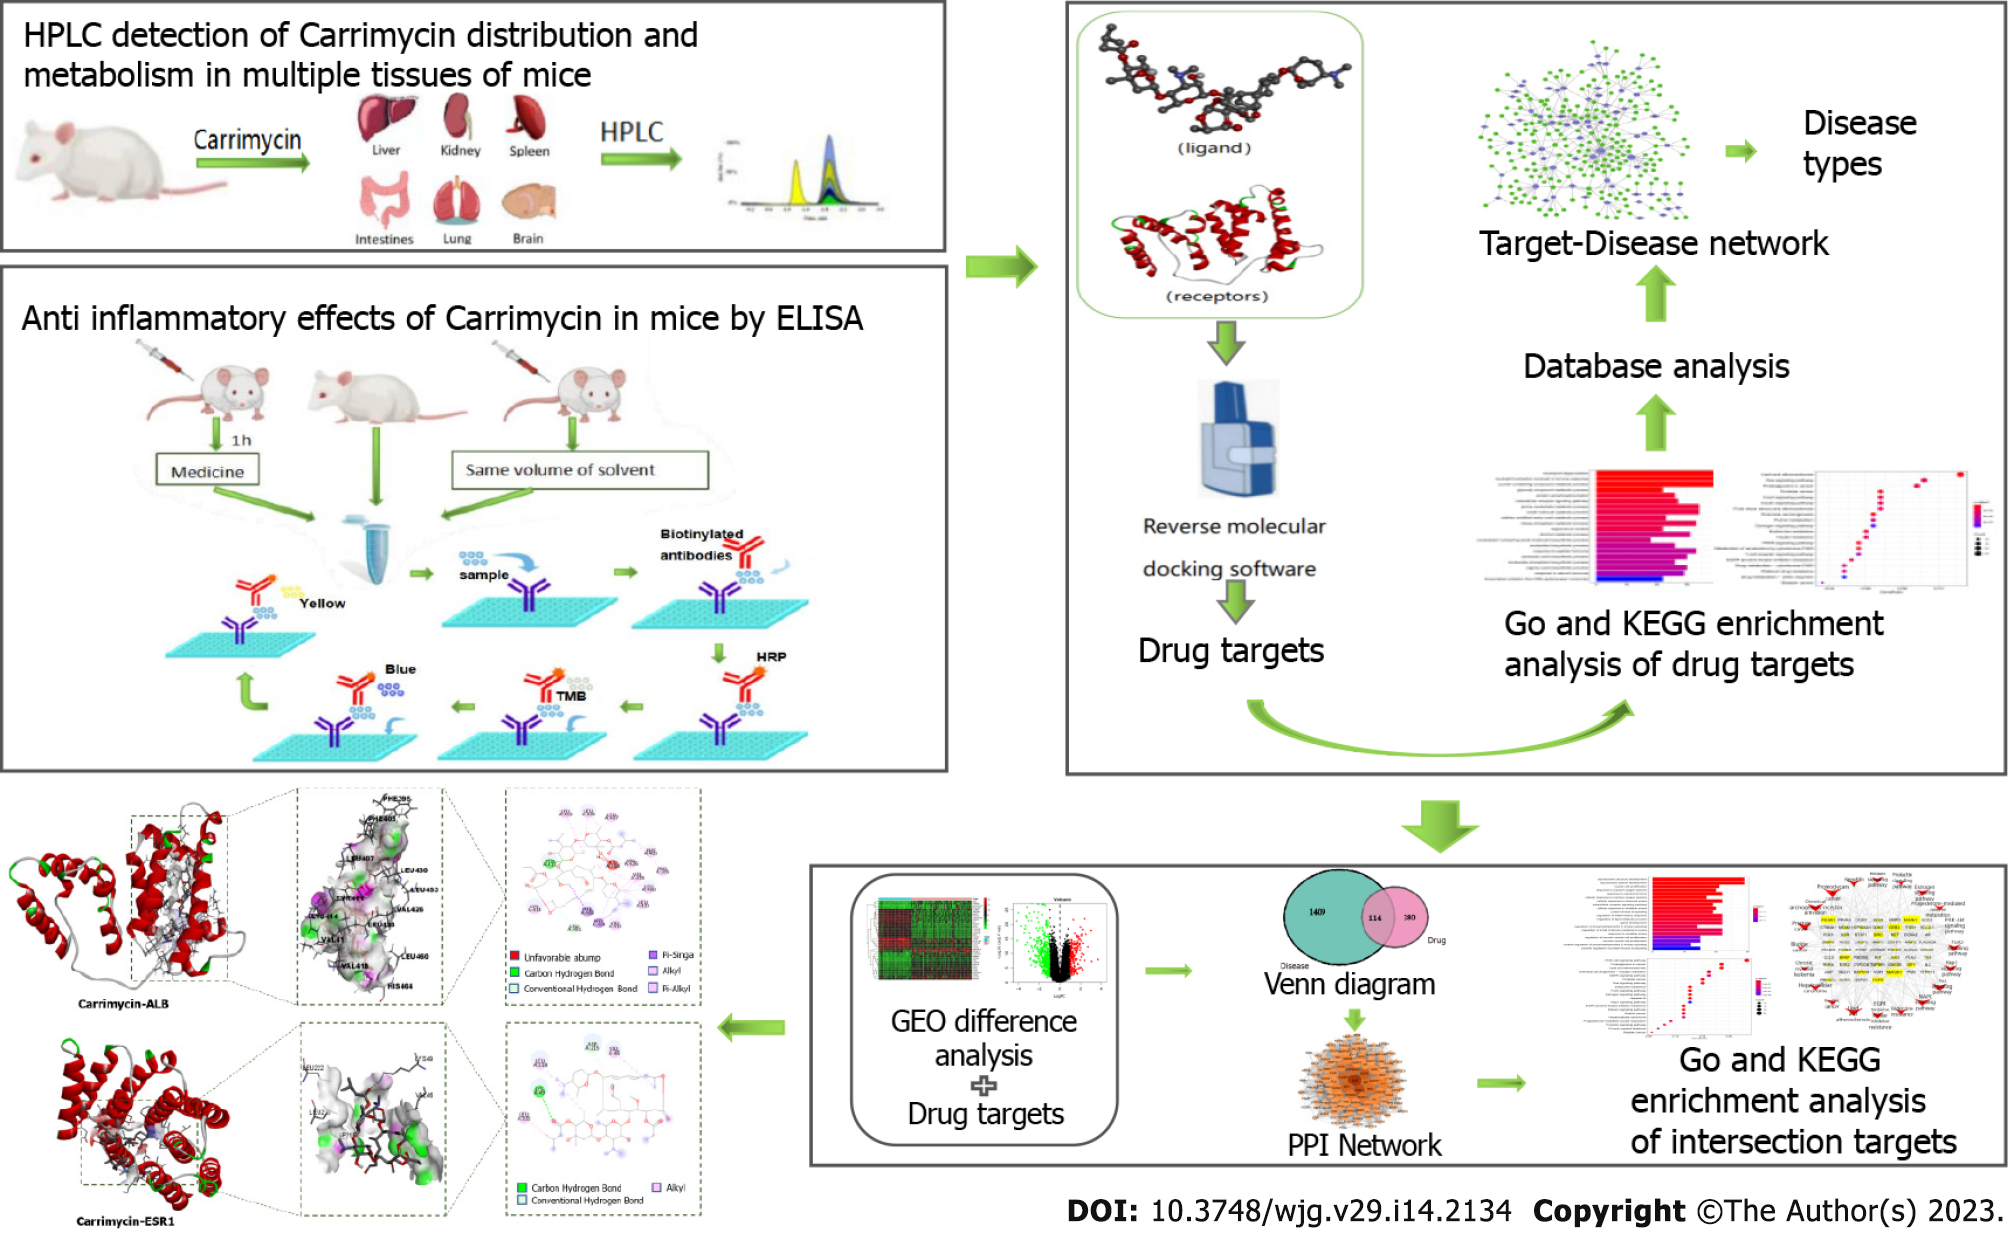
Figure 1 Experimental flow chart.
The distribution and metabolism of carrimycin in various mouse tissues and organs were assessed by hyphenated to liquid chromatography, and the effect of carrimycin on inflammatory factors in these tissues and organs was detected by enzyme-linked immunosorbent assay. Reverse molecular docking technology was used to screen for the targets of carrimycin, and the predicted target was enriched and analyzed to obtain data on the related diseases. Then, the key targets and associated pathways for the treatment of liver cancer were analyzed by network pharmacology. HPLC: Hyphenated to liquid chromatography; ELISA: Enzyme-linked immunosorbent assay; GO: Gene Ontology; KEEG: Kyoto Encyclopedia of Genes and Genomes; PPI: Protein-protein interaction.
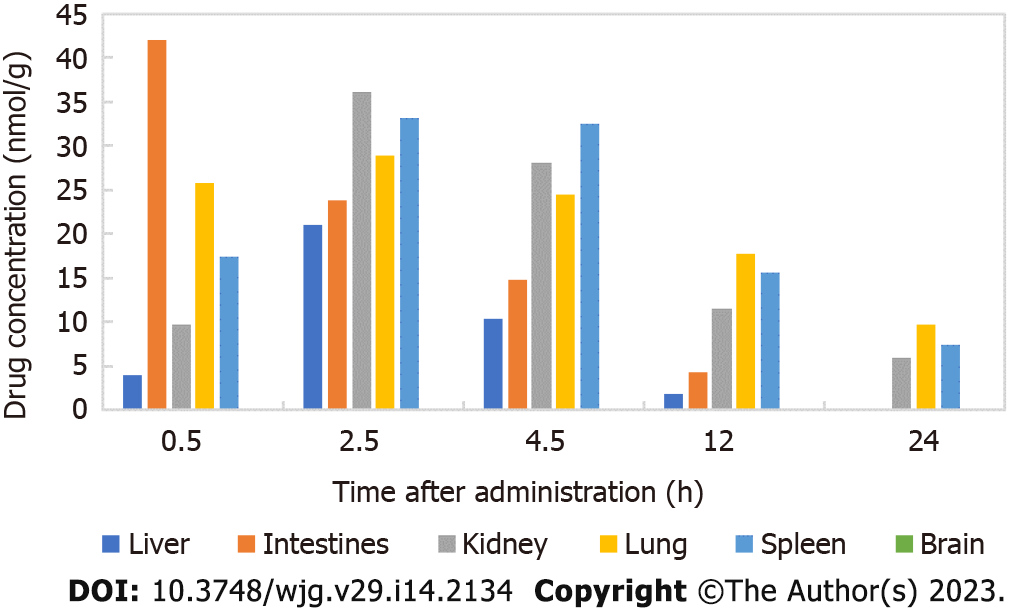
Figure 2 Concentrations of carrimycin in different tissues and organs after intragastric administration to mice (nmol/g).
2.5 h after carrimycin treatment, the maximum drug concentration was reached in the liver, kidney, lung and spleen. In the intestine, the maximum drug concentration was reached 0.5 h after administration, and carrimycin was not detected in the brain.
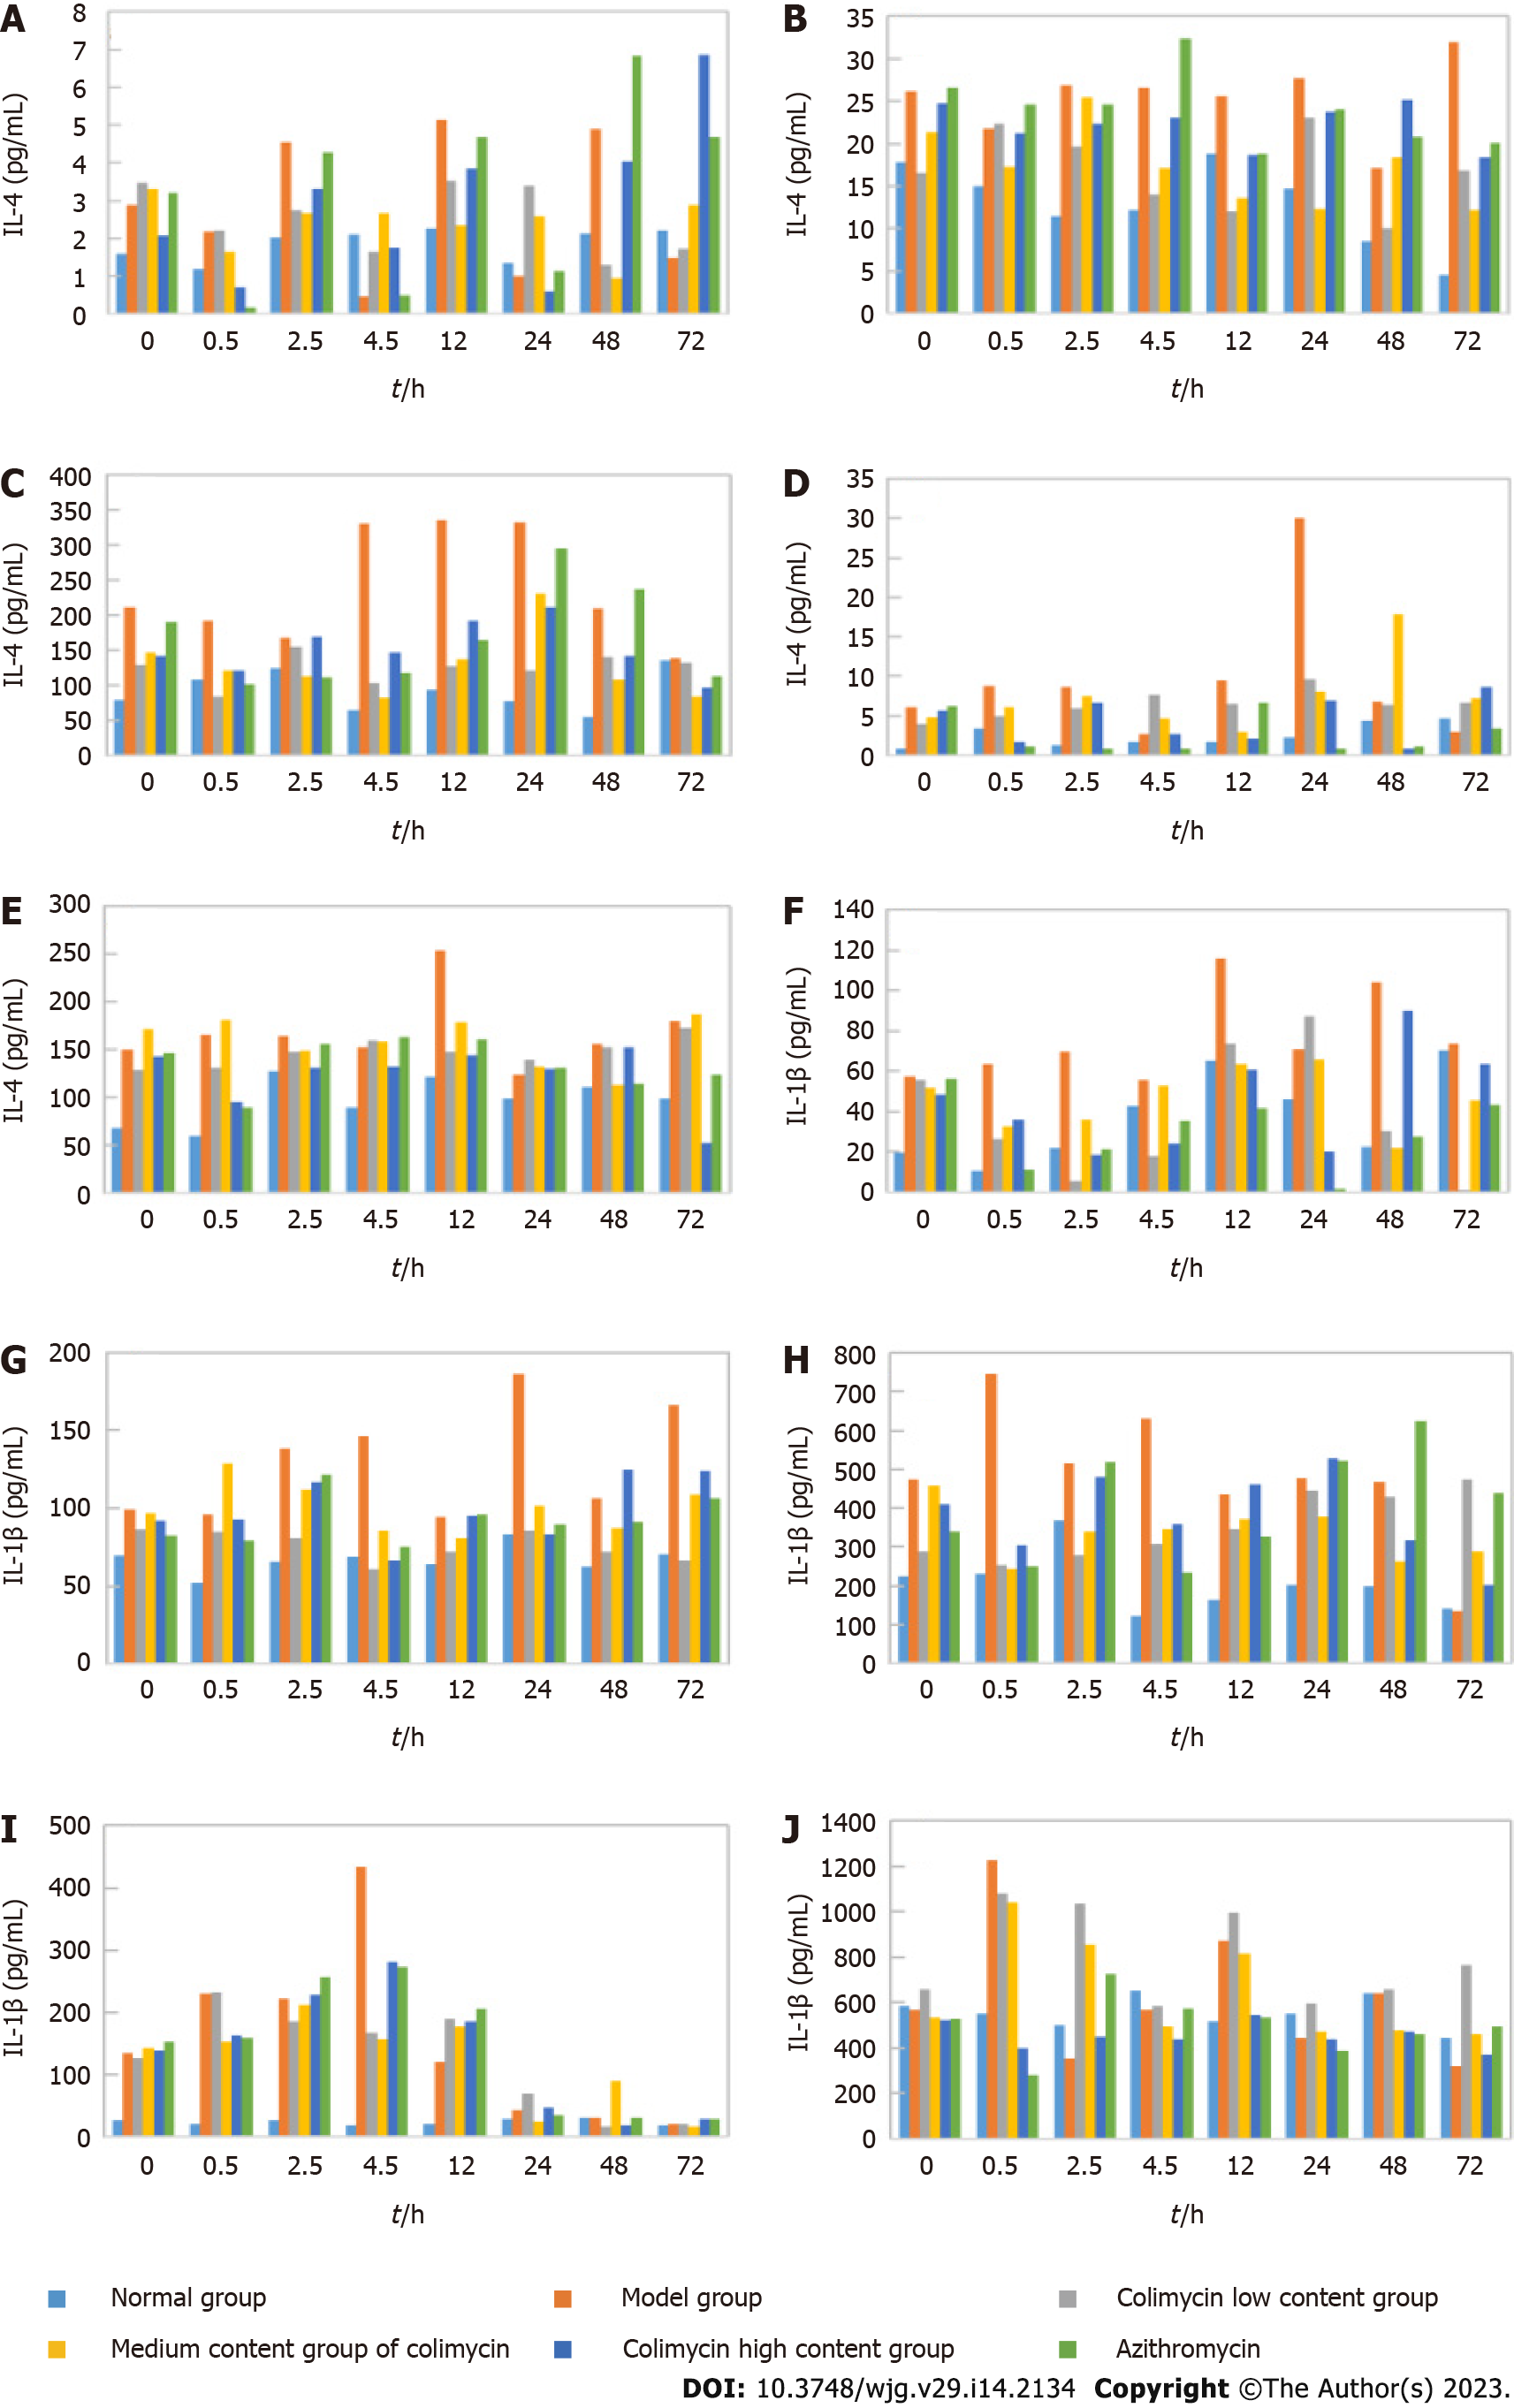
Figure 3 Anti-inflammatory effect of carrimycin in mice detected by enzyme-linked immunosorbent assay.
A: Interleukin-4 (IL-4) expression in the intestine; B: IL-4 expression in the lung; C: IL-4 expression in the liver; D: IL-4 expression in the spleen; E: IL-4 expression in the kidney; F: IL-1β expression in the intestine; G: IL-1β expression in the lung; H: IL-1β expression in the liver; I: IL-1β expression in the spleen; J: IL-1β expression in the kidney. IL: Interleukin.
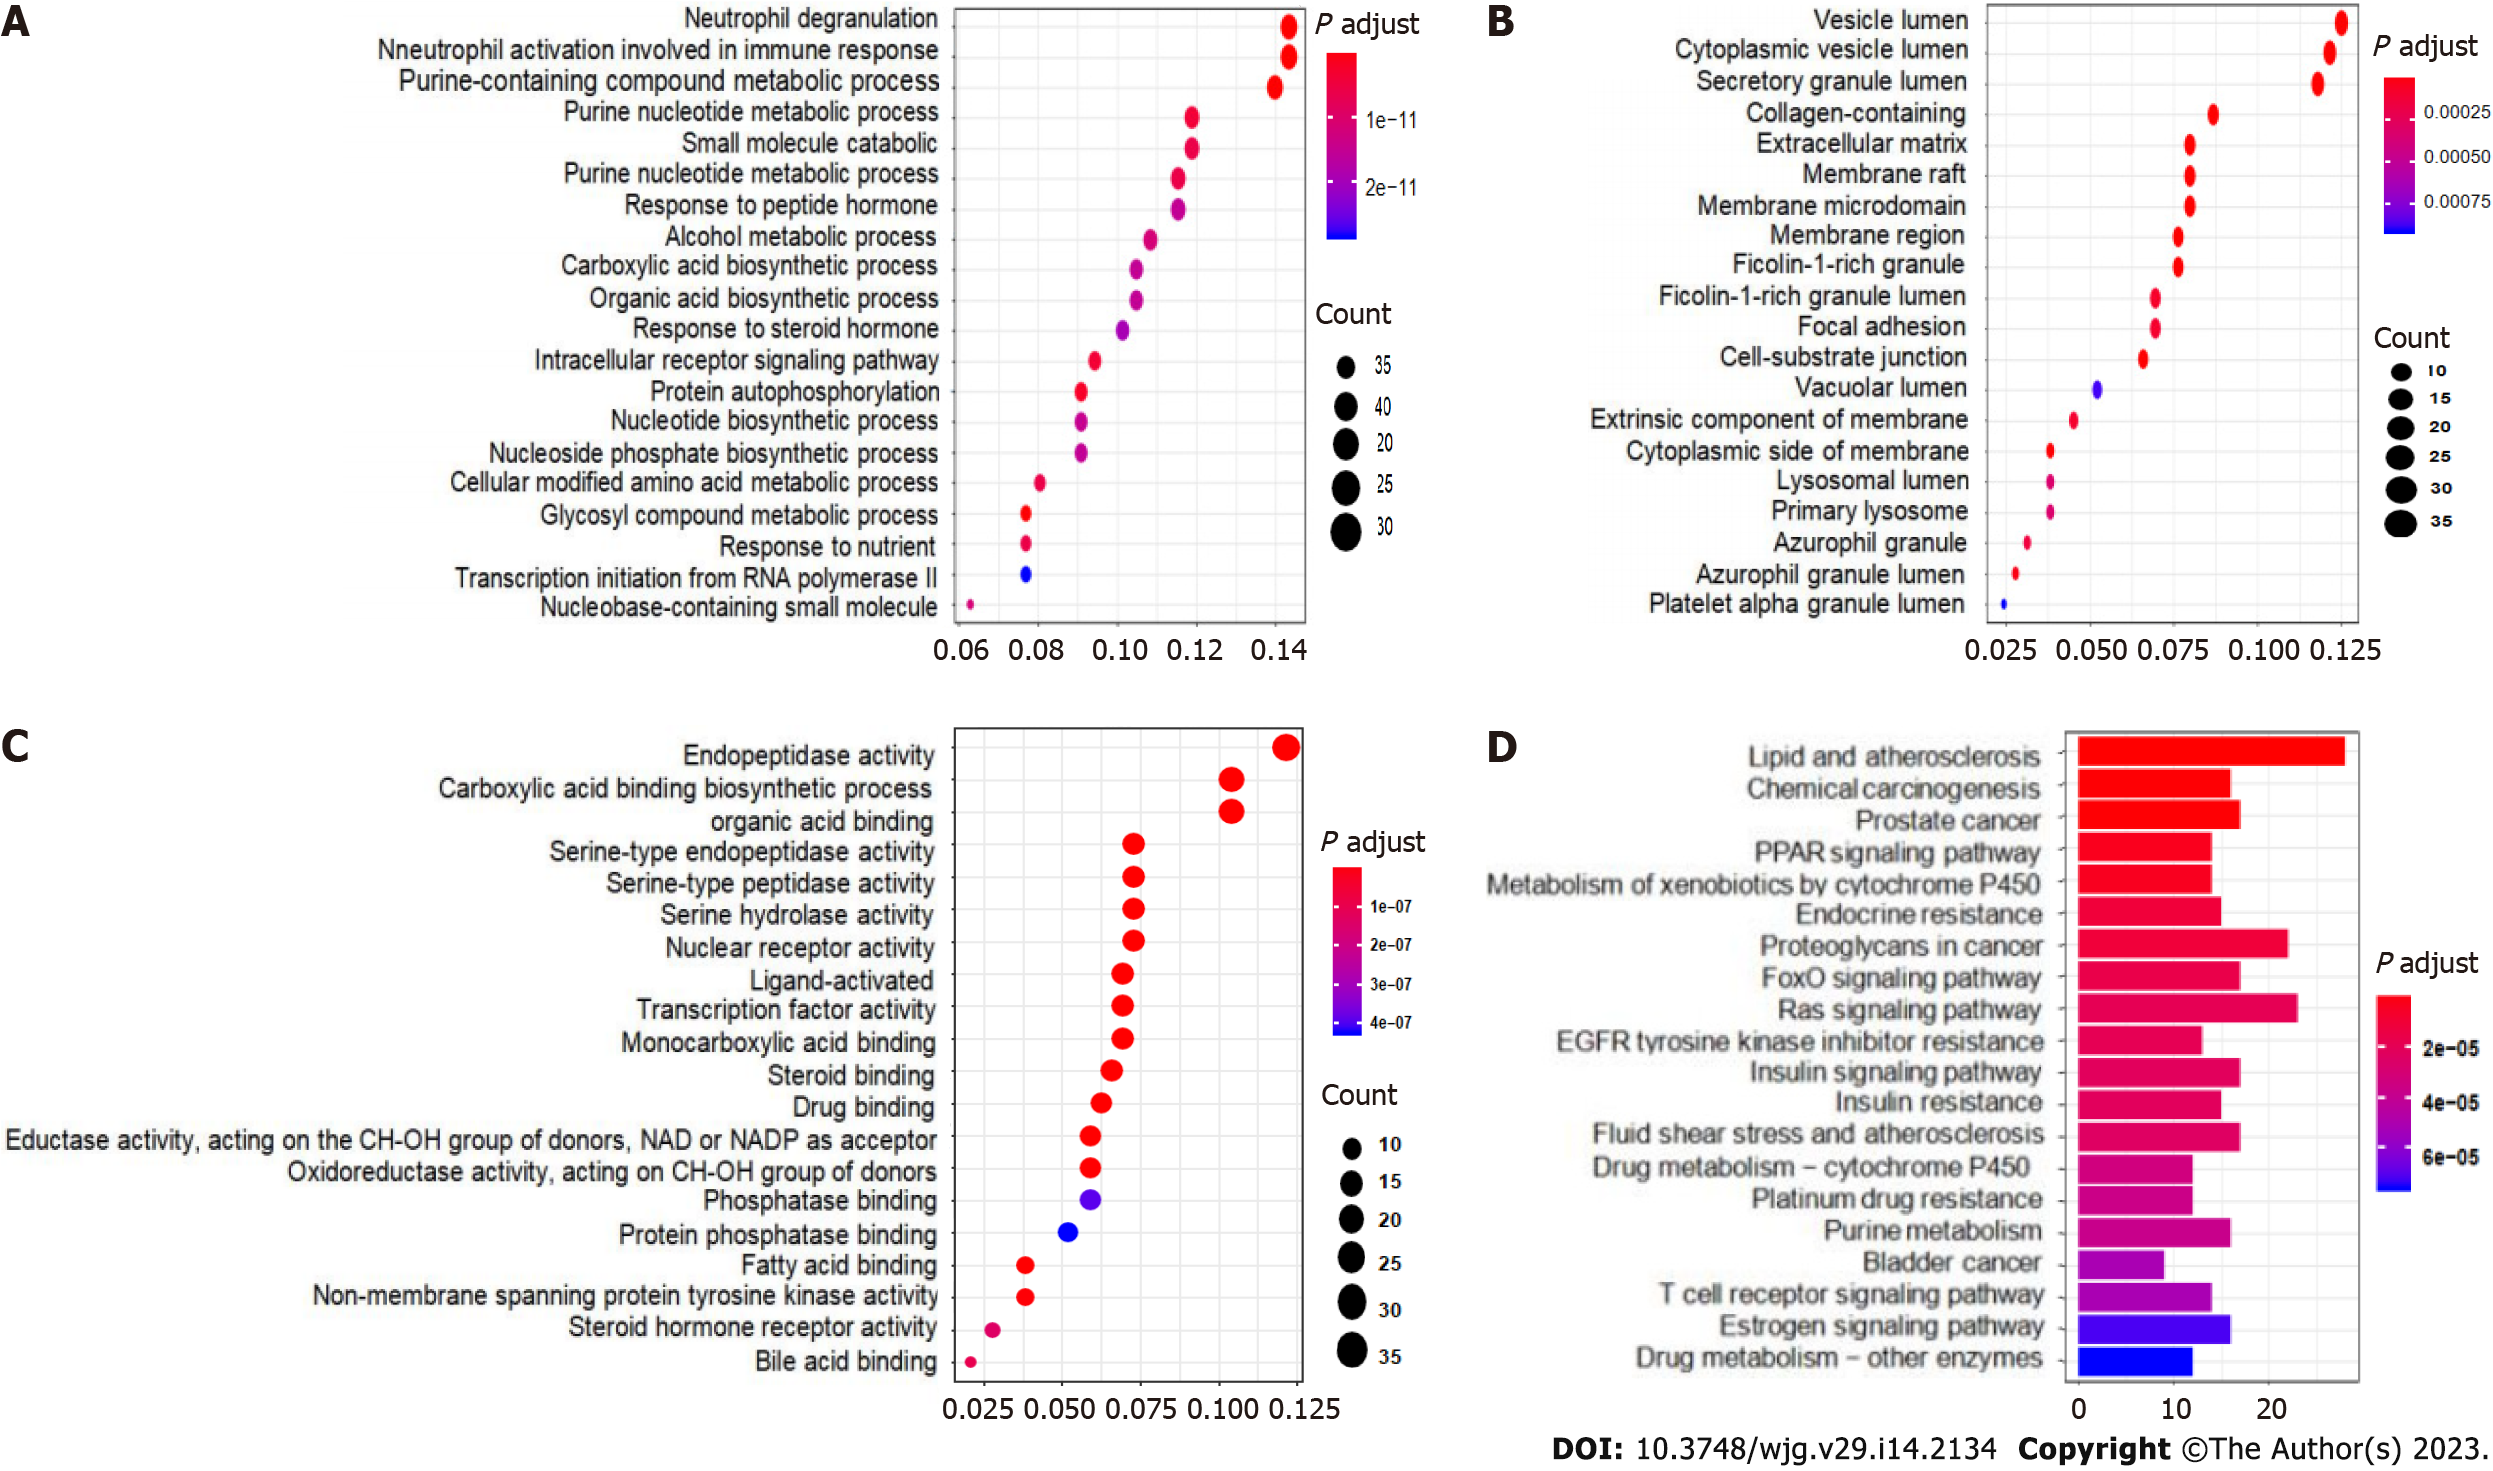
Figure 4 Gene Ontology and Kyoto Encyclopedia of Genes and Genomes enrichment analyses of the targets of carrimycin.
A: Biological processes; B: Cellular components; C: Molecular functions; D: Kyoto Encyclopedia of Genes and Genomes enrichment analysis of carrimycin showing that the main pathways in which carrimycin is involved in the treatment of diseases include the Ras, FoxO, and insulin signaling pathways. PPAR: Peroxisome proliferator-activated receptor.
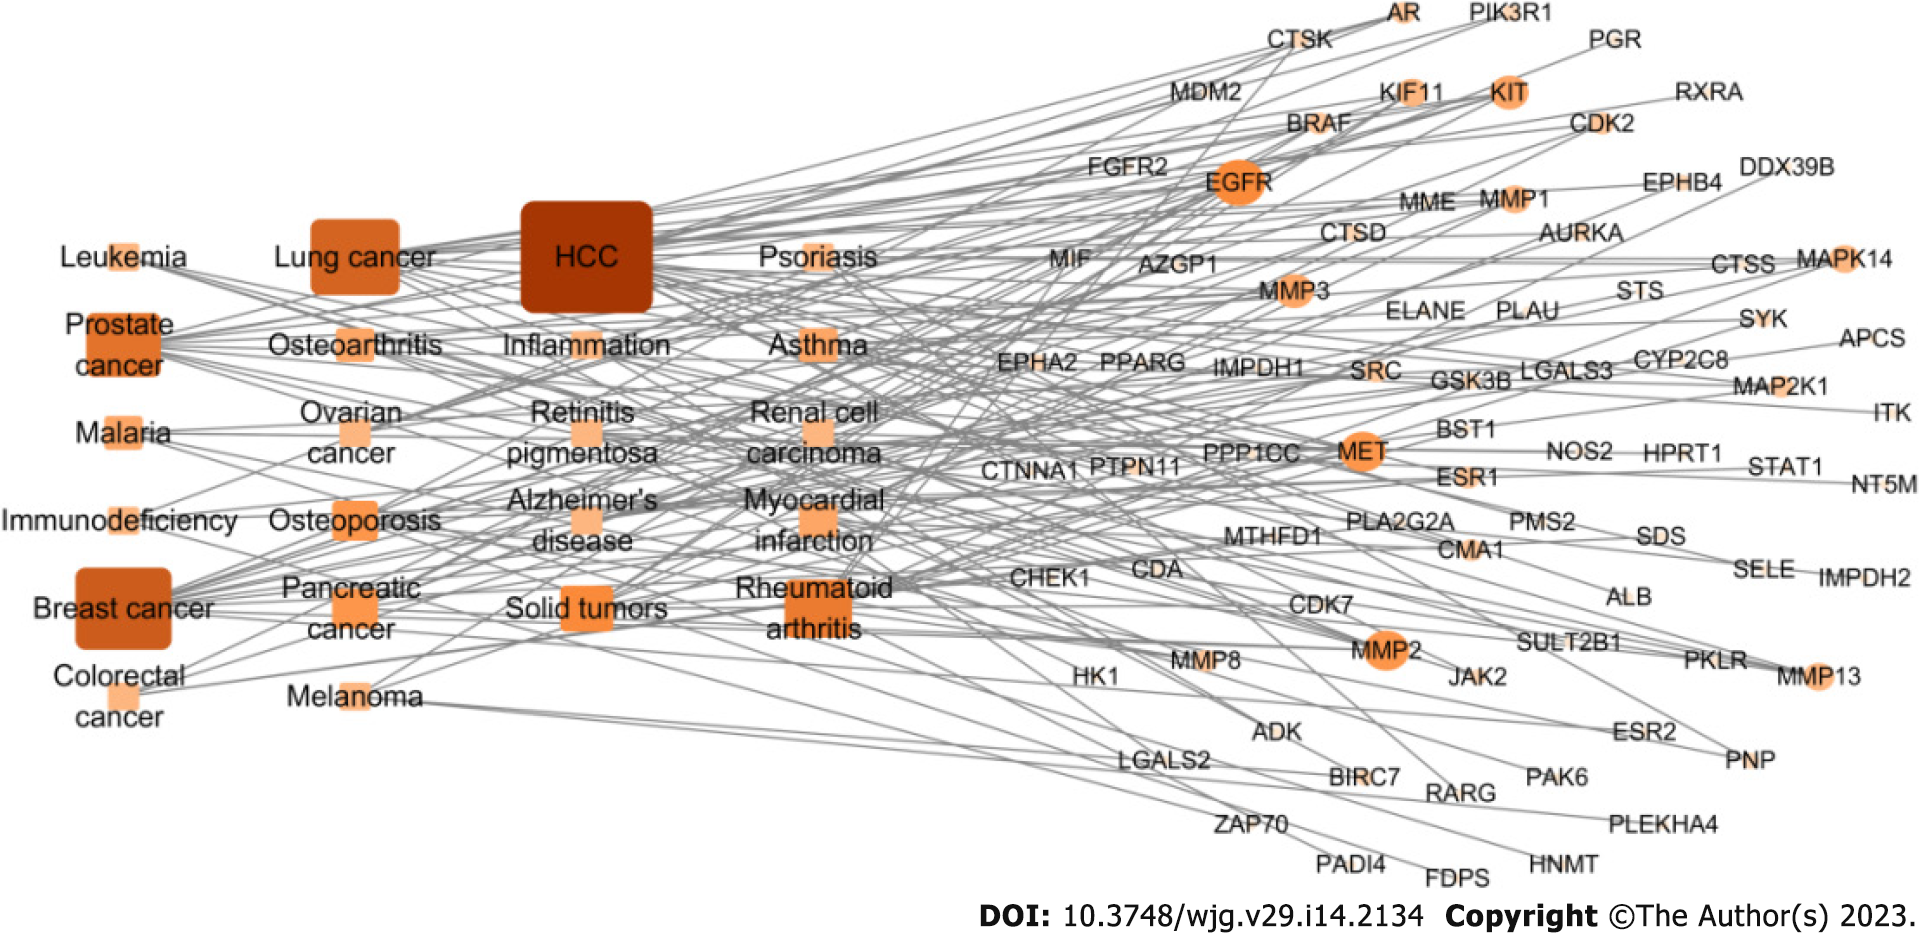
Figure 5 Target-disease network of carrimycin.
The 293 predicted target proteins were analyzed one by one by combining multiple databases to screen 77 main targets (circles) and 22 main diseases (rectangles). The main diseases involved were liver cancer (degree = 18), breast cancer (degree = 13), lung cancer (degree = 12), and prostate cancer (degree = 10). HCC: Hepatocellular carcinoma.
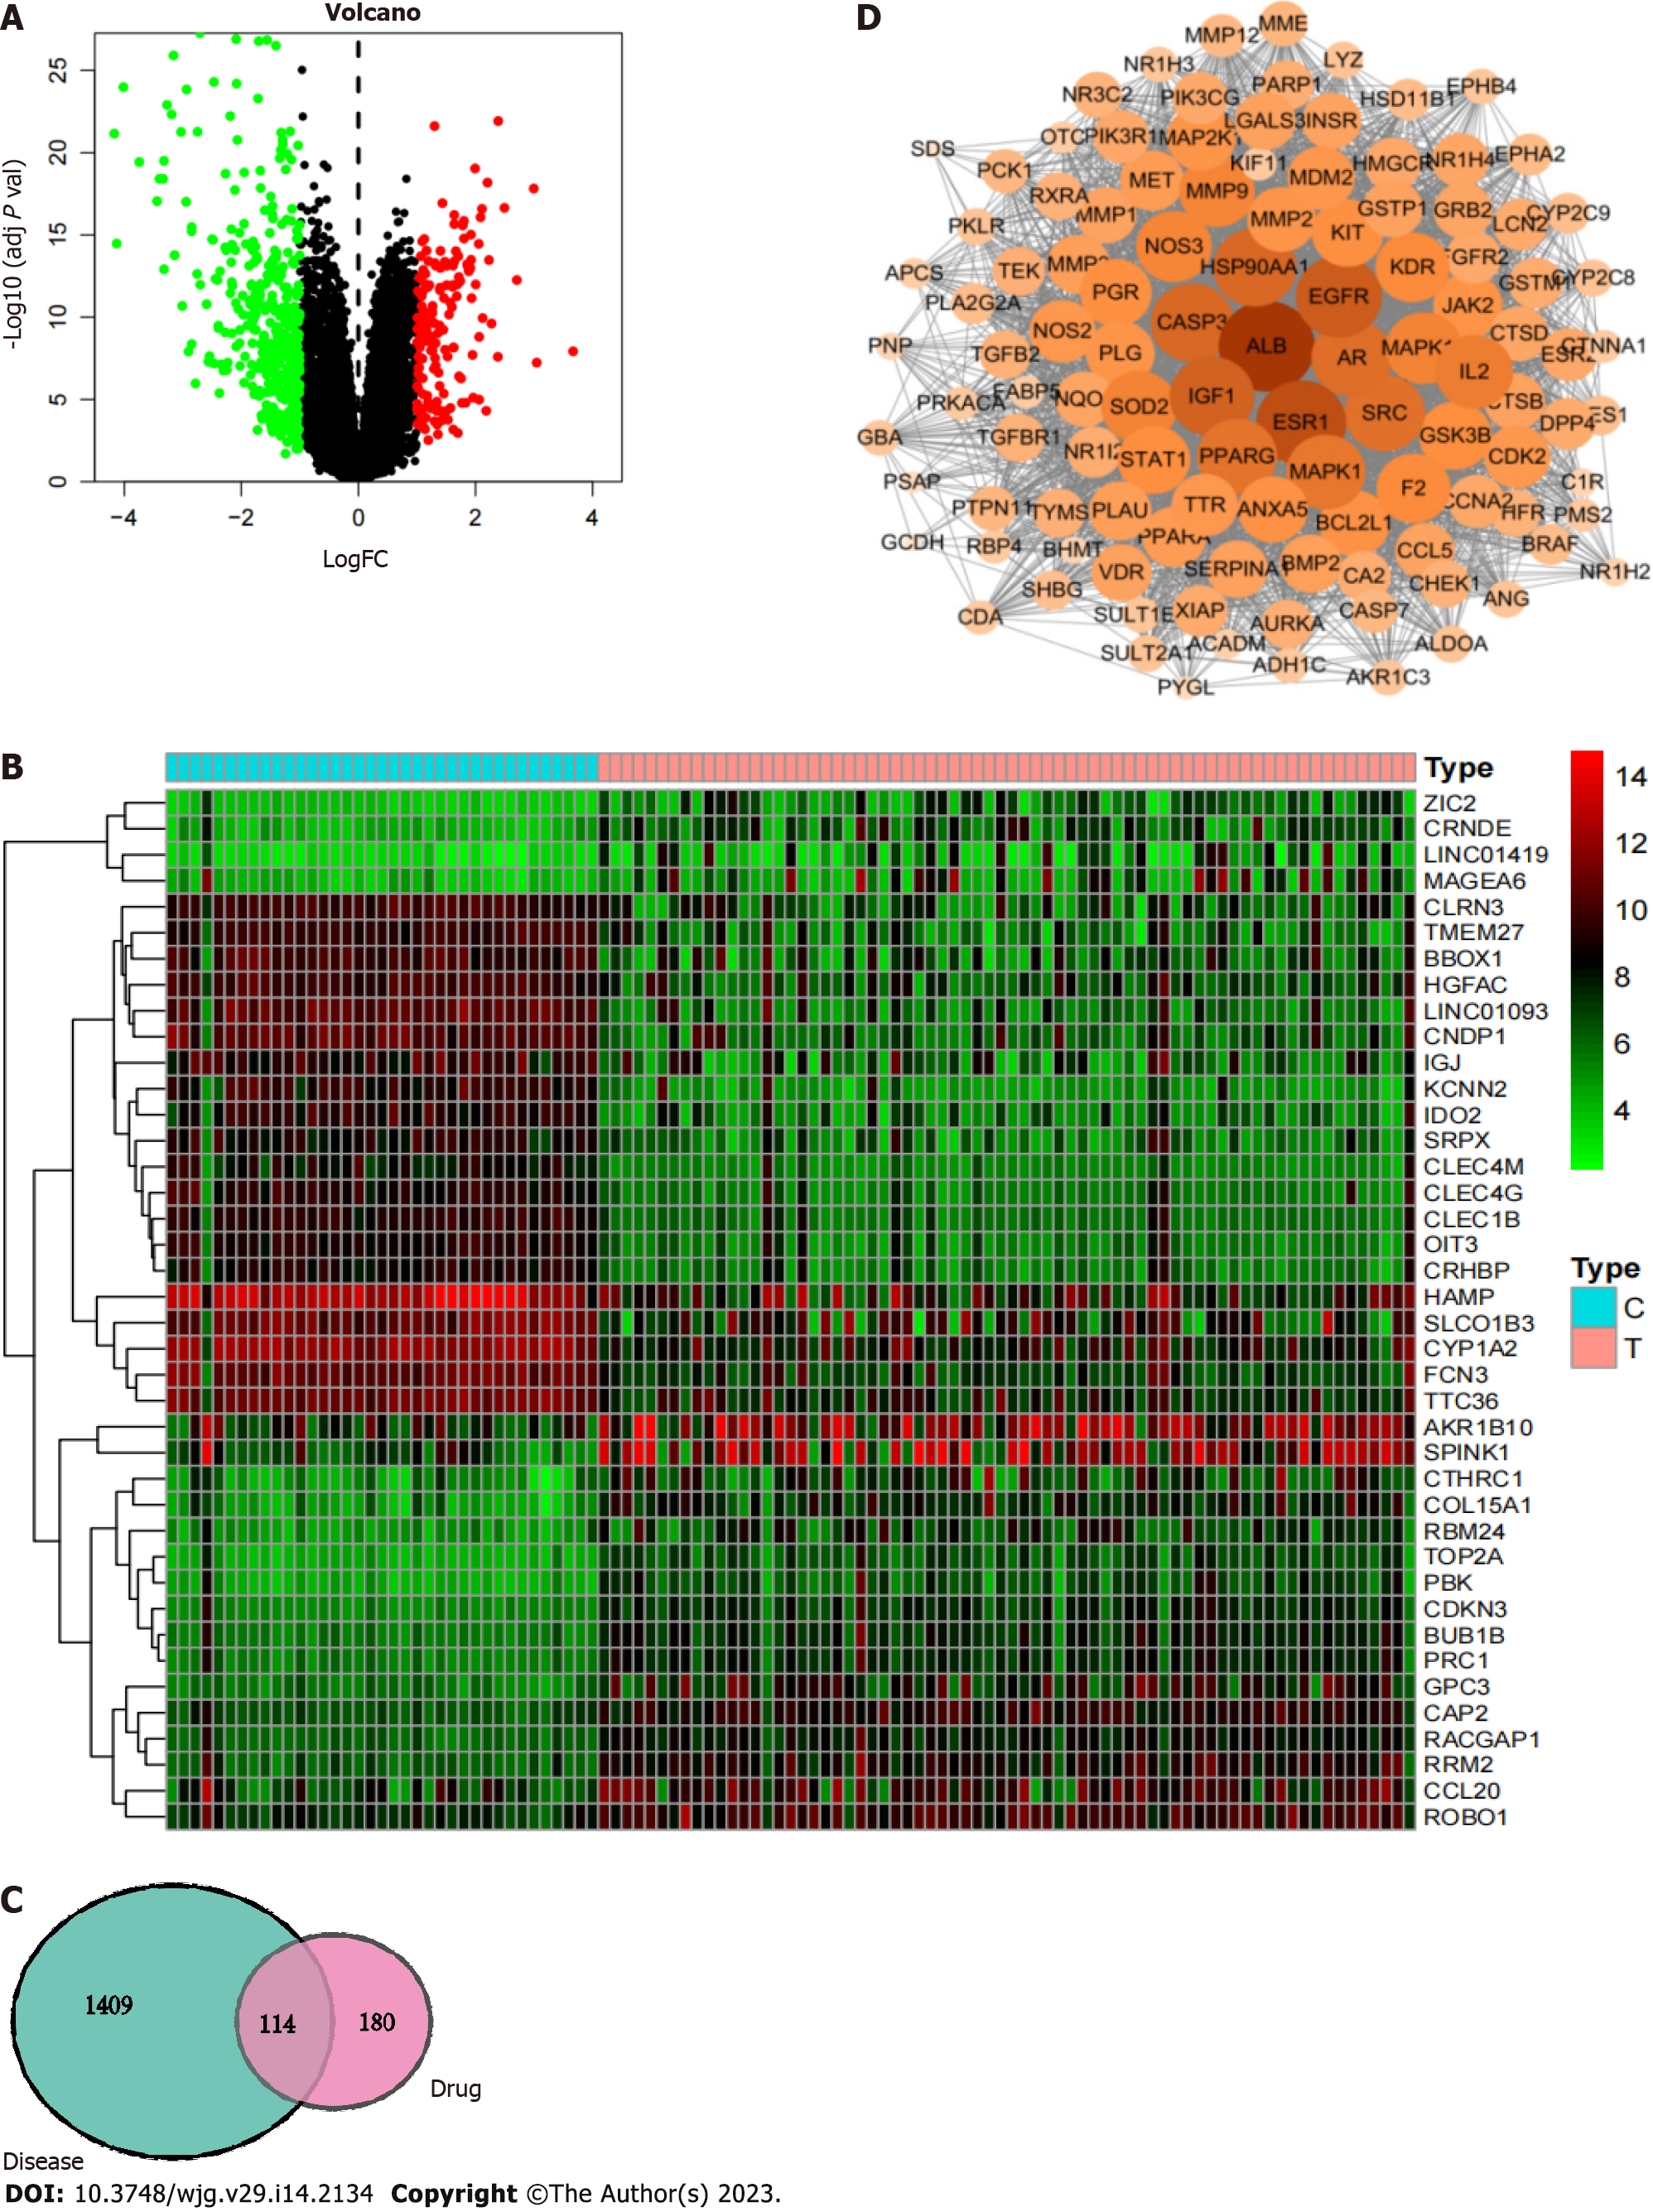
Figure 6 Network pharmacology illustration.
A: Differential gene volcano plot; B: Differential gene heatmap. Up- and downregulated differentially expressed genes can be derived from volcano plots and heatmaps; C: Venn diagram of the common targets of carrimycin and liver cancer. The common disease-drug targets were determined from this map; D: Protein-protein interaction network of carrimycin and acquisition of the core targets of carrimycin in liver cancer.
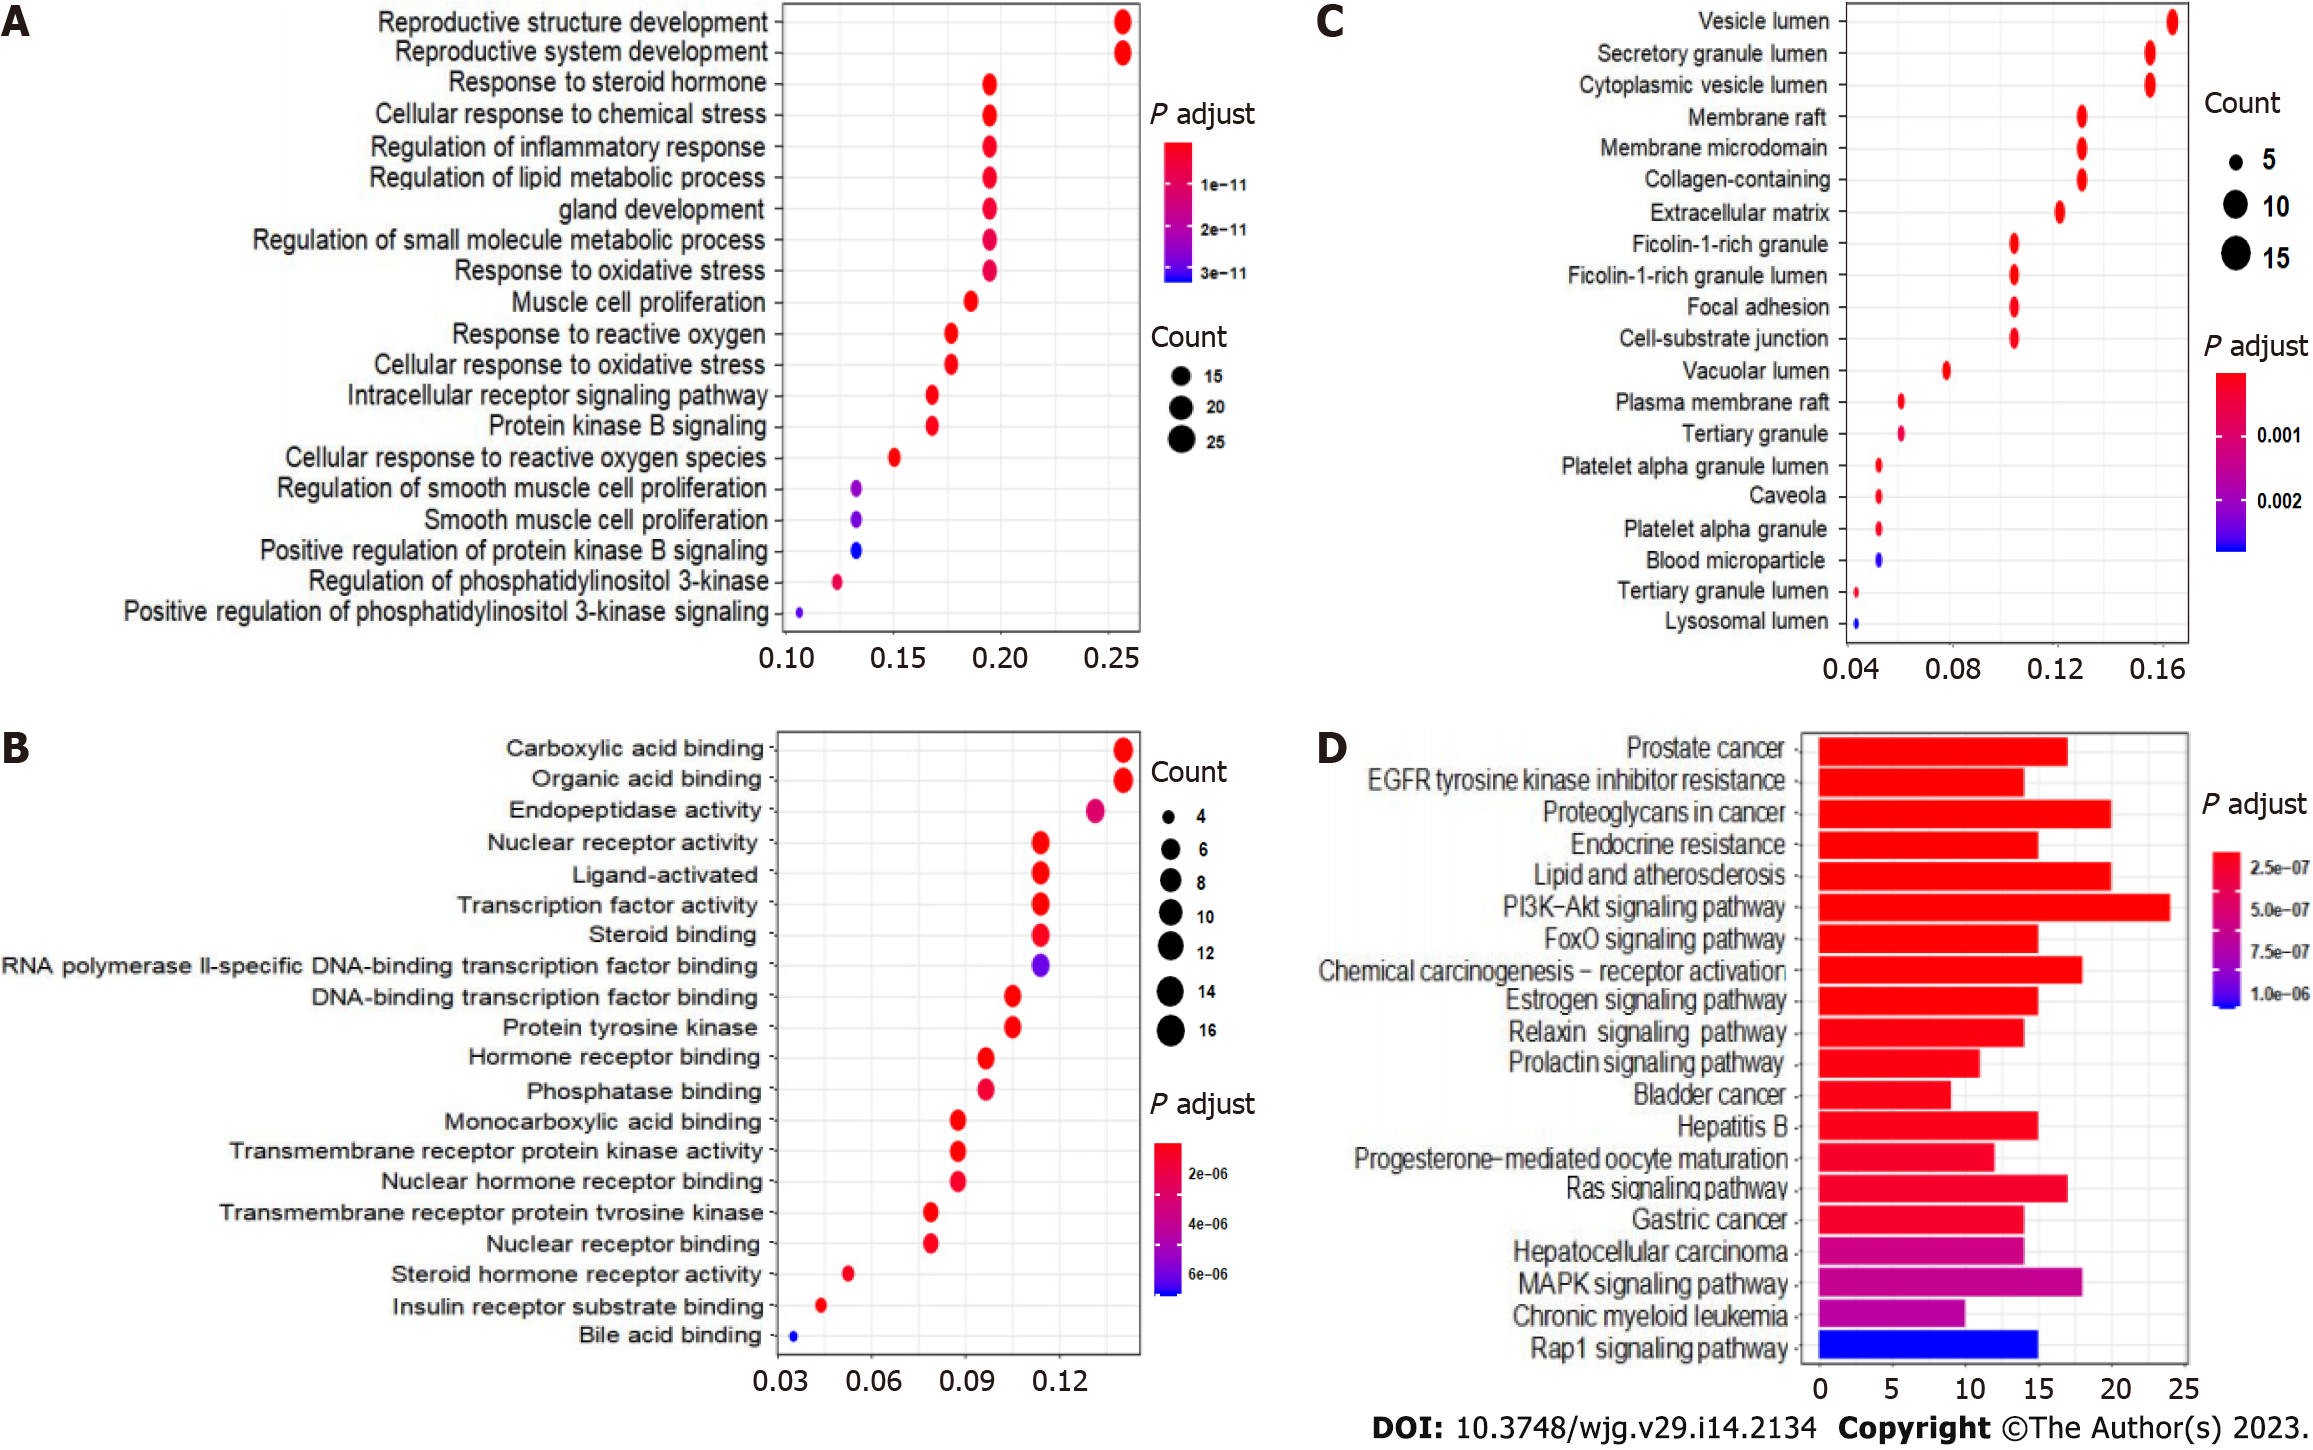
Figure 7 Gene Ontology and Kyoto Encyclopedia of Genes and Genomes enrichment analysis results of the intersecting targets.
A: Biological processes; B: Molecular functions; C: Cellular components; D: Kyoto Encyclopedia of Genes and Genomes enrichment analysis of the key targets of carrimycin in the treatment of liver cancer. The main pathways involved include the PI3K-Akt, MAPK, Ras, and FoxO signaling pathways.
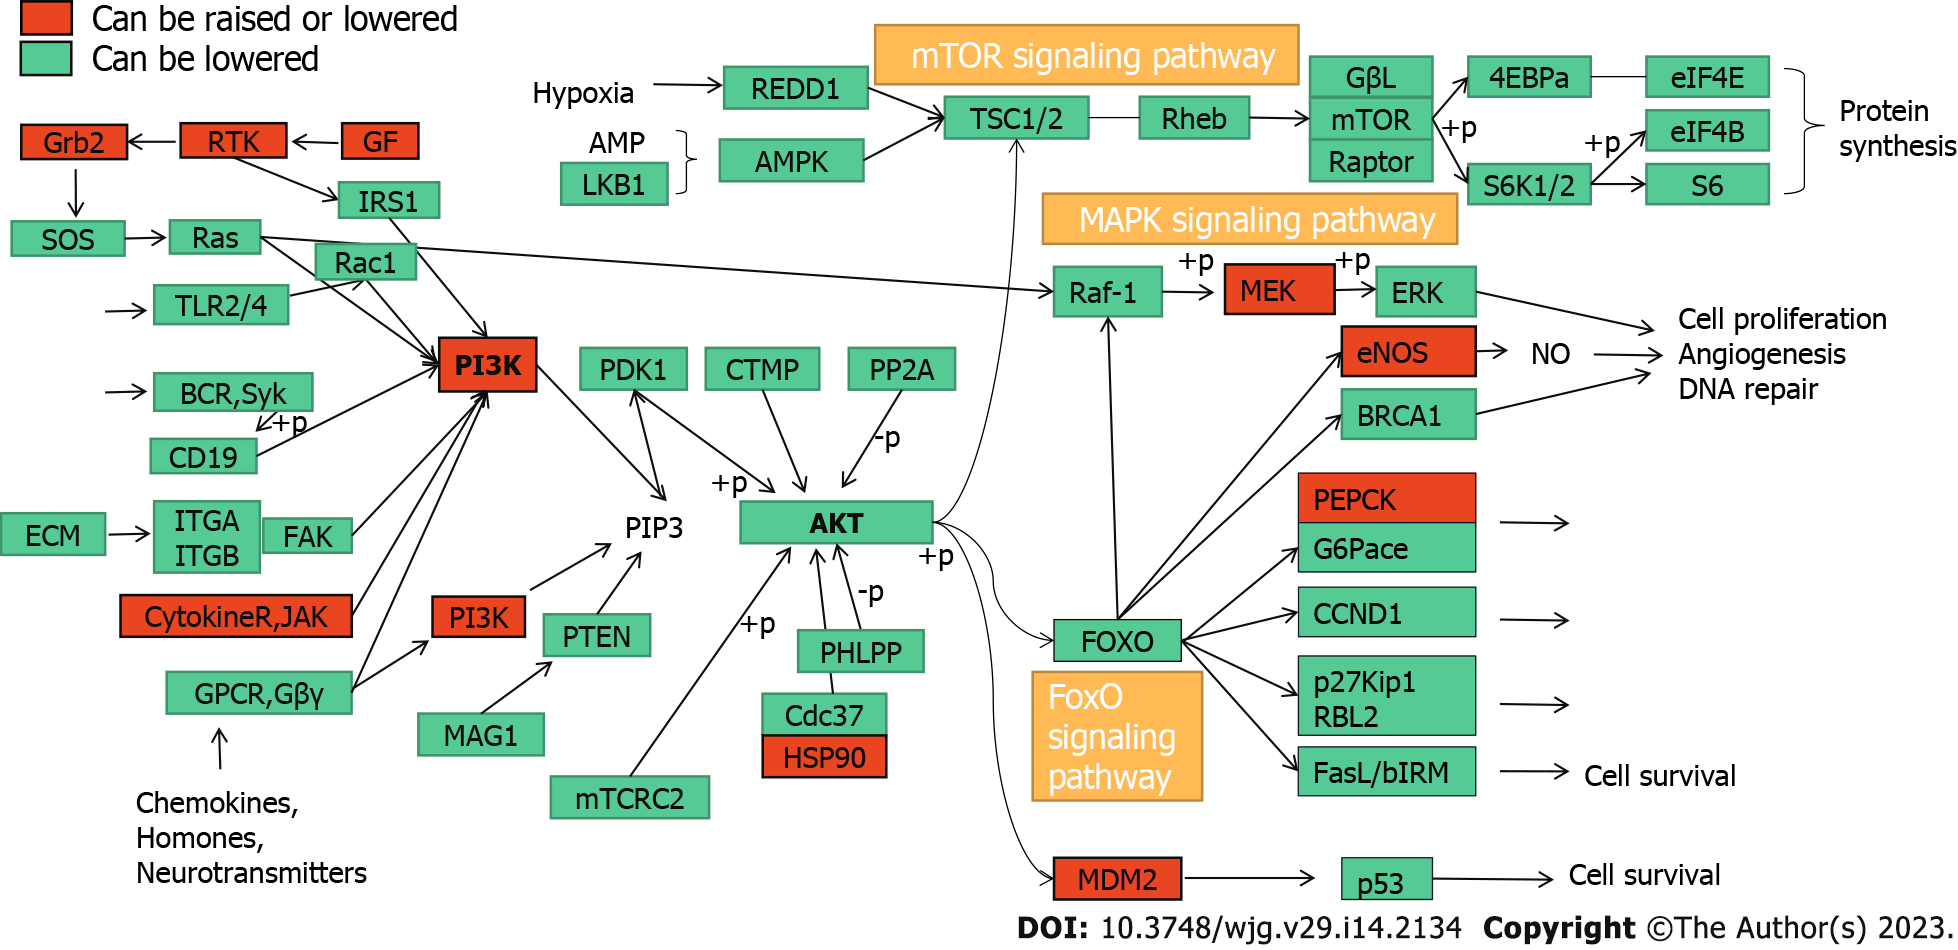
Figure 8 PI3K-Akt signaling pathway regulation.
This plot shows the genes that are upregulated or downregulated (red) and downregulated (green) by carrimycin in the PI3K-Akt pathway. Grb2: Growth factor receptor bound protein 2; RTK: Receptor tyrosine kinase; GF: Growth factor; IRS1: Insulin receptor substrate 1; TLR: Toll-like reCEPT; BCR: Breakpoint cluster region; ECM: Extracellular matrix; ITGA: Integrin subunit alpha; FAK: Focal Adhesion Kinase; JAK: Janus kinase; GPCR: G protein-coupled receptor; AMP: Adenosine Mono Phosphate; LKB1: Liver kinase B1; REDD1: regulated in development and DNA damage responses-1; AMPK: AMP-activated protein kinase; TSC: tuberous sclerosis; Rheb: Right Hand Equipment Bay; PDK1: Pyruvate dehydrogenase kinase, isozyme 1; CTMP: Carboxy terminal modulator protein; PP2A: Protein phosphatase 2A regulatory subunit; PIP: Phosphoinositide-binding protein; PTEN: Phosphatase and tensin homolog; PHLPP: PH domain leucine-rich repeat protein phosphatase; CDC: Cell division cycle gene; HSP: Heat shock protein; RAF: Rheumatoid Arthritis Factor; MEK: Mitogen-activated protein; ERK: Extracellular regulated protein kinases; ENOS: Endothelial nitric oxide synthase; BRCA: Breast cancer susceptibility genes; PEPCK: Phosphoenolpyruvate carboxykinase; FOXO: Forkhead Box O; MDM2: Murine double minute 2; CCND1: Recombinant Cyclin D1; RBL2: Retinoblastoma-like 2; MDM2: Murine double minute 2; mTOR: Mammalian target of rapamycin (a protein).
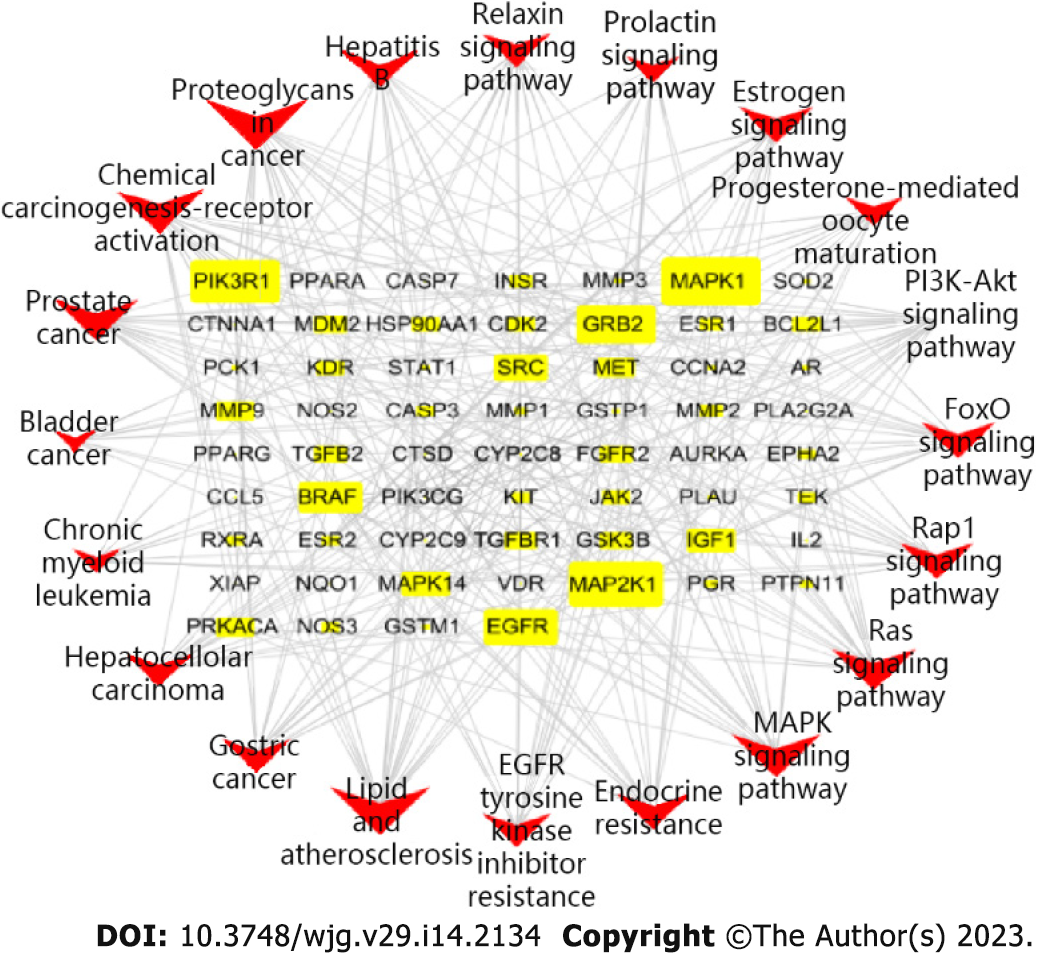
Figure 9 Target-pathway network of carrimycin.
The nodes include 60 related targets displayed as yellow rectangles and 20 signaling pathways indicated in red type V. The main targets acting on the pathway include MAPK1, MAP2K1, and EGFR, etc.
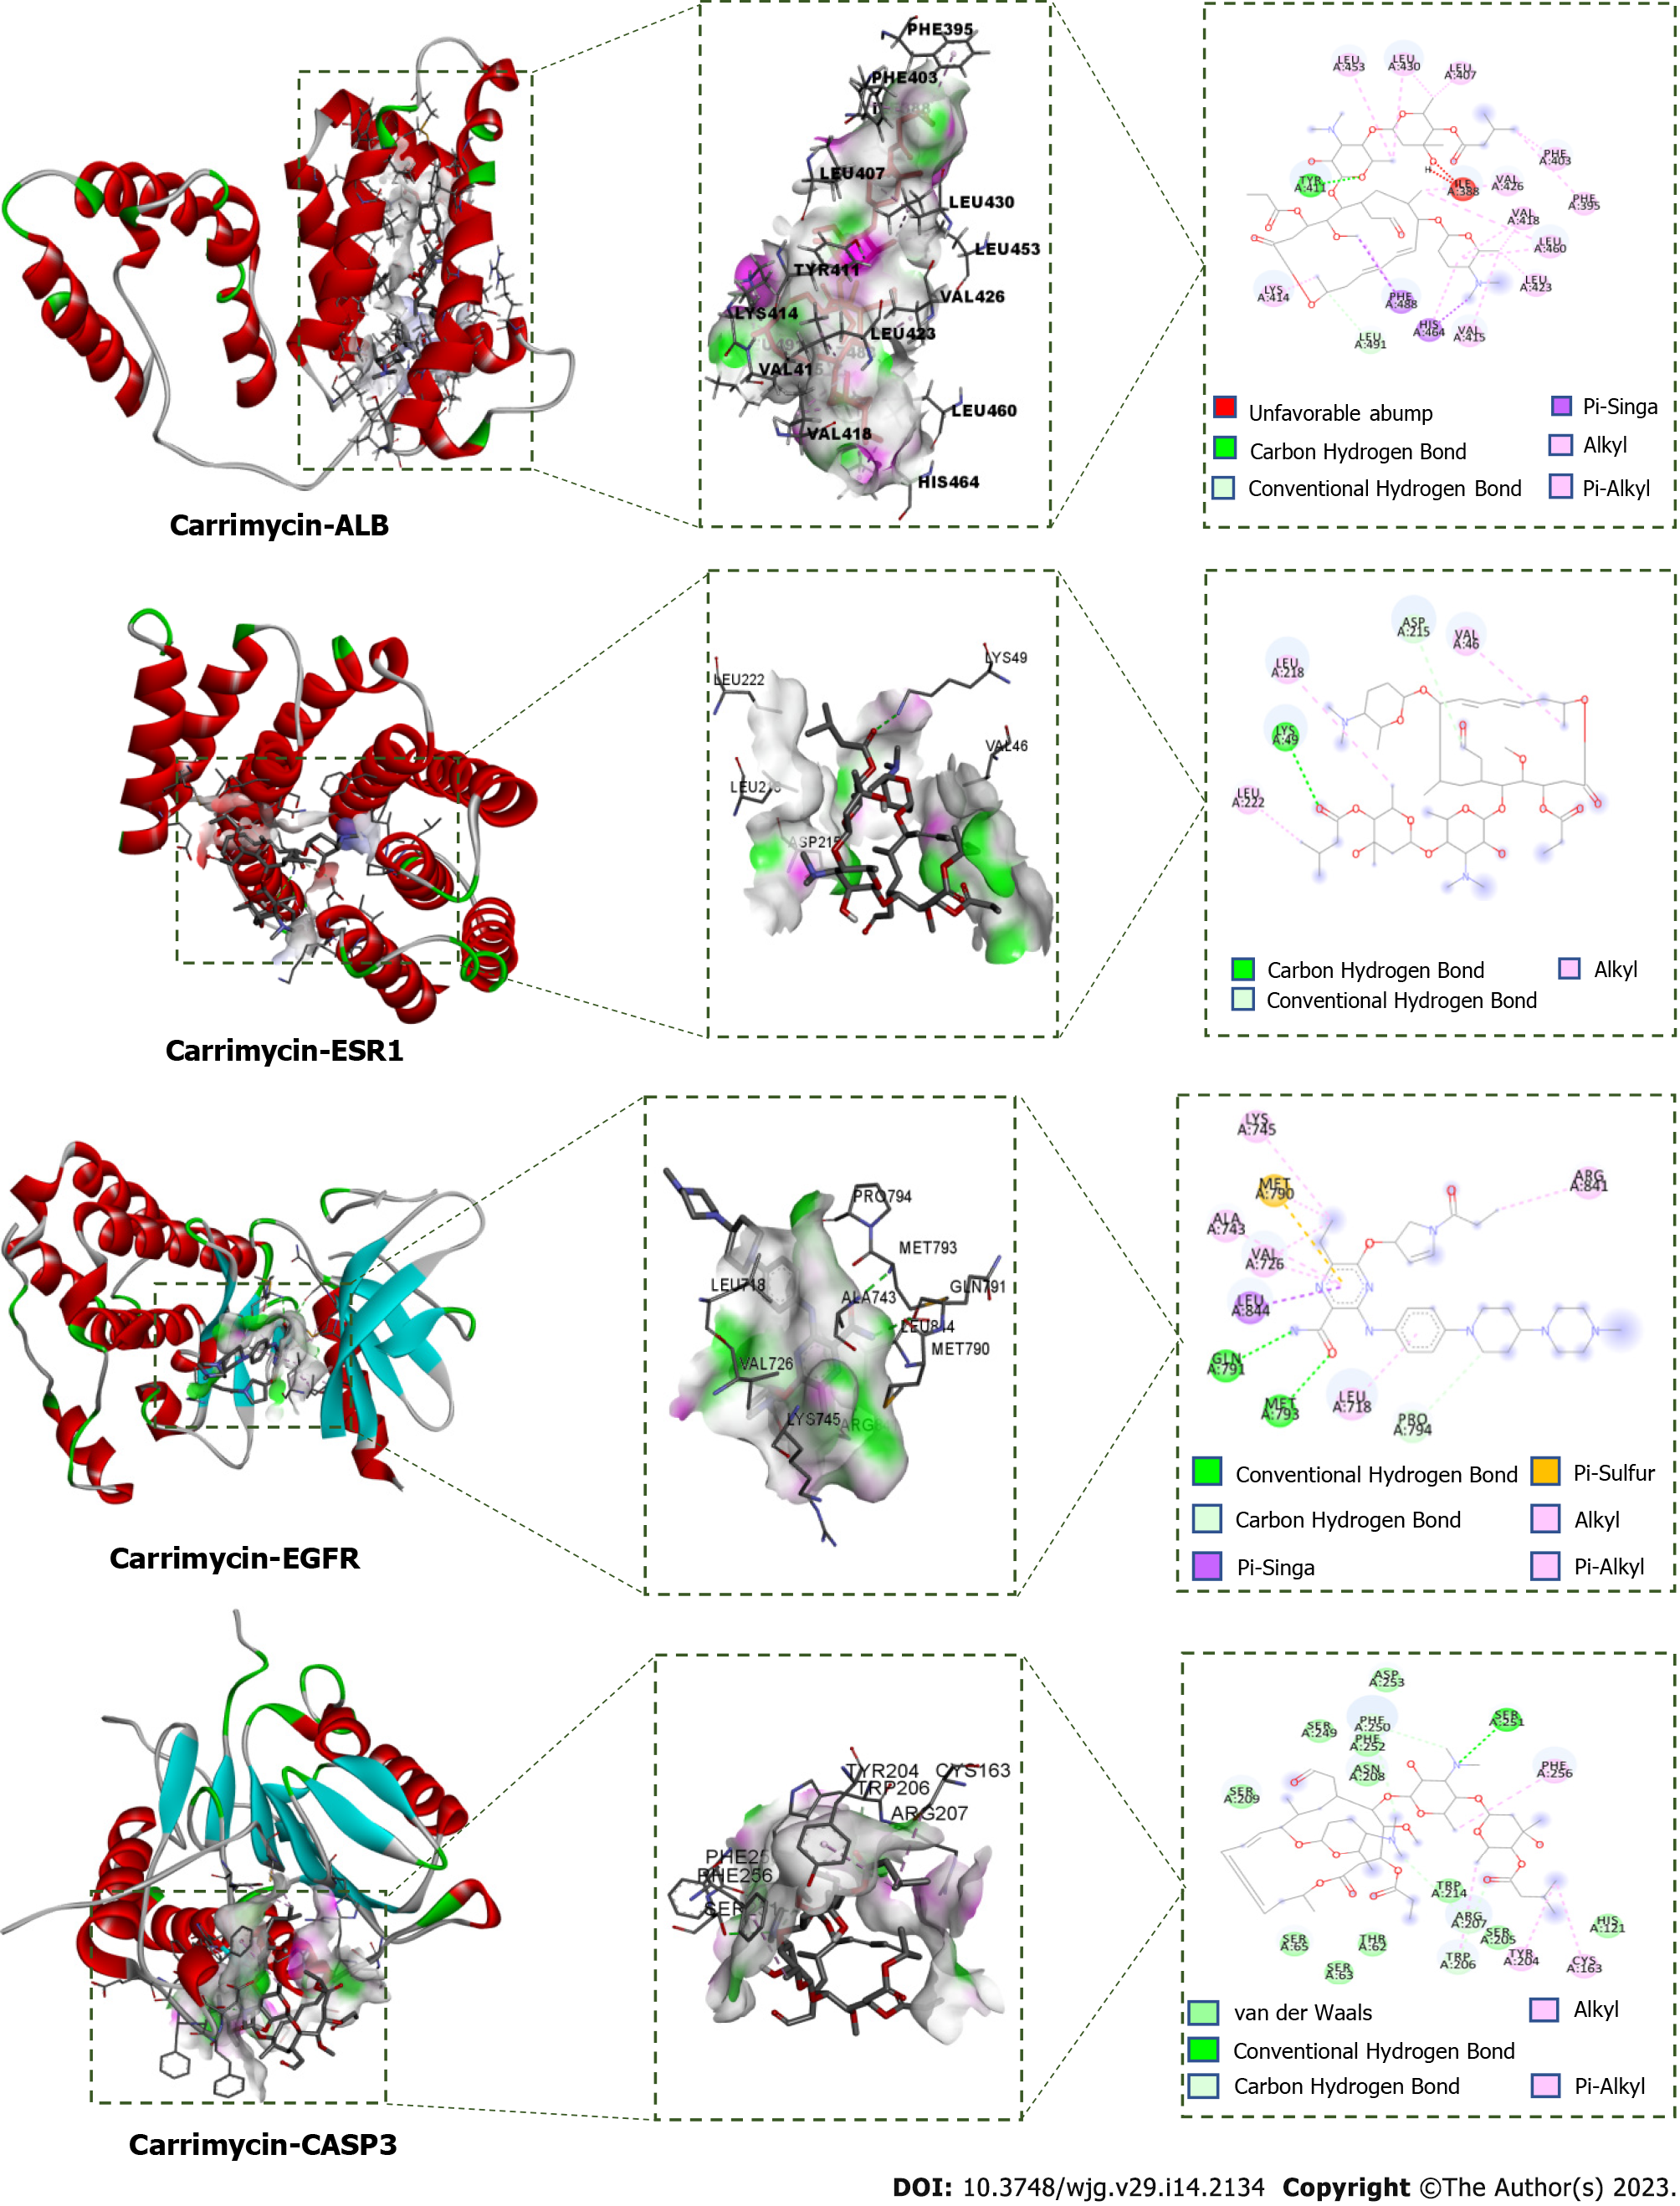
Figure 10 Molecular docking poses of the core targets in liver cancer.
In each of the docking simulations, hydrogen bonds were found between carrimycin and the four targets. The binding energies were all under -5, which suggested that the docking results were good and that the drug could bind to the target. ALB: Albumin; ESR1: Estrogen receptor 1; EGFR: Epidermal growth factor receptor; CASP3: Recombinant caspase 3.
- Citation: Li XY, Luo YT, Wang YH, Yang ZX, Shang YZ, Guan QX. Anti-inflammatory effect and antihepatoma mechanism of carrimycin. World J Gastroenterol 2023; 29(14): 2134-2152
- URL: https://www.wjgnet.com/1007-9327/full/v29/i14/2134.htm
- DOI: https://dx.doi.org/10.3748/wjg.v29.i14.2134


