Copyright
©The Author(s) 2023.
World J Gastroenterol. Mar 21, 2023; 29(11): 1721-1734
Published online Mar 21, 2023. doi: 10.3748/wjg.v29.i11.1721
Published online Mar 21, 2023. doi: 10.3748/wjg.v29.i11.1721
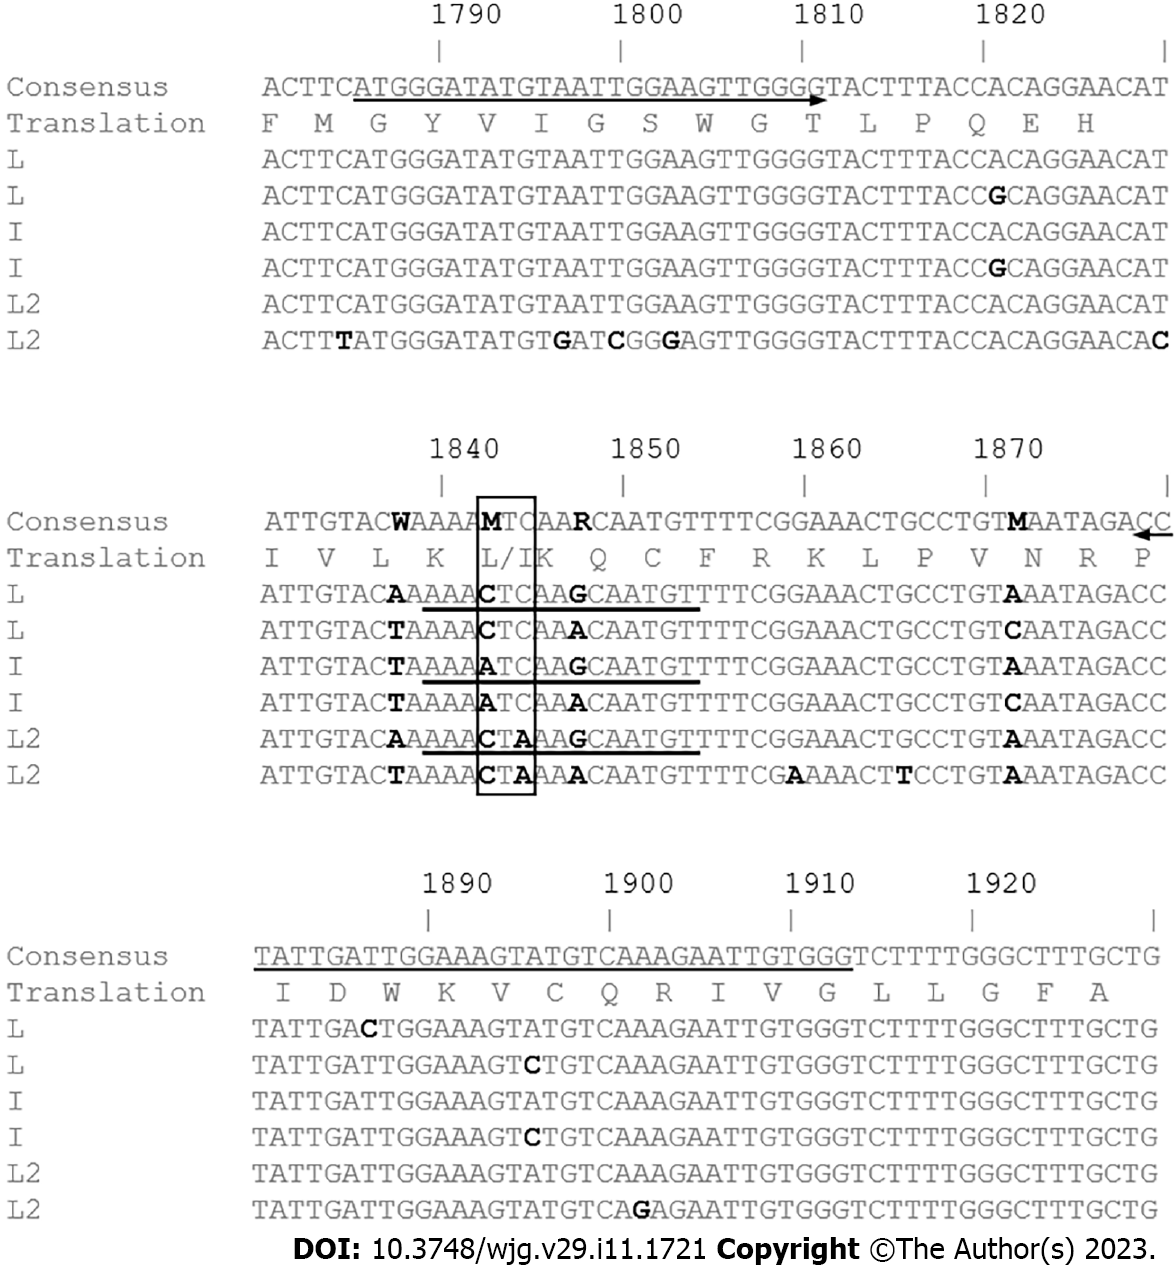
Figure 1 Primer and locked nucleic acid probe positions designed for the detection of three genotypes of polymorphisms in the rt269 codon, ‘L1’, ‘I’ and ‘L2’.
Arrows indicate the primer positions. Underlines indicate the probe positions. The numbers designate the nucleotide position on the hepatitis B virus P gene sequence. Boldface bases denote the different bases. The box represents the codon and amino acid sequences of rtL269 variants. This single nucleotide difference is the basis of their discriminative identification by locked nucleic acid probes in this study. The amino acid sequence is shown as one-letter amino acid symbols.
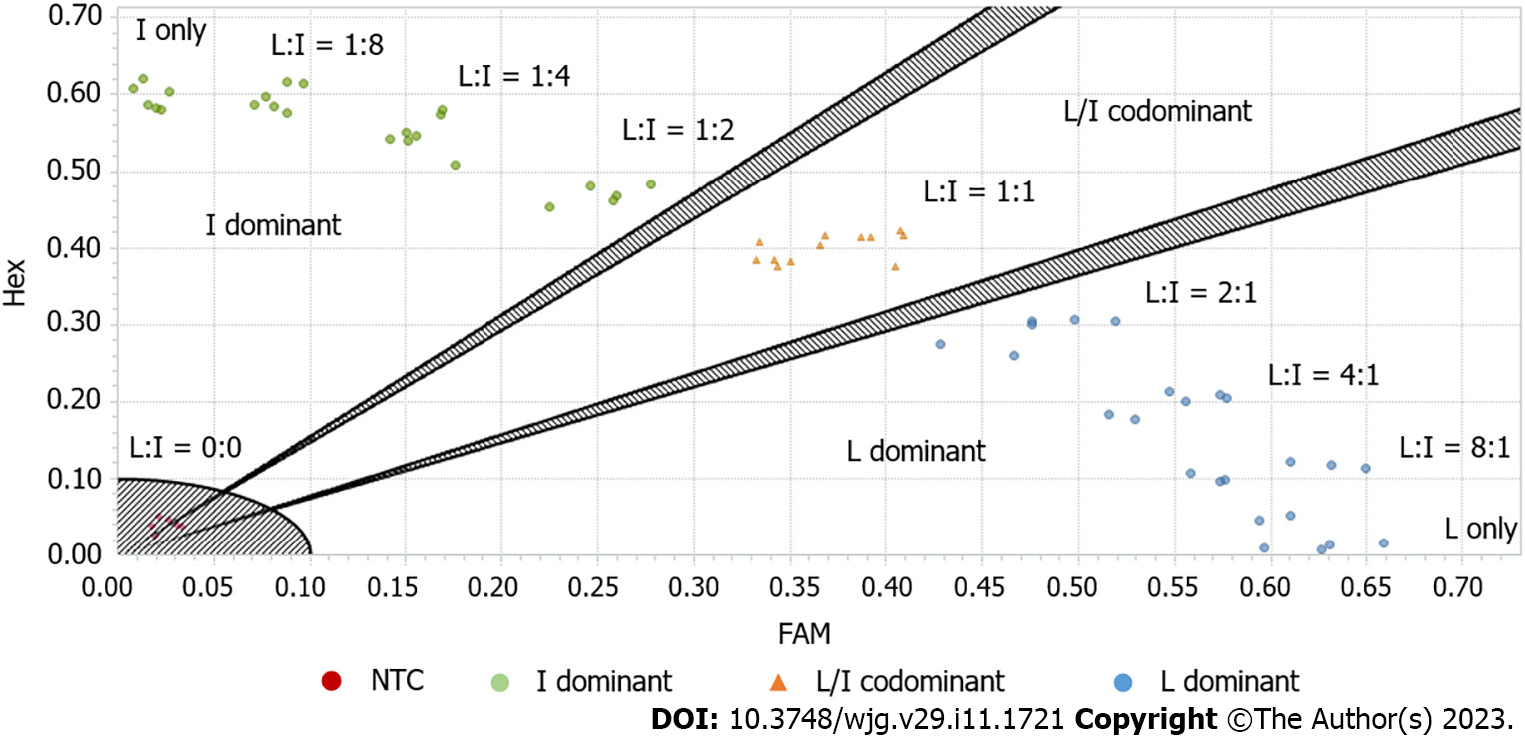
Figure 2 Differentiation of dominant hepatitis B virus rtL269 genotype variants using an endpoint genotyping method (LC96 software).
L plus I genotype mixtures were prepared with known amounts of the genotypes in various ratios. I-dominant mixtures were positioned closer to axis Hex with higher Hex-fluorescence values, whereas L-dominant ones were located closer to axis FAM with higher FAM-fluorescence values. NTC: Nontemplate control.
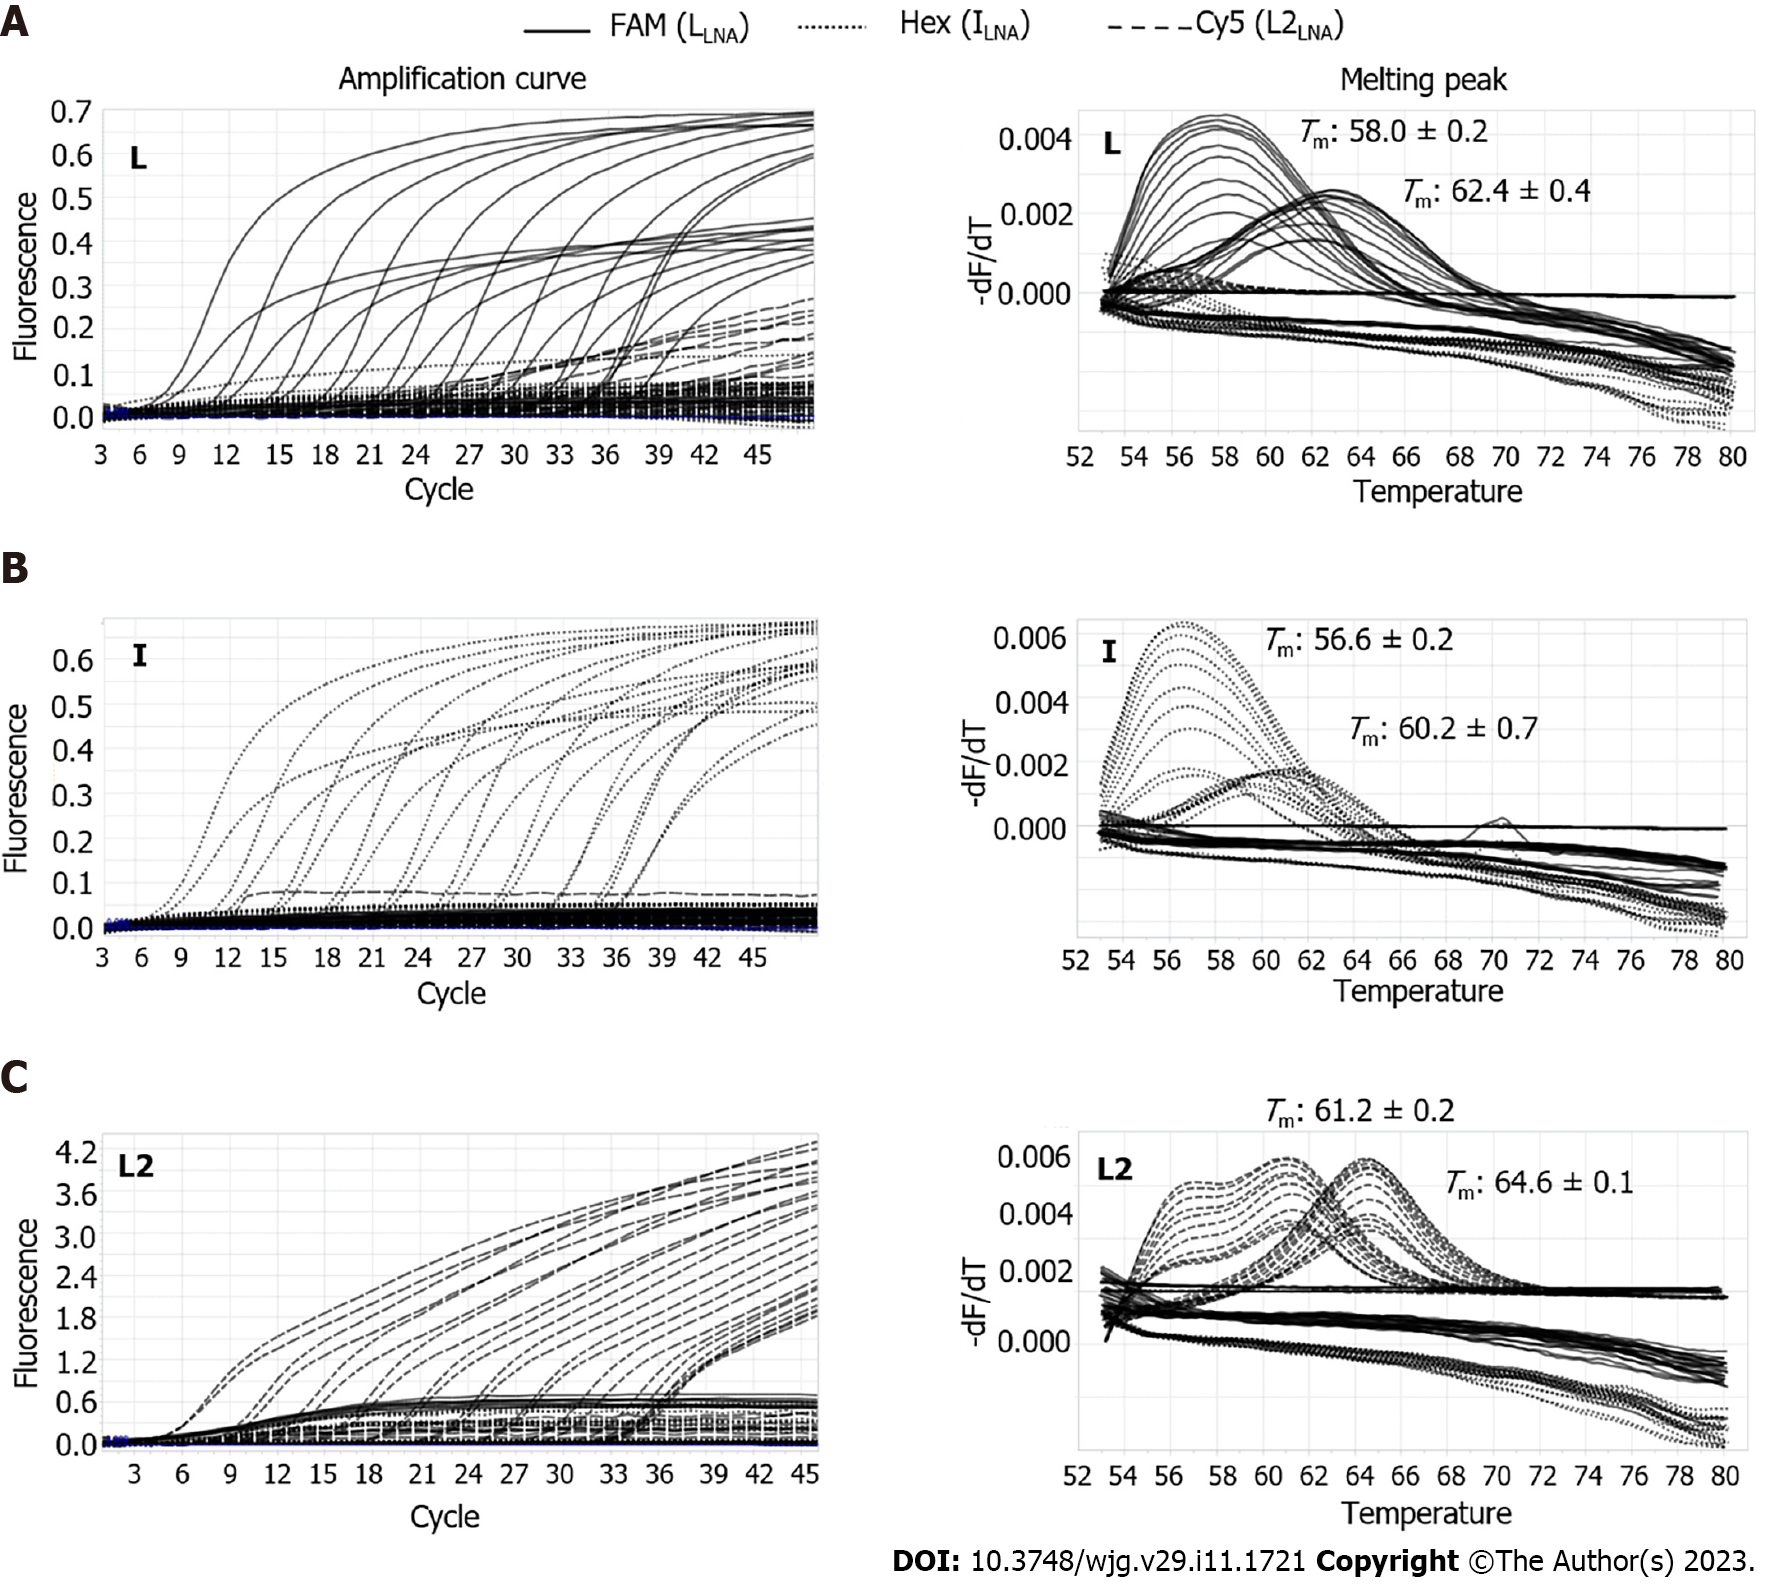
Figure 3 Multiprobe locked nucleic acid real-time polymerase chain reaction for discrimination among three types of polymorphisms in the rt269 codon.
Amplification curves are shown on the left, and melting peaks are shown on the right. A: With L1 wild-type DNA templates, L1-type specific signals in the FAM channel (solid) were detected, showing their dominant amplification and distinct melting temperatures (Tm), with minimal cross signals of amplification and melting peaks generated by weak cross hybridizations of the other probes (I and L2), which were differentiated from the Tm values for I and L2 detection; B: For I variant-type DNA templates, I-type specific signals in the Hex channel (dotted) were detected, showing their exclusive amplifications and distinct Tm values, with no cross signals; C: For L2 variant-type DNA templates, amplification curves showed weak cross signals, but melting peaks were distinct with no cross signals.
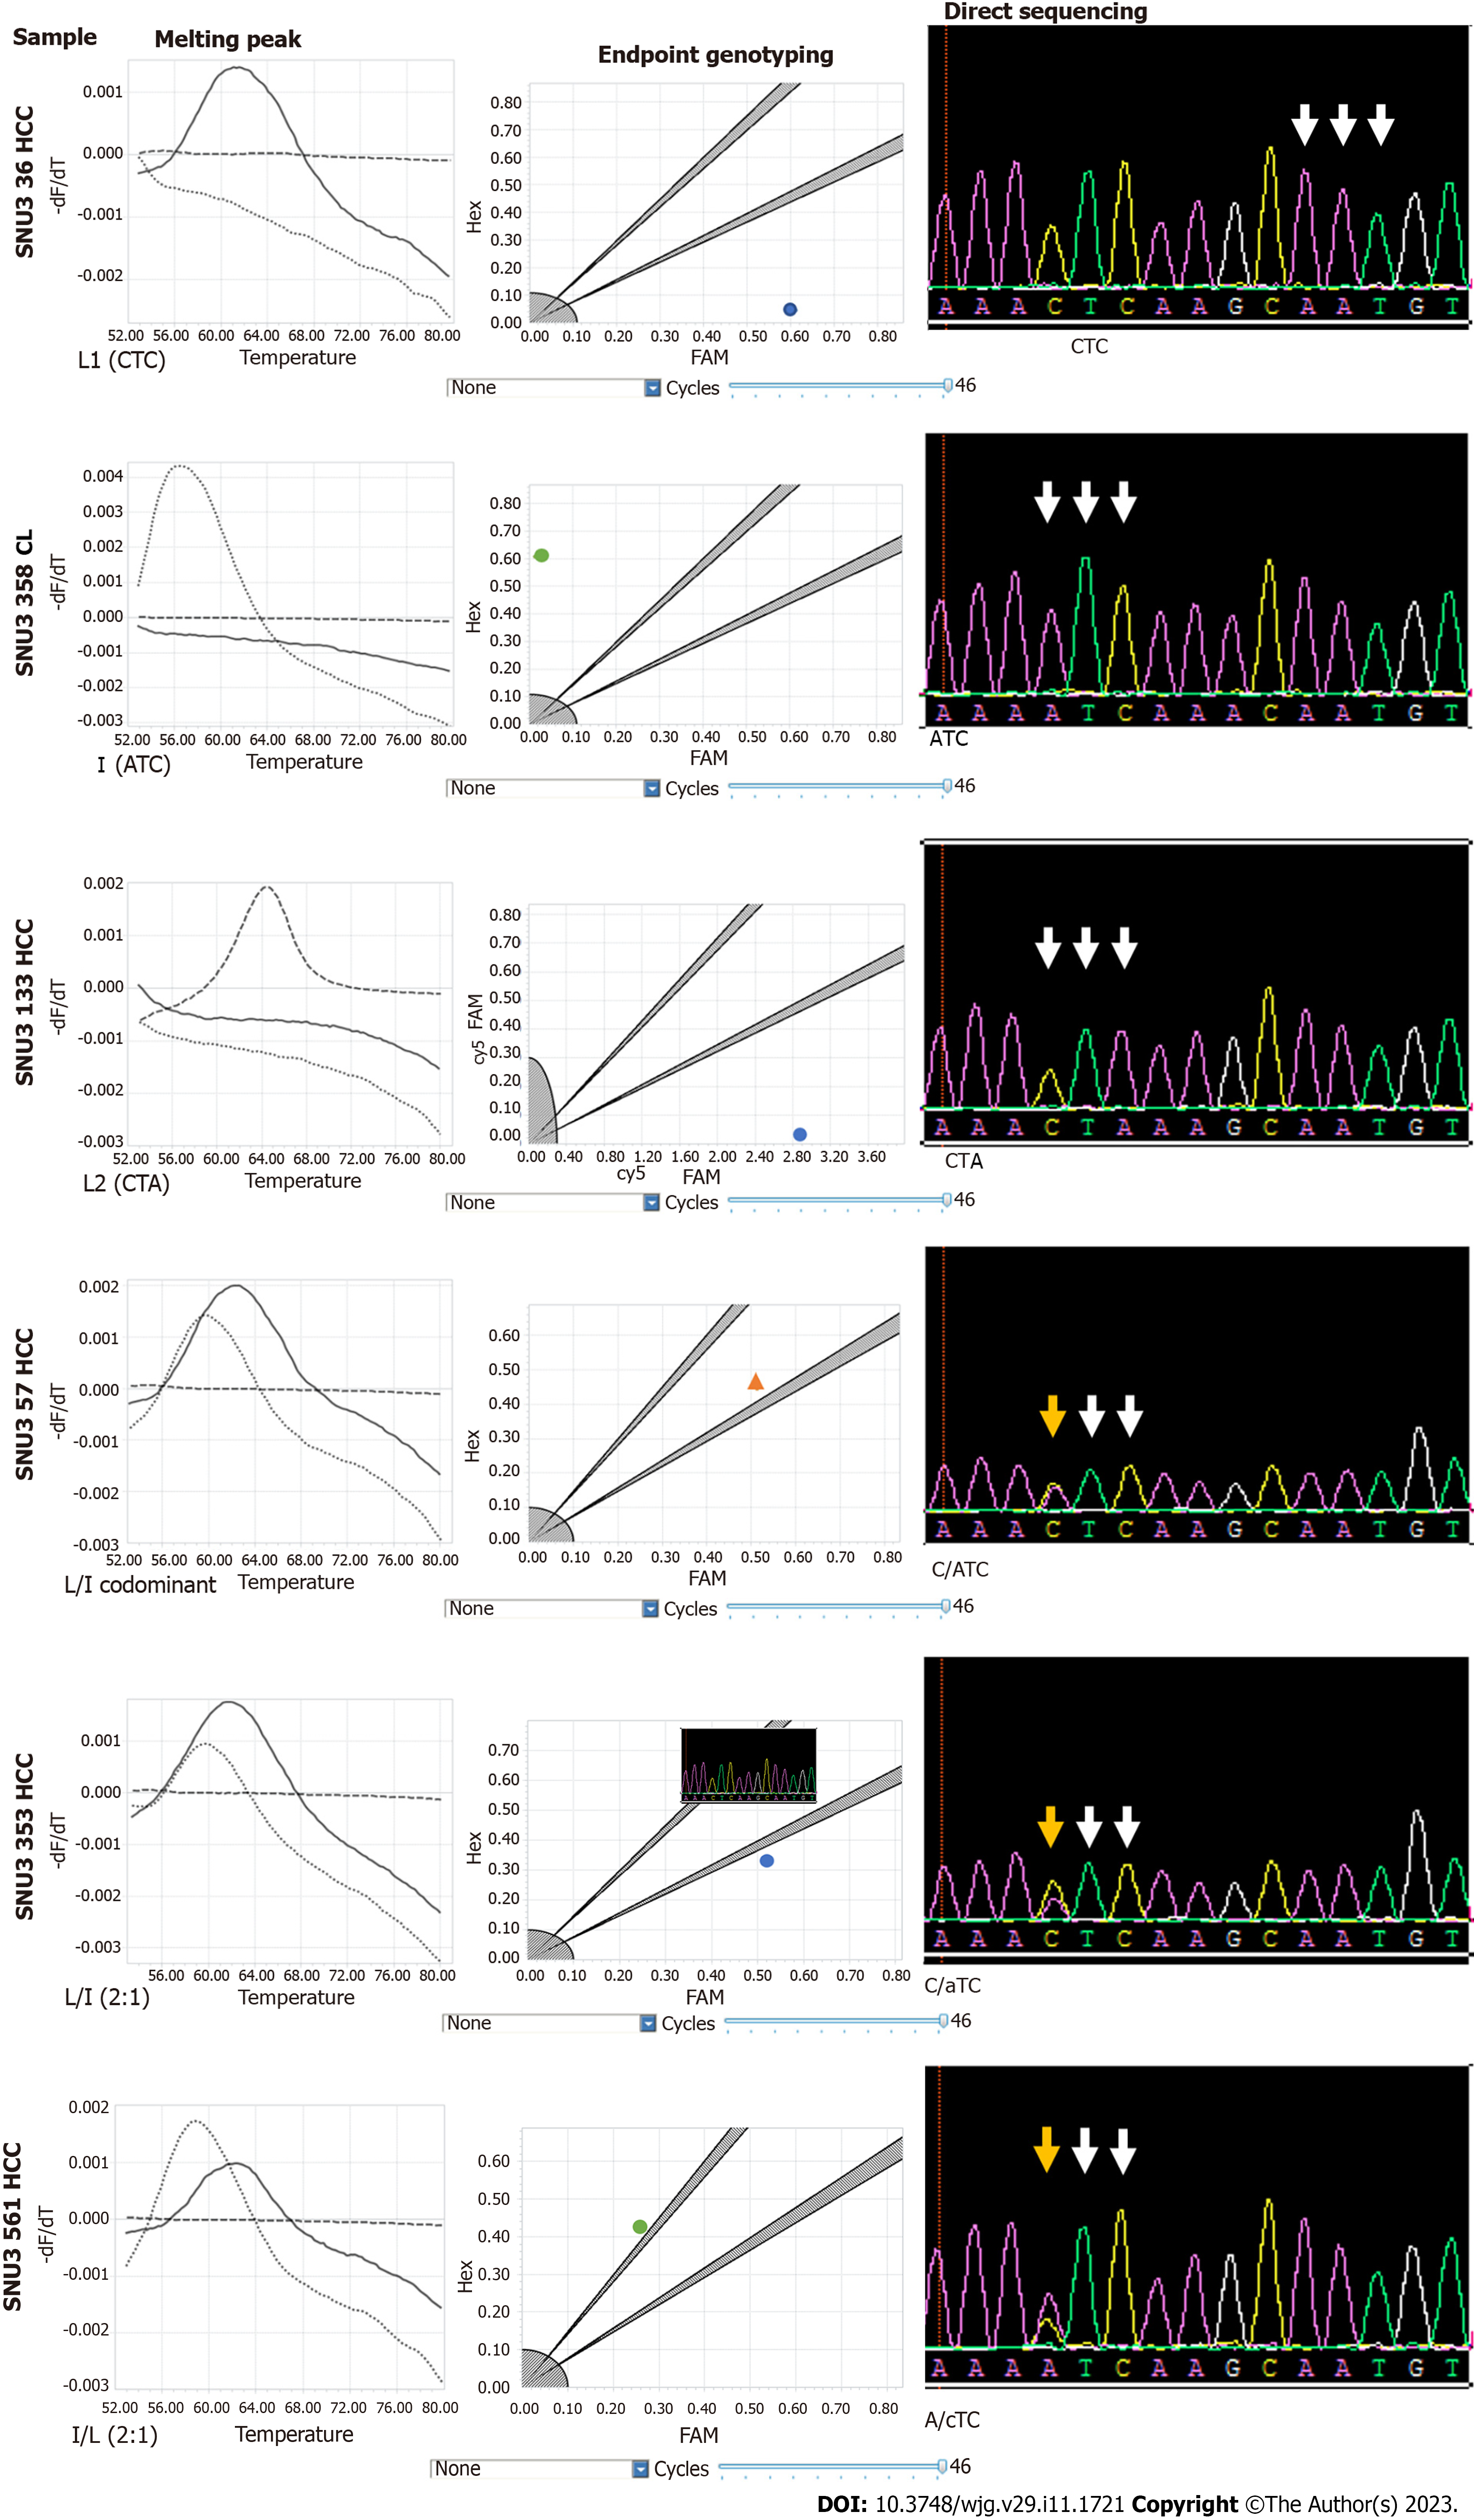
Figure 4 Confirmation of multiprobe locked nucleic acid real-time polymerase chain reaction identification results of hepatitis B virus rtL269 variants by direct sequencing.
Nucleotide bases are shown in the parentheses. Lowercase letters represent the base present in a lower amount relative to the dominant variant. Bold indicates the dominant amino acids and bases. Arrows represent the codon sequence positions for leucine or isoleucine; yellow, mixed bases.
- Citation: Kim K, Choi YM, Kim DH, Jang J, Choe WH, Kim BJ. Locked nucleic acid real-time polymerase chain reaction method identifying two polymorphisms of hepatitis B virus genotype C2 infections, rt269L and rt269I. World J Gastroenterol 2023; 29(11): 1721-1734
- URL: https://www.wjgnet.com/1007-9327/full/v29/i11/1721.htm
- DOI: https://dx.doi.org/10.3748/wjg.v29.i11.1721


