Copyright
©The Author(s) 2023.
World J Gastroenterol. Mar 21, 2023; 29(11): 1669-1684
Published online Mar 21, 2023. doi: 10.3748/wjg.v29.i11.1669
Published online Mar 21, 2023. doi: 10.3748/wjg.v29.i11.1669
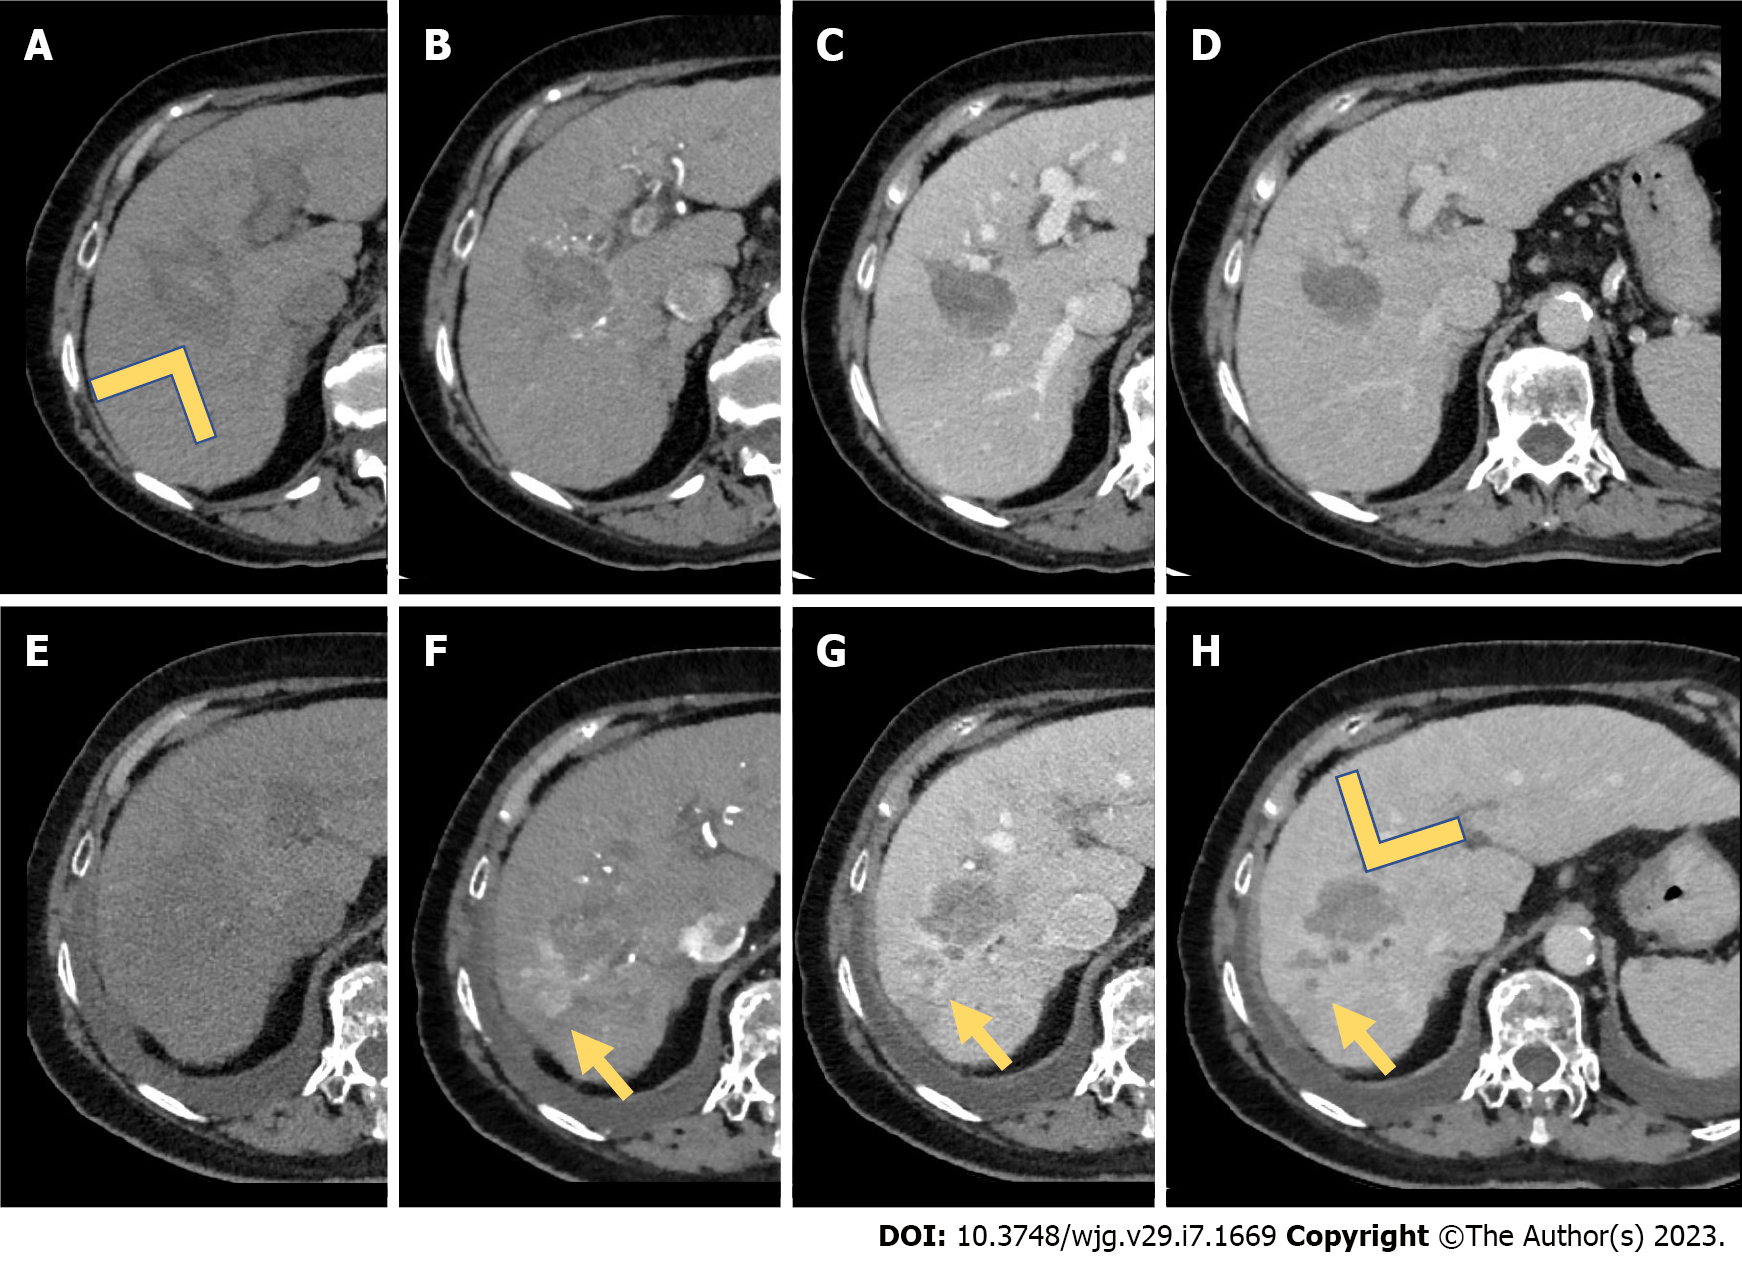
Figure 1 Computed tomography study for assessment of treatment response (after microwave ablation).
A: A 65-year-old male underwent microwave ablation of a hepatocellular carcinoma located in the V-VIII hepatic segment. Computed tomography scans were acquired after 2 wk of treatment. A large hypoattenuating area in the unenhanced (arrowhead) phase located in the V-VIII hepatic segment represented the treatment zone; B-D: During the dynamic study, no enhancement during the arterial phase (B) was seen, underlying the complete treatment response. Also, during the portal venous phase (C) and delayed phase (D) no wash-out was seen; E-H: After 1 year, the area of treatment was less hypoattenuating in the unenhanced phase (E), with a pseudonodular peripheral area of hypervascularization during the arterial phase (F, yellow arrow), with a wash-out during the portal venous and delayed phases (G and H, yellow arrow). On the other hand, the area of treatment did not show any arterial phase hyperenhancement or wash-out (H, arrowhead). The final diagnosis was hepatocellular carcinoma recurrence after microwave ablation (yellow arrows).
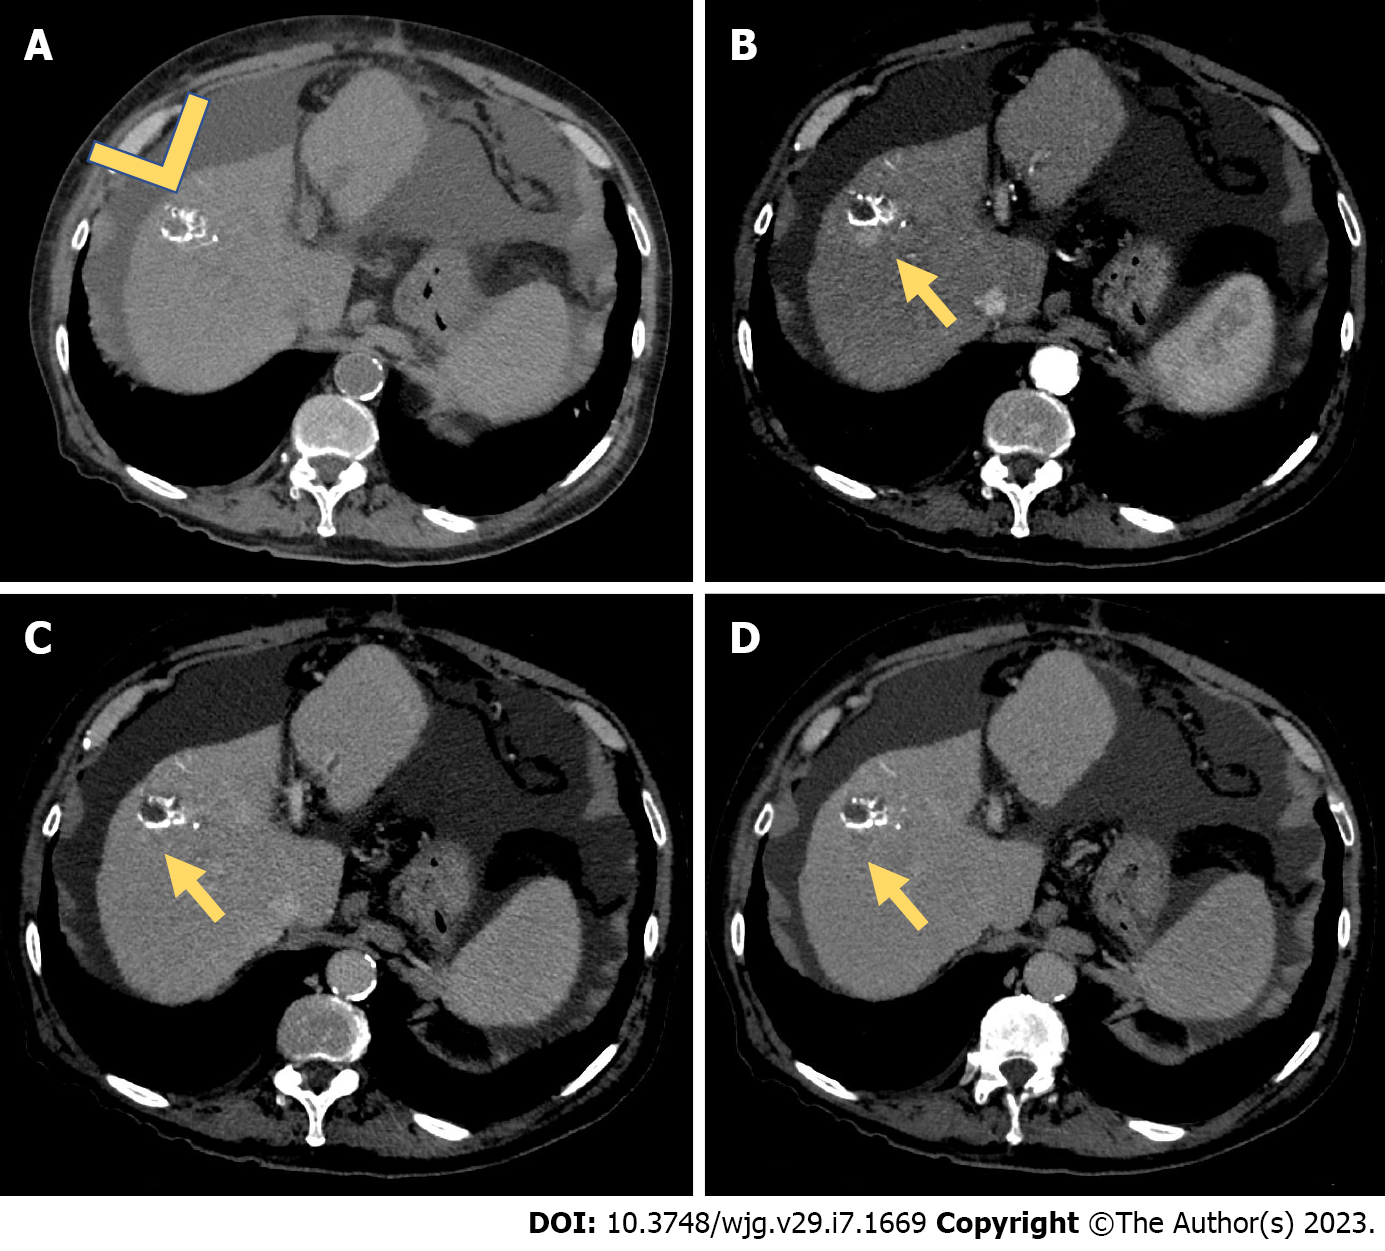
Figure 2 Computed tomography study for assessment of treatment response (after transarterial chemoembolization).
A: A 55-year-old male underwent conventional transarterial chemoembolization of a hepatocellular carcinoma lesion located in the VIII hepatic segment. Two years after treatment, a computed tomography scan showed areas of hyperattenuating components in the unenhanced phase (A), representing the ethiodized oil (arrowhead); B-D: During the arterial (B) phase, a pseudonodular area of hypervascularization during the arterial phase (B, yellow arrow) was seen, with a slight hypoattenuating appearance during the portal venous phase (C) and a clear washout during the delayed phase (D). This represents an example of recurrent hepatocellular carcinoma after transarterial chemoembolization.
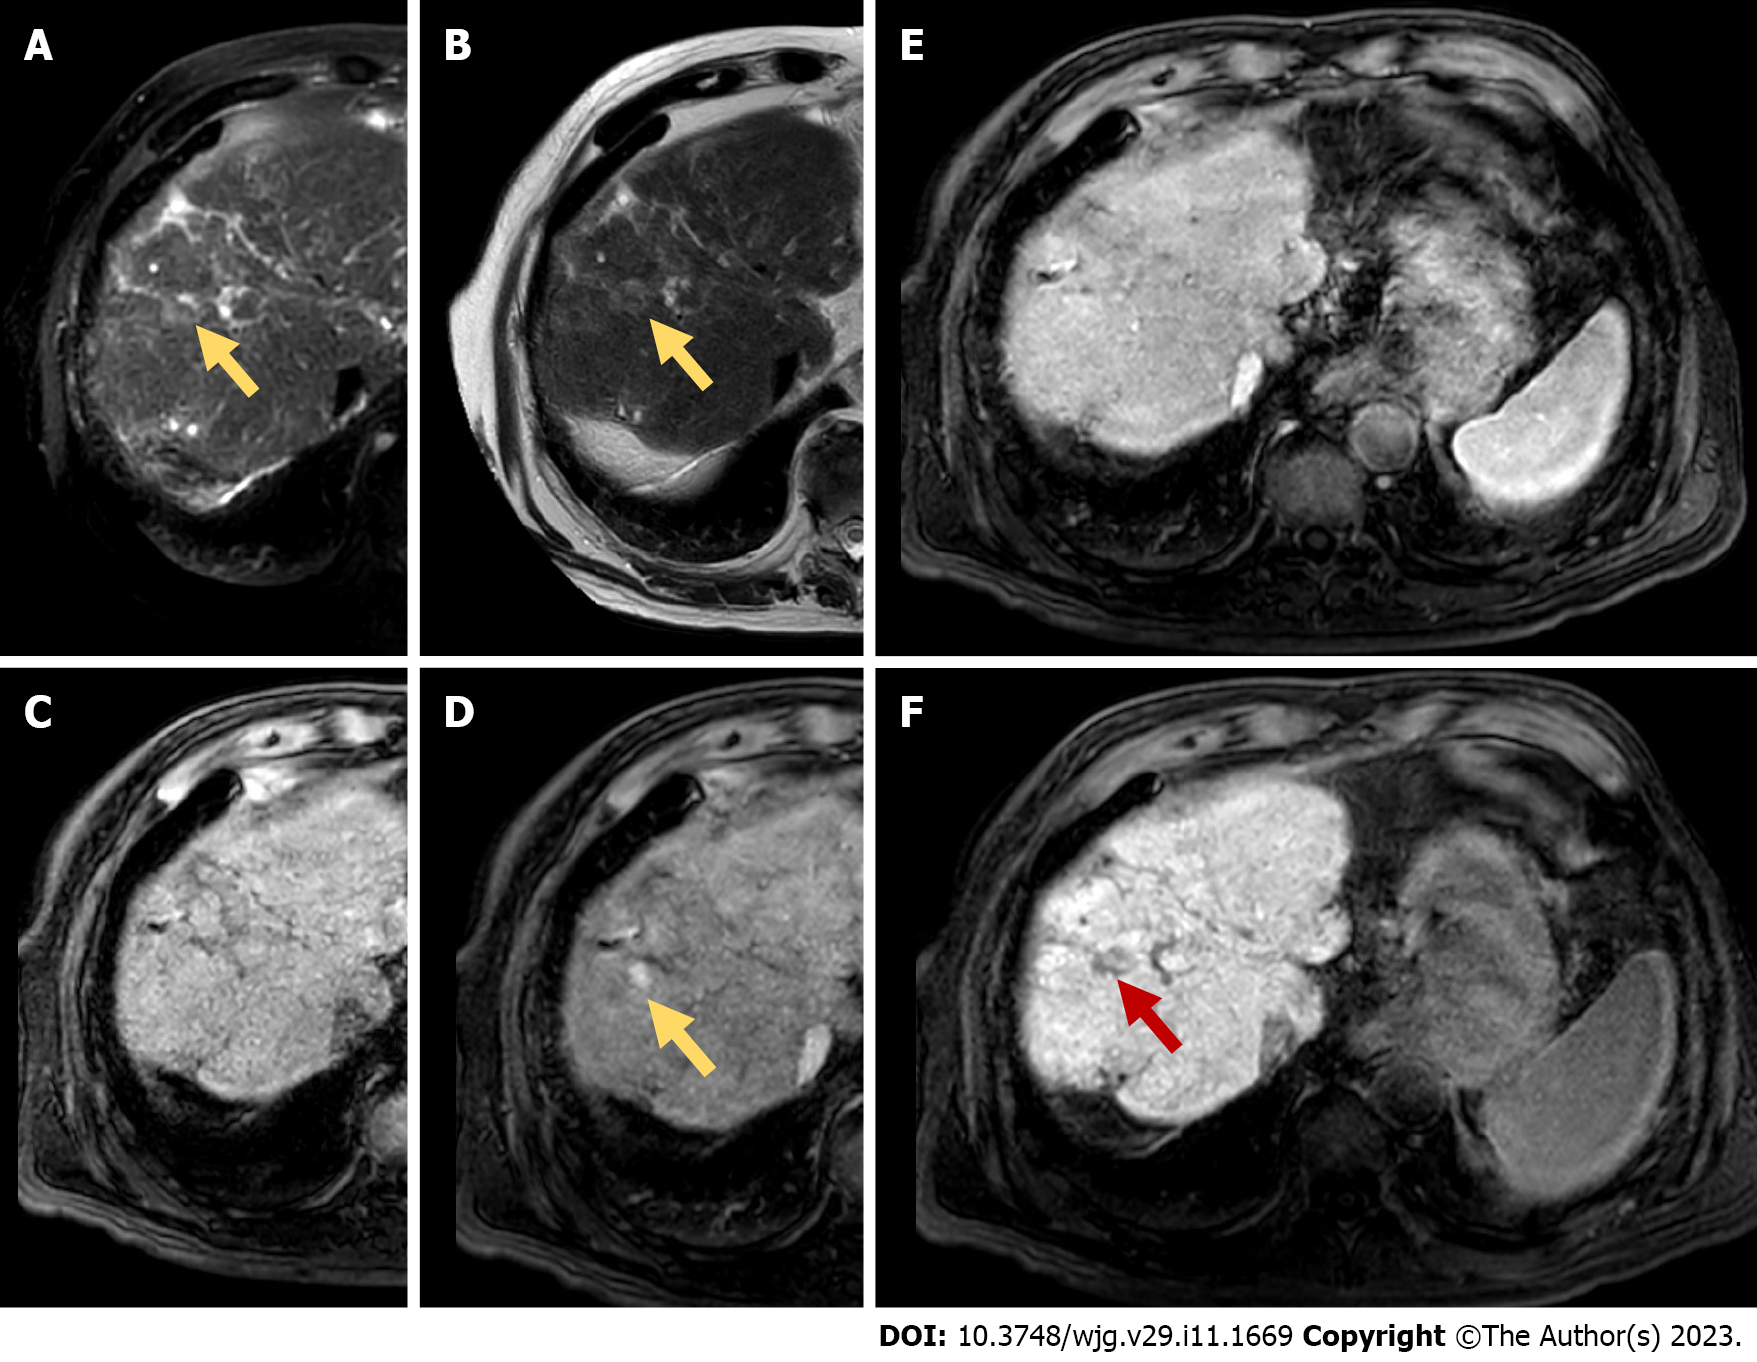
Figure 3 Magnetic resonance imaging follow-up study with GD-EOB-DTPA for assessment of treatment response (after transarterial chemoembolization and radiofrequency ablation).
A and B: A 70-year-old female underwent conventional transarterial chemoembolization-radiofrequency ablation of a hepatocellular carcinoma lesion located in the VIII hepatic segment. Eighteen months after treatment, confluent areas of hyperintense signal on T2 weighted imaging, with and without fat saturation, represented fibrosis. In this context a small slightly hyperintense nodular lesion was seen on T2 weighted imaging (T2 and T2 fs, yellow arrows); C-F: This lesion was isointense to the liver parenchyma in the unenhanced phase (C), with a non-peripheral wash-in appearance during the arterial phase (D), isointense during the portal venous phase (E), and hypointense during the hepatobiliary phase acquired after 20 min of Gd-EOB-DTPA administration (F). The final diagnosis was recurrent hepatocellular carcinoma after transarterial chemoembolization-radiofrequency ablation.
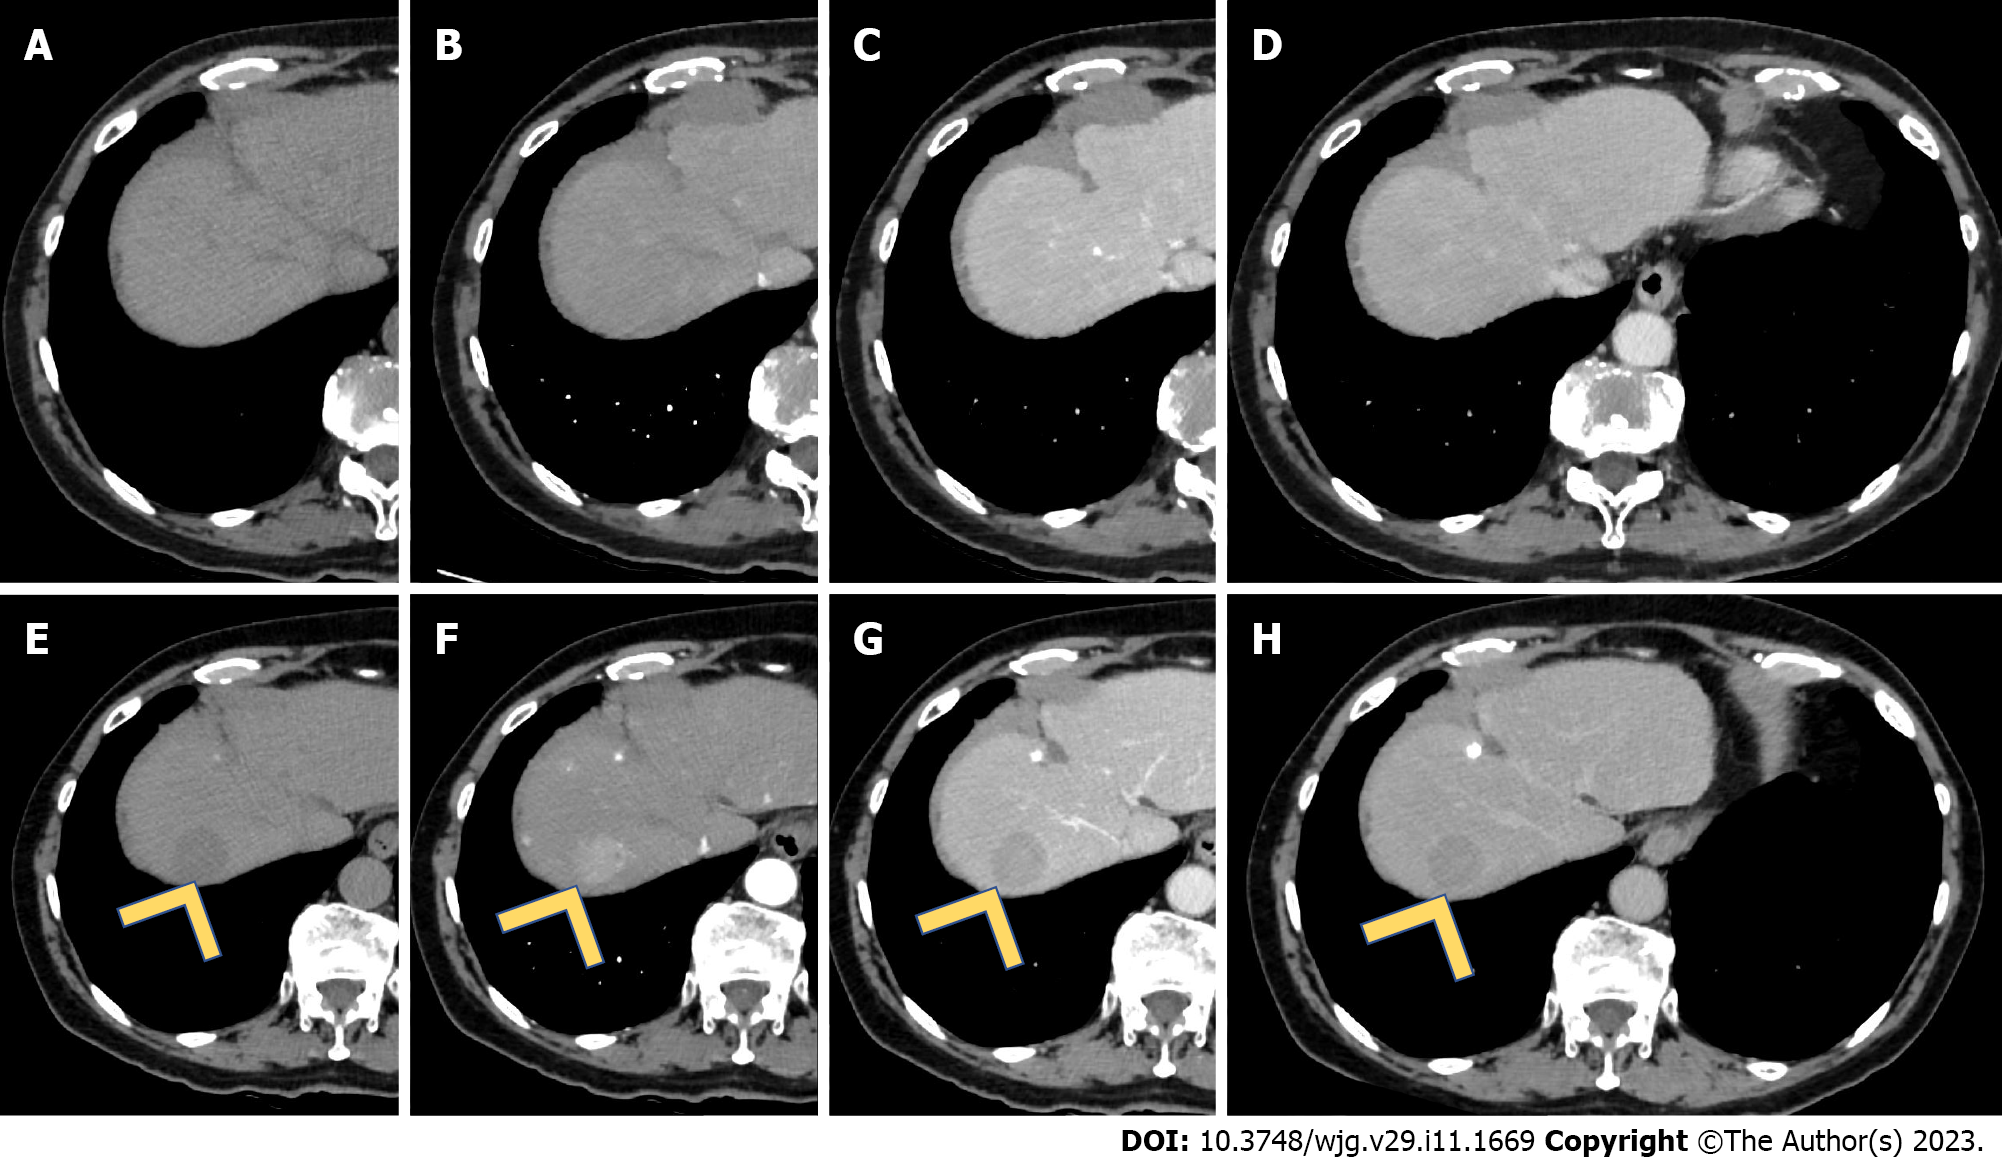
Figure 4 Multiphasic computed tomography study for assessment of treatment response (after sorafenib).
A-D: A 66-year-old female underwent conventional medical therapy (sorafenib) for an advanced hepatocellular carcinoma (HCC) lesion. Computed tomography images represented the complete response to the medical therapy, with no areas or nodular lesions suspected for HCC; E-H: During the follow-up, 2 years after completion of therapy, a nodular hypoattenuating lesion in the unenhanced phase (E) appeared in the VII hepatic segment. This lesion had similar features of primary HCC, with non-rim hyperenhancement during the arterial phase (F), wash-out during the portal venous phase (G) and delayed phase (H). This is an example of HCC recurrence after sorafenib.
- Citation: Ippolito D, Maino C, Gatti M, Marra P, Faletti R, Cortese F, Inchingolo R, Sironi S. Radiological findings in non-surgical recurrent hepatocellular carcinoma: From locoregional treatments to immunotherapy. World J Gastroenterol 2023; 29(11): 1669-1684
- URL: https://www.wjgnet.com/1007-9327/full/v29/i11/1669.htm
- DOI: https://dx.doi.org/10.3748/wjg.v29.i11.1669


