Copyright
©The Author(s) 2022.
World J Gastroenterol. Mar 7, 2022; 28(9): 918-932
Published online Mar 7, 2022. doi: 10.3748/wjg.v28.i9.918
Published online Mar 7, 2022. doi: 10.3748/wjg.v28.i9.918
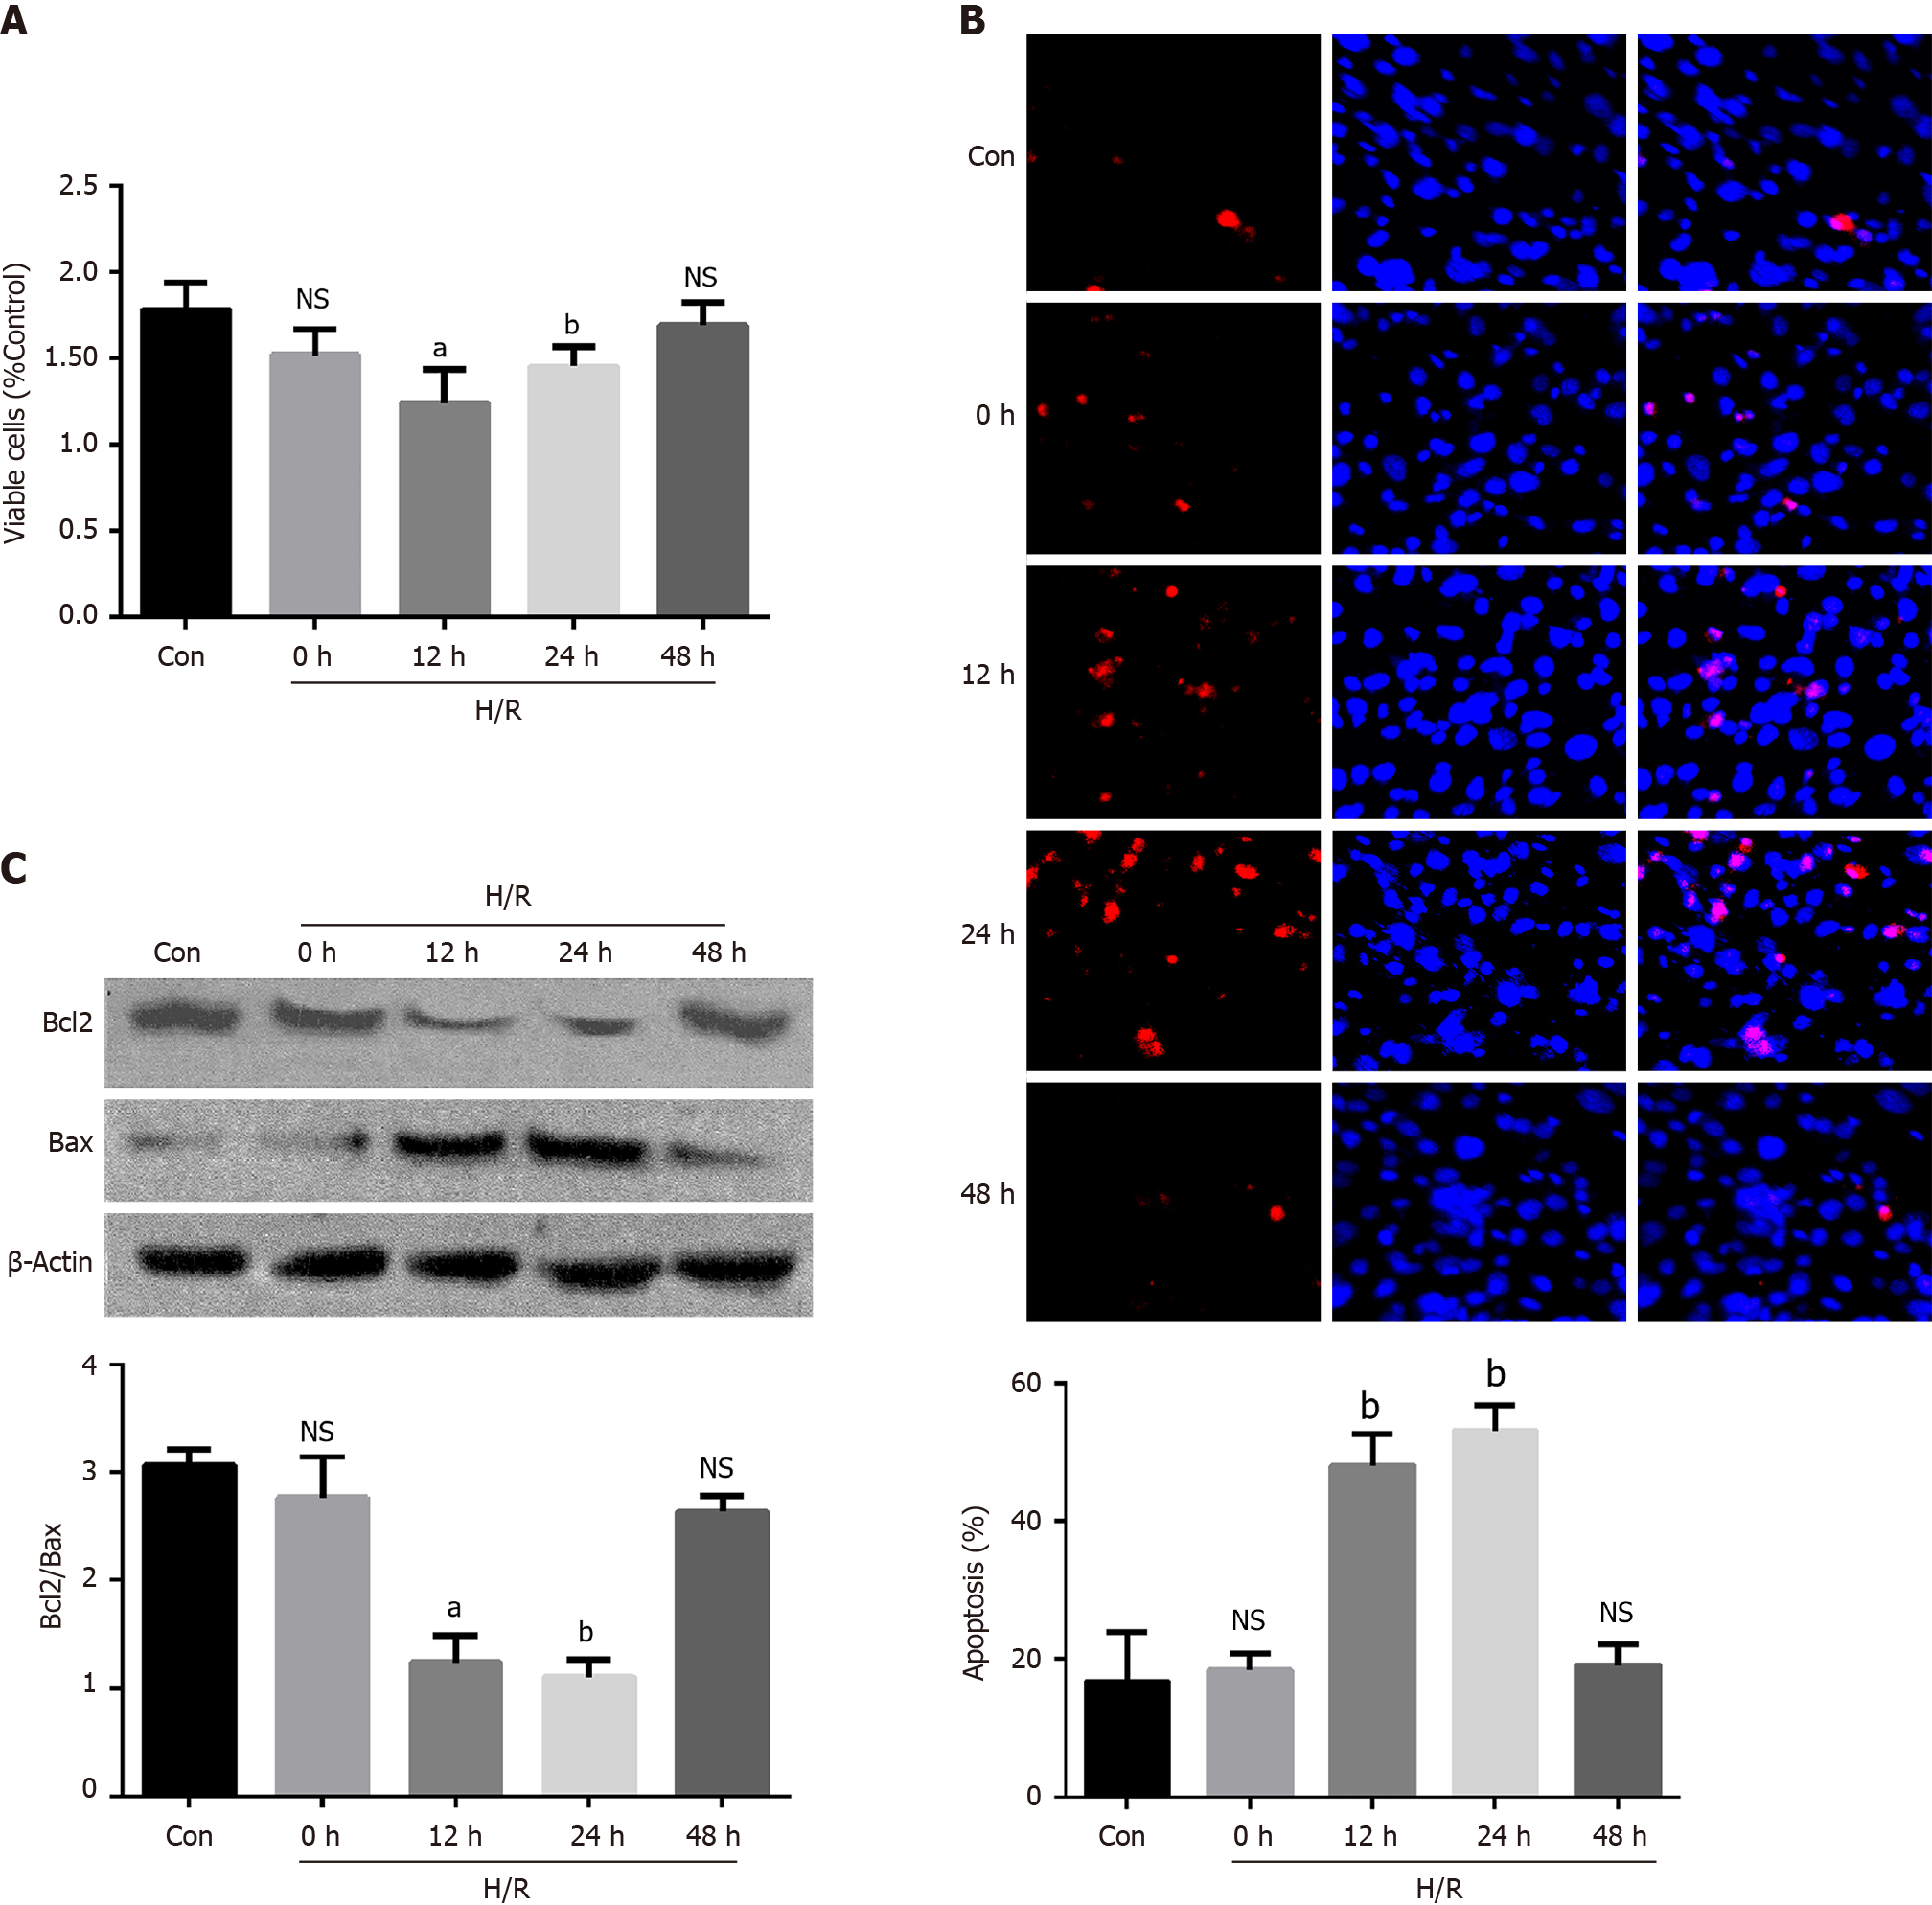
Figure 1 Apoptosis was induced in Caco2 cells after hypoxia/reoxygenation treatment.
A: Cell viability was tested using the CCK8 kit on different times after the hypoxia/reoxygenation (H/R) treatment, aP < 0.01 and bP < 0.001 vs control (n = 3); B: The quantification data of apoptosis tested by the TUNEL at different times after the H/R treatment, bP < 0.001 vs control (n = 3); C: Representative Western blotting and quantification data for cell apoptotic proteins Bcl-2 and Bax at different times after the H/R treatment. Data are presented as mean ± SD, aP < 0.01 and bP < 0.001 vs control (n = 3). NS: No significant difference; H/R: Hypoxia/reoxygenation.
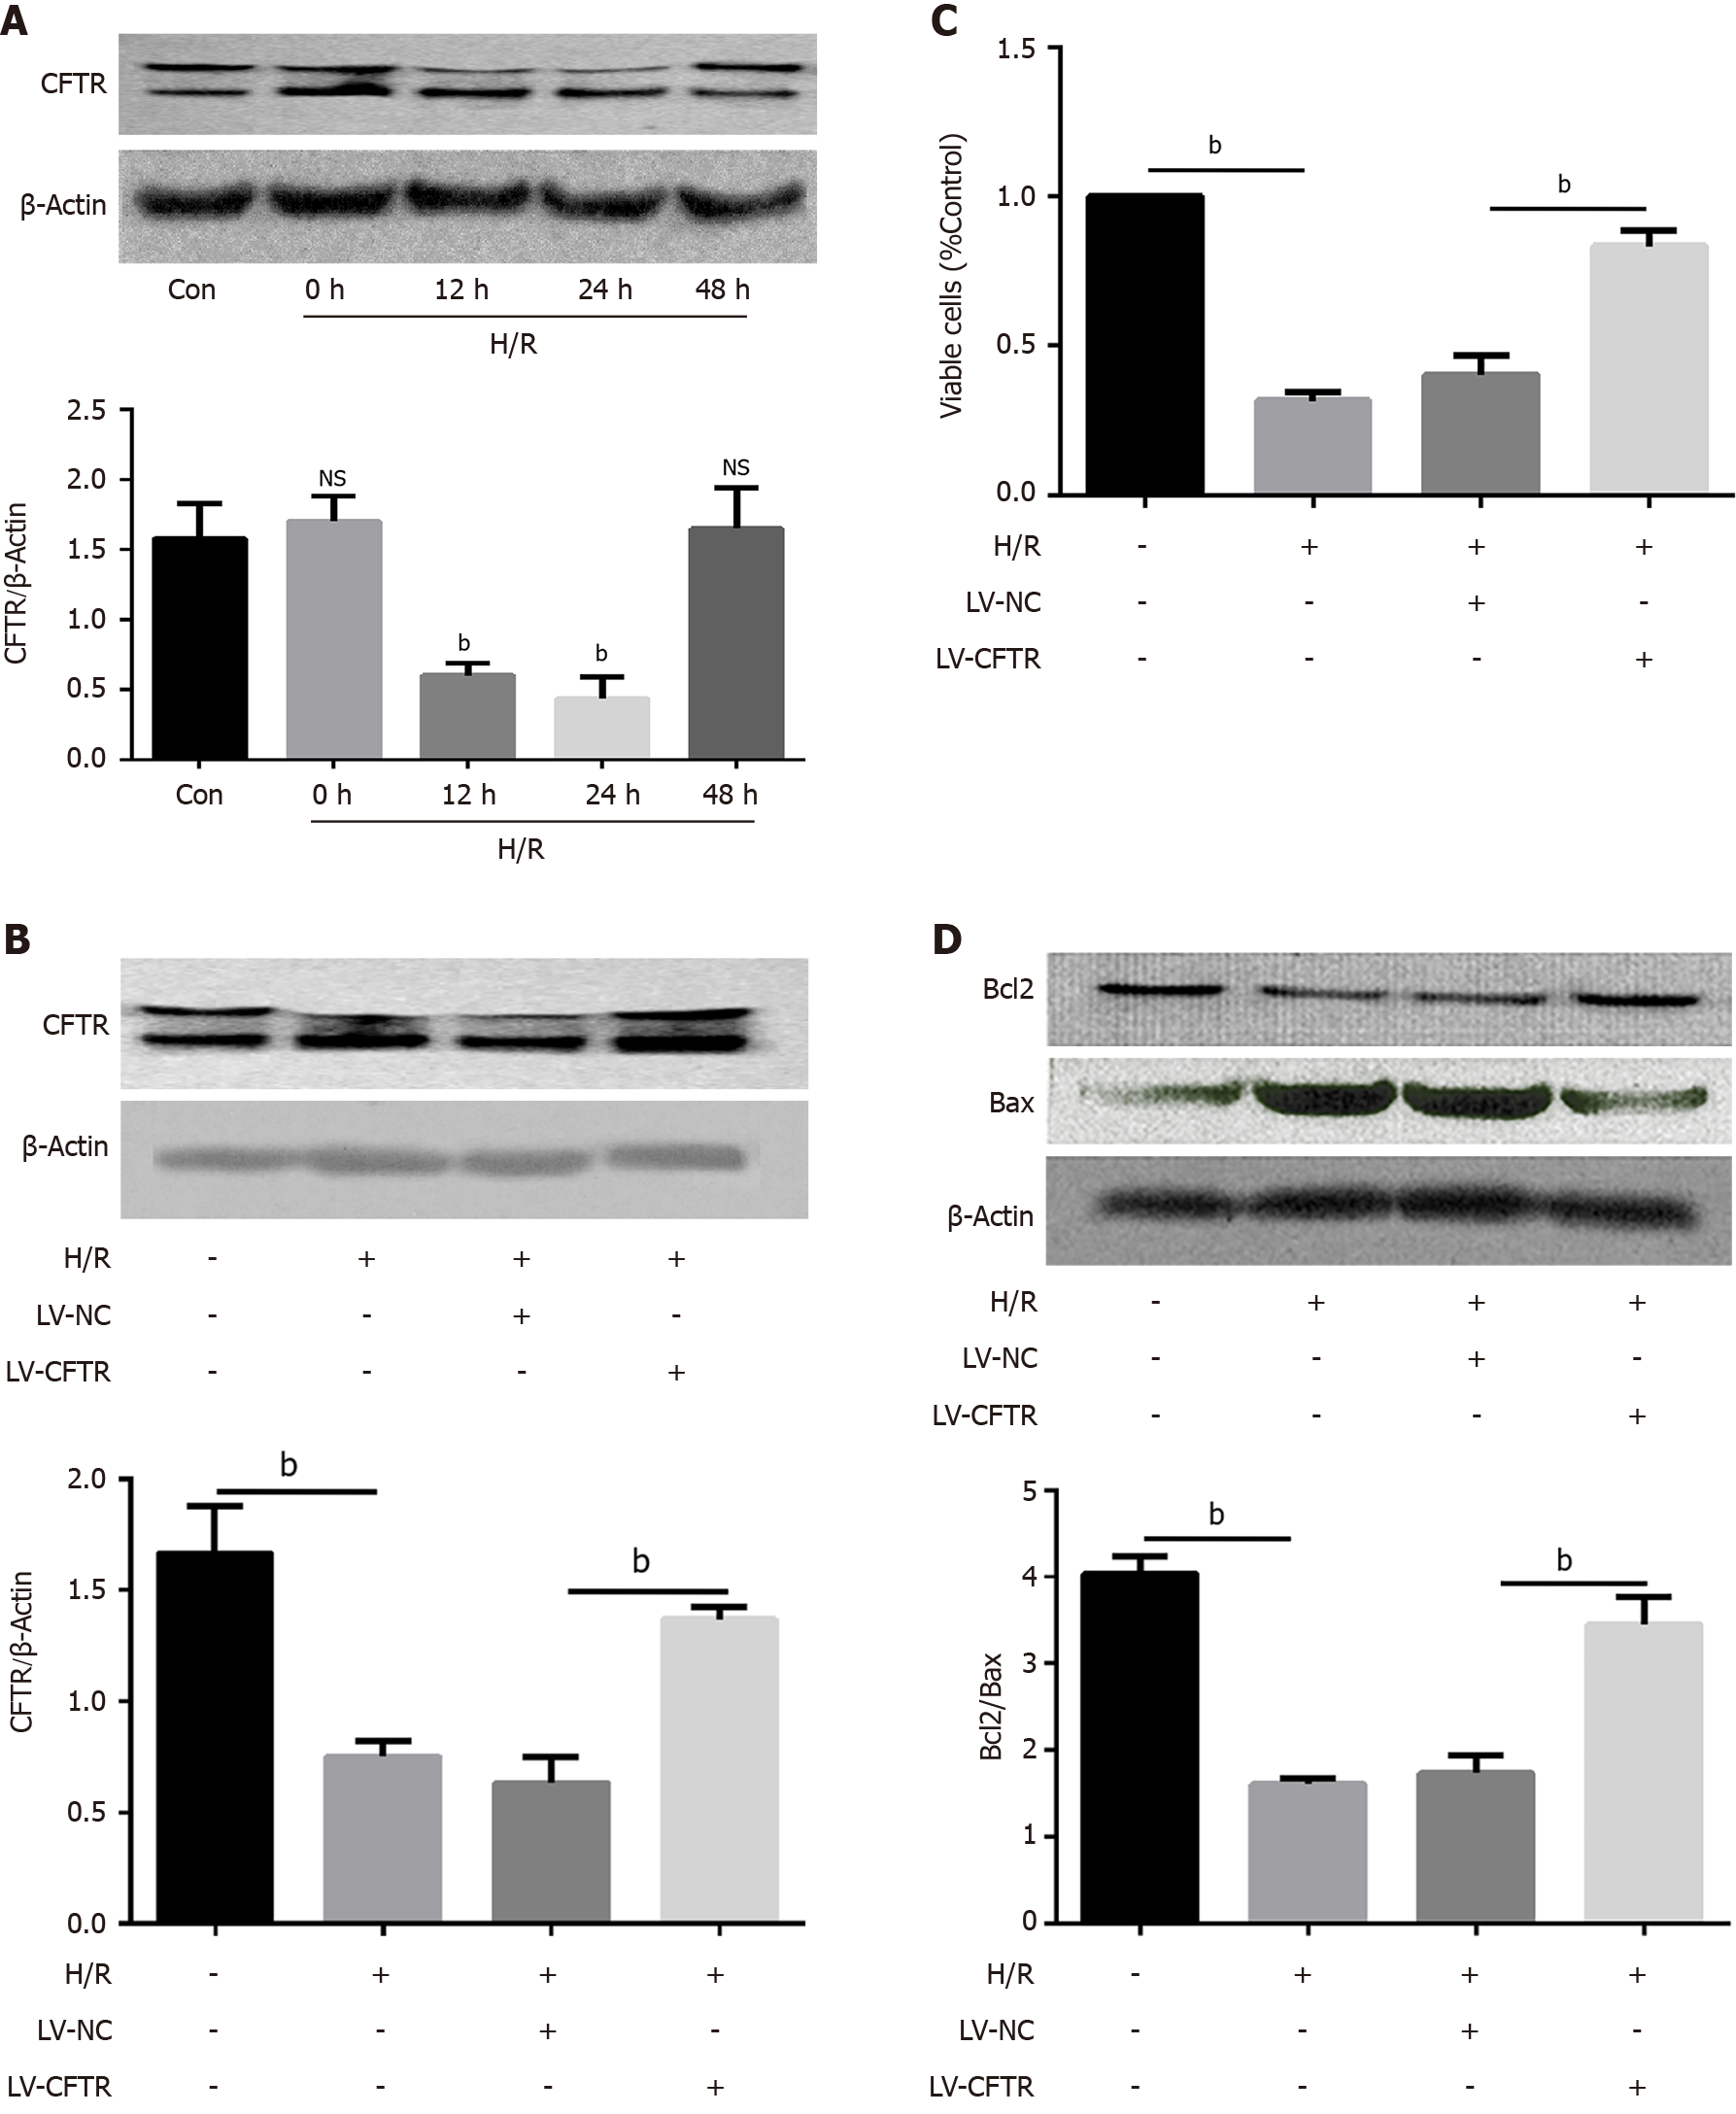
Figure 2 Cystic fibrosis transmembrane conductance regulator can protect the Caco2 cells from apoptosis induced by the hypoxia/reoxygenation.
A: Representative Western blotting and quantification data for cystic fibrosis transmembrane conductance regulator (CFTR) after the hypoxia/reoxygenation (H/R) treatment, bP < 0.001 vs control (n = 3); B: Representative Western blotting and quantification data for CFTR after the LV-CFTR transfection, bP < 0.001 vs control (n = 3); C: Cell viability was tested using the CCK8 kit after the LV-CFTR transfection, bP < 0.001 vs control (n = 3); D: Representative Western blotting and quantification data for cell apoptotic proteins Bcl-2 and Bax after the LV-CFTR transfection. Data are presented as mean ± SD. bP < 0.001 vs control (n = 3). CFTR: Cystic fibrosis transmembrane conductance regulator; H/R: Hypoxia/reoxygenation.
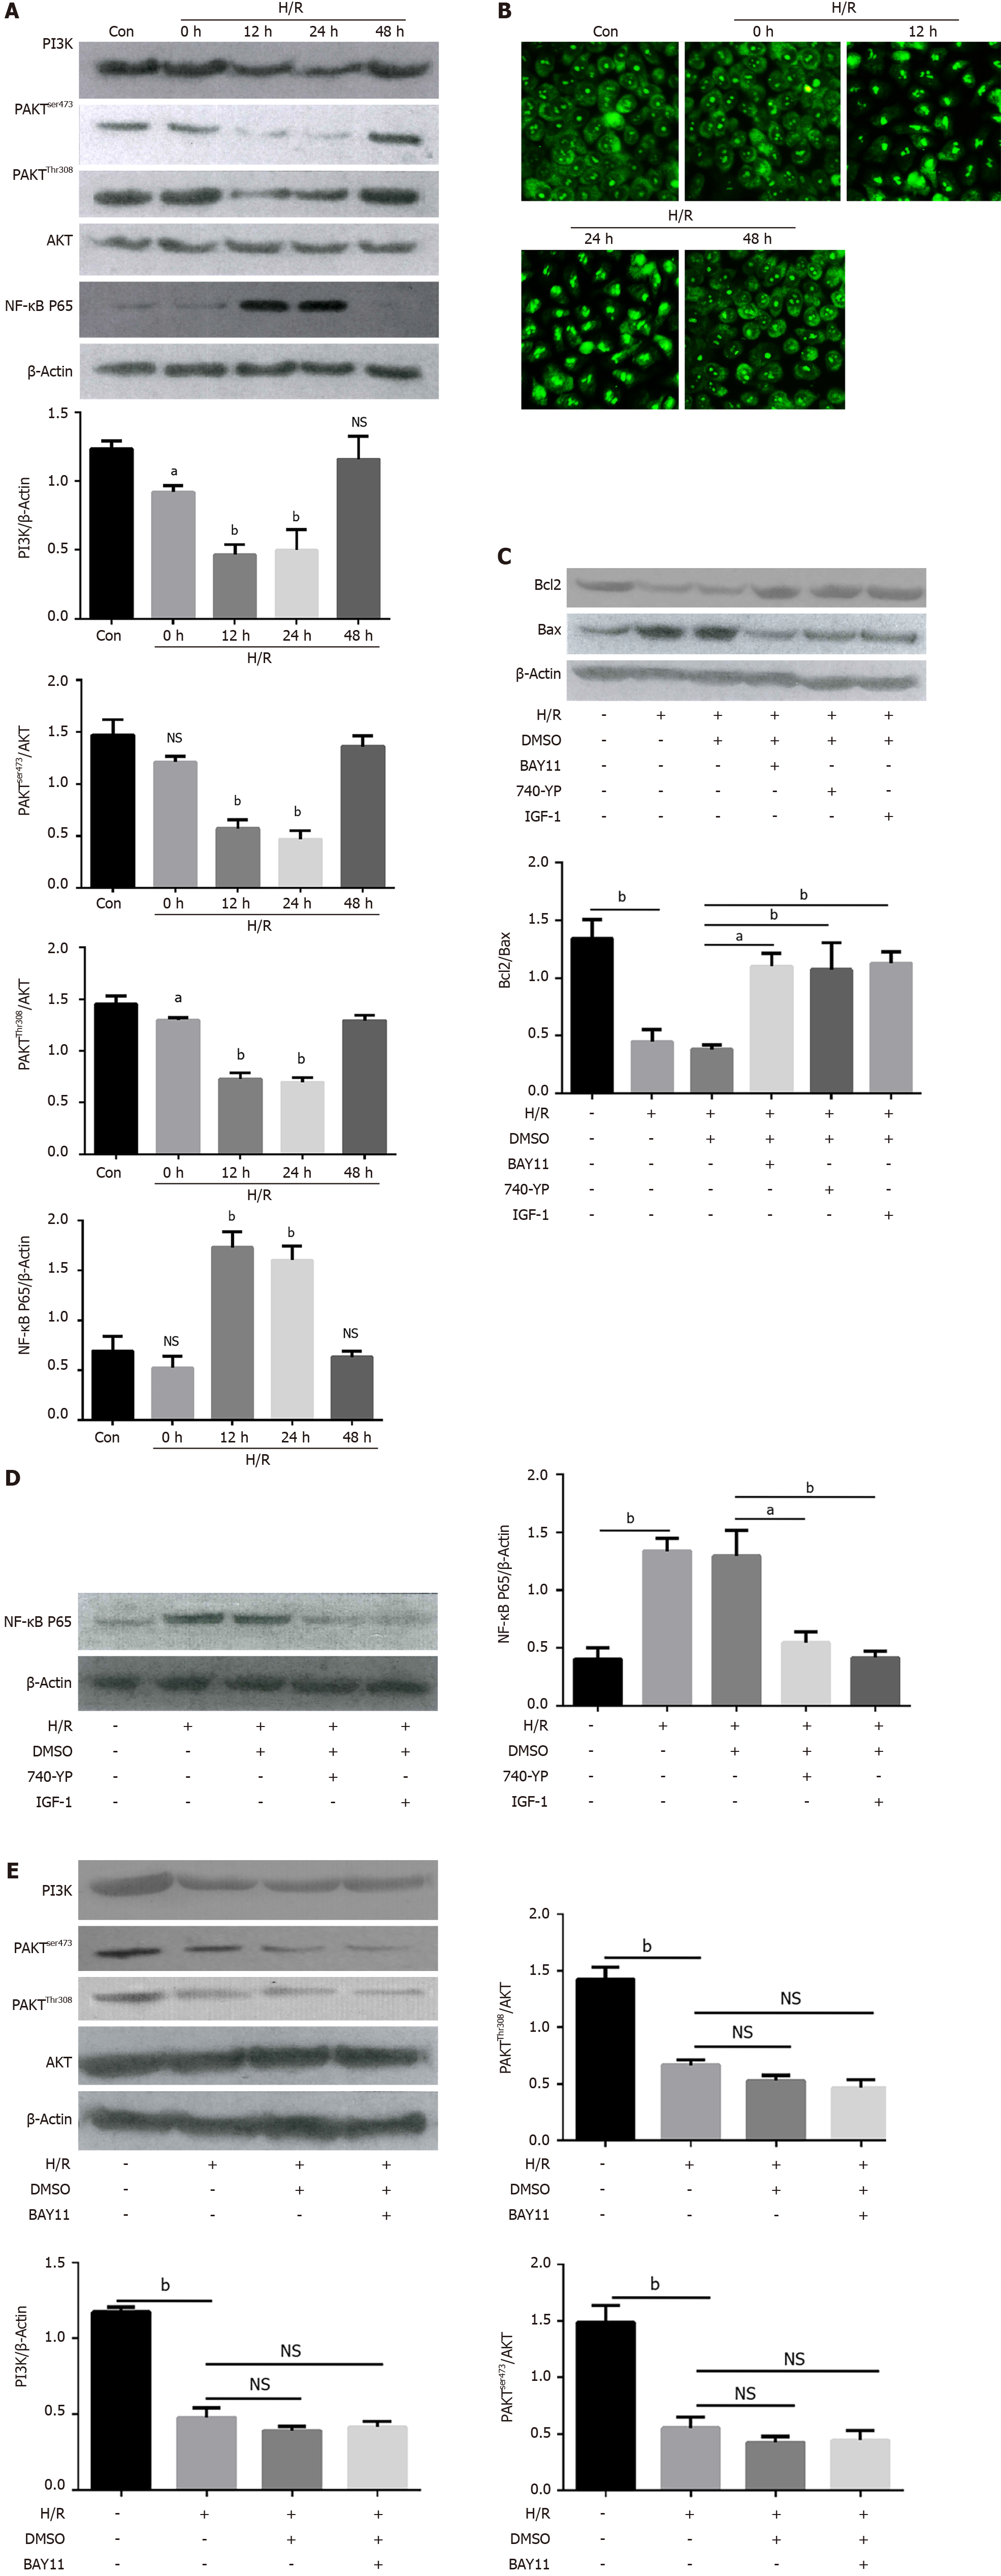
Figure 3 PI3K/AKT/NF-κB pathway was involved in hypoxia/reoxygenation-induced apoptosis.
A: Representative western blotting and quantification data for PI3K, p-AKTser473, p-AKTThr308, NF-κB P65, and β-actin at different time points after hypoxia/reoxygenation (H/R) treatment. ns, no significant difference, aP < 0.01 and bP < 0.001 vs control (n = 3); B: Representative images of immunofluorescence staining for NF-κB P65 in Caco2 cells before (Con) and after the H/R treatment at different time, Bars = 100-μm (n = 3); C: Representative Western blotting and quantification data for cell apoptotic proteins Bcl-2, and Bax after NF-κB inhibitor BAY11, AKT activator IGF-1 and PI3K activator 740 Y-P treatment, aP < 0.01 and bP < 0.001 vs control (n = 3); D: Representative Western blotting and quantification data for NF-κB P65 after AKT activator IGF-1 and PI3K activator 740 Y-P treatment, aP < 0.01 and bP < 0.001 vs control (n = 3); E: Representative Western blotting and quantification data for PI3K, p-AKTser473, and p-AKTThr308, after NF-κB inhibitor BAY11 treatment. Data are presented as mean ± SD. bP < 0.001 vs control (n = 3). NS: No significant difference.
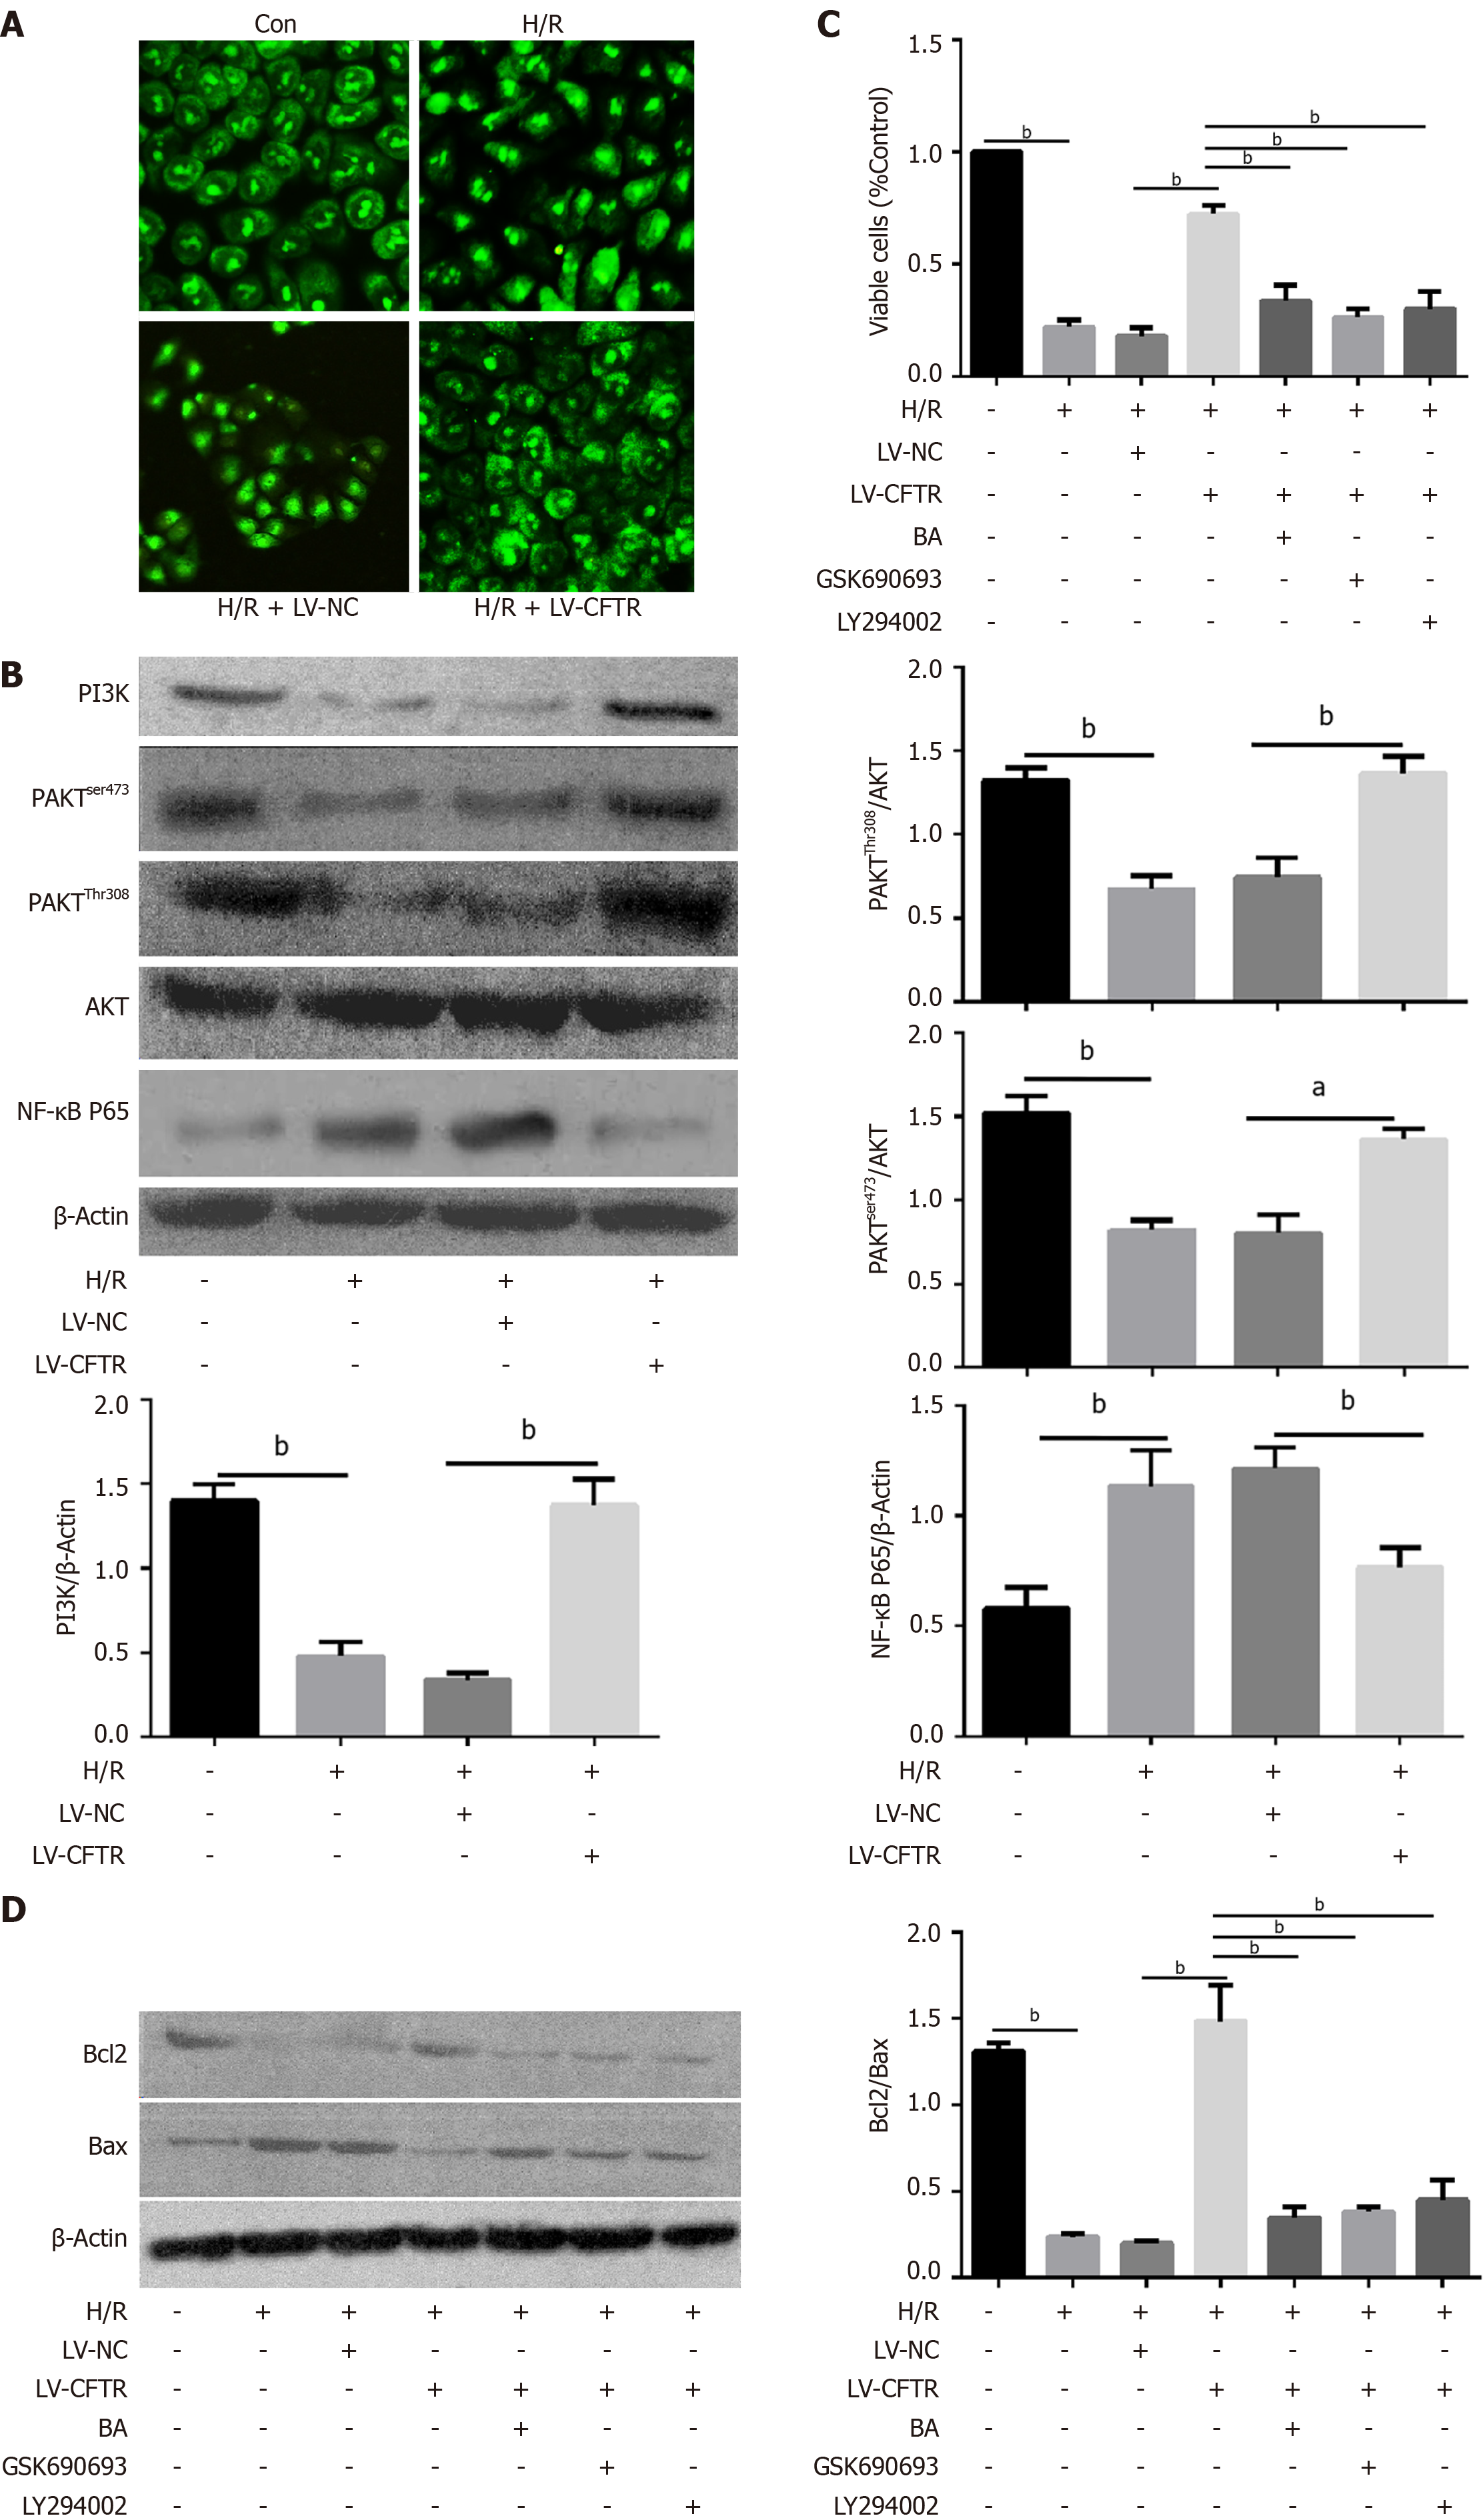
Figure 4 Cystic fibrosis transmembrane conductance regulator protected the Caco2 cells from hypoxia/reoxygenation-induced apoptosis by PI3K/AKT/NF-κB pathway.
A: Representative images of immunofluorescence staining for NF-κB P65 in Caco2 cells after the LV-cystic fibrosis transmembrane conductance regulator (CFTR) transfection (n = 3); B: Representative western blotting and quantification data for PI3K, p-AKTser473, p-AKTThr308, and NF-κB P65 after LV-CFTR transfection, aP < 0.01 and bP < 0.001 vs control (n = 3); C: Cell viability was tested using the CCK8 kit after LV-CFTR transfection and treatment with NF-κB activator Betulinic acid (BA), AKT inhibitor GSK690693 and PI3K inhibitor LY294002, bP < 0.001 vs control (n = 3); D: Representative Western blotting and quantification data for cell apoptotic proteins Bcl-2 and Bax after LV-CFTR transfection and treatment with NF-κB activator BA, AKT inhibitor GSK690693 and PI3K inhibitor LY294002. Data are presented as mean ± SD. bP < 0.001 vs control (n = 3).
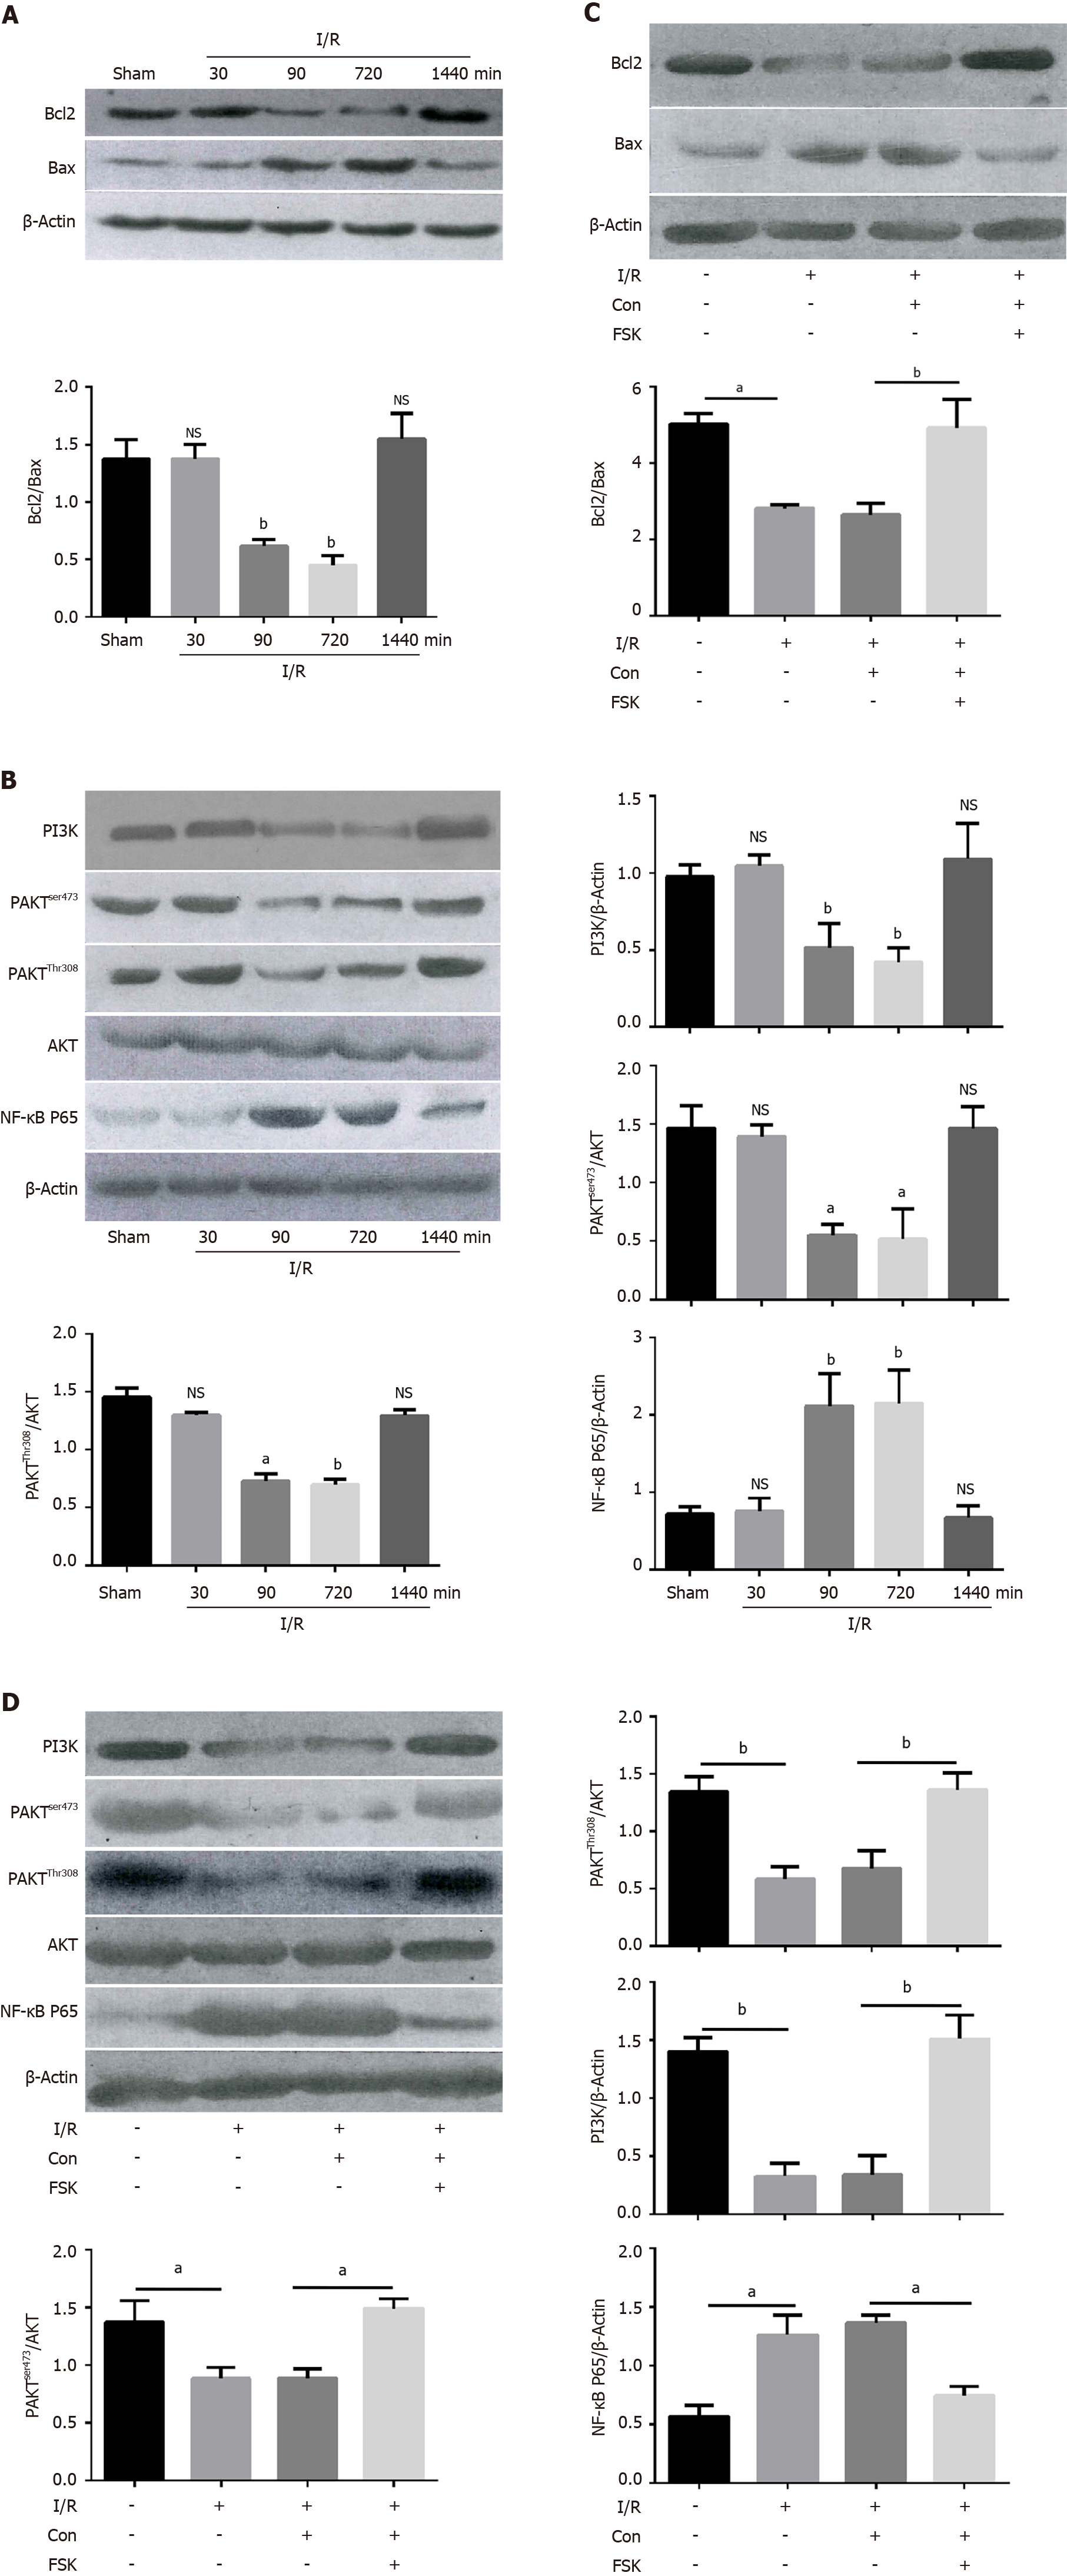
Figure 5 Cystic fibrosis transmembrane conductance regulator protects the intestinal cell from apoptosis induced by ischemia/ reperfusion by inhibiting PI3K/AKT/NF-κB pathway in vivo.
A: Representative Western blotting and quantification data for cell apoptotic proteins Bcl-2 and Bax at different time after the ischemia/reperfusion (I/R) treatment, bP < 0.001 vs control (n = 3); B: Representative Western blotting and quantification data for PI3K, p-AKTser473, p-AKTThr308, and NF-κB P65 at different time after I/R treatment, aP < 0.01 and bP < 0.001 vs control (n = 3); C: Representative Western blotting and quantification data for cell apoptotic proteins Bcl-2 and Bax after the FSK treatment in I/R treatment animal model, aP < 0.01 and bP < 0.001 vs control (n = 3); D: Representative Western blotting and quantification data for PI3K, p-AKTser473, p-AKTThr308, and NF-κB P65 after FSK treatment in the I/R treatment animal model. Data are presented as mean ± SD. aP < 0.01 and bP < 0.001 vs control (n = 3).
- Citation: Dong ZW, Liu H, Su FF, Fan XZ, Zhang Y, Liu P. Cystic fibrosis transmembrane conductance regulator prevents ischemia/reperfusion induced intestinal apoptosis via inhibiting PI3K/AKT/NF-κB pathway. World J Gastroenterol 2022; 28(9): 918-932
- URL: https://www.wjgnet.com/1007-9327/full/v28/i9/918.htm
- DOI: https://dx.doi.org/10.3748/wjg.v28.i9.918


