Copyright
©The Author(s) 2022.
World J Gastroenterol. Feb 21, 2022; 28(7): 715-731
Published online Feb 21, 2022. doi: 10.3748/wjg.v28.i7.715
Published online Feb 21, 2022. doi: 10.3748/wjg.v28.i7.715
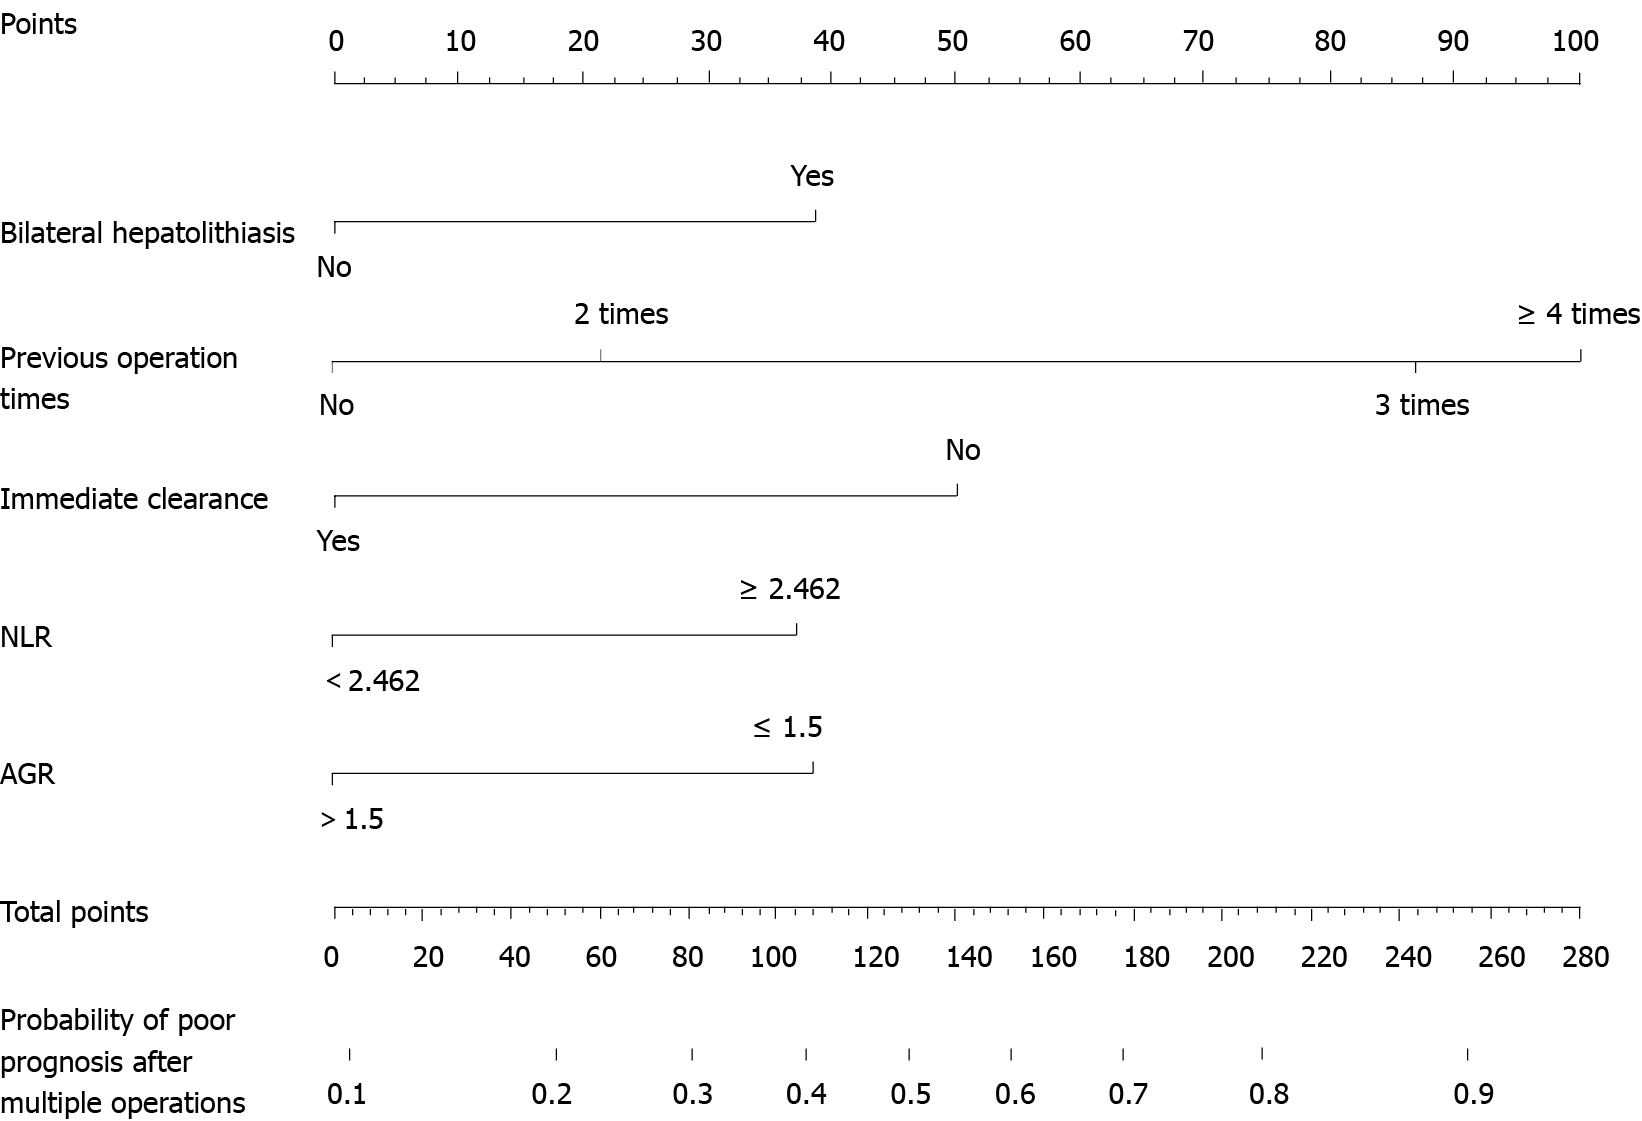
Figure 1 Nomogram for predicting prognosis in the training cohort.
NLR: Neutrophil-to-lymphocyte ratio; AGR: Albumin-to-globulin ratio.
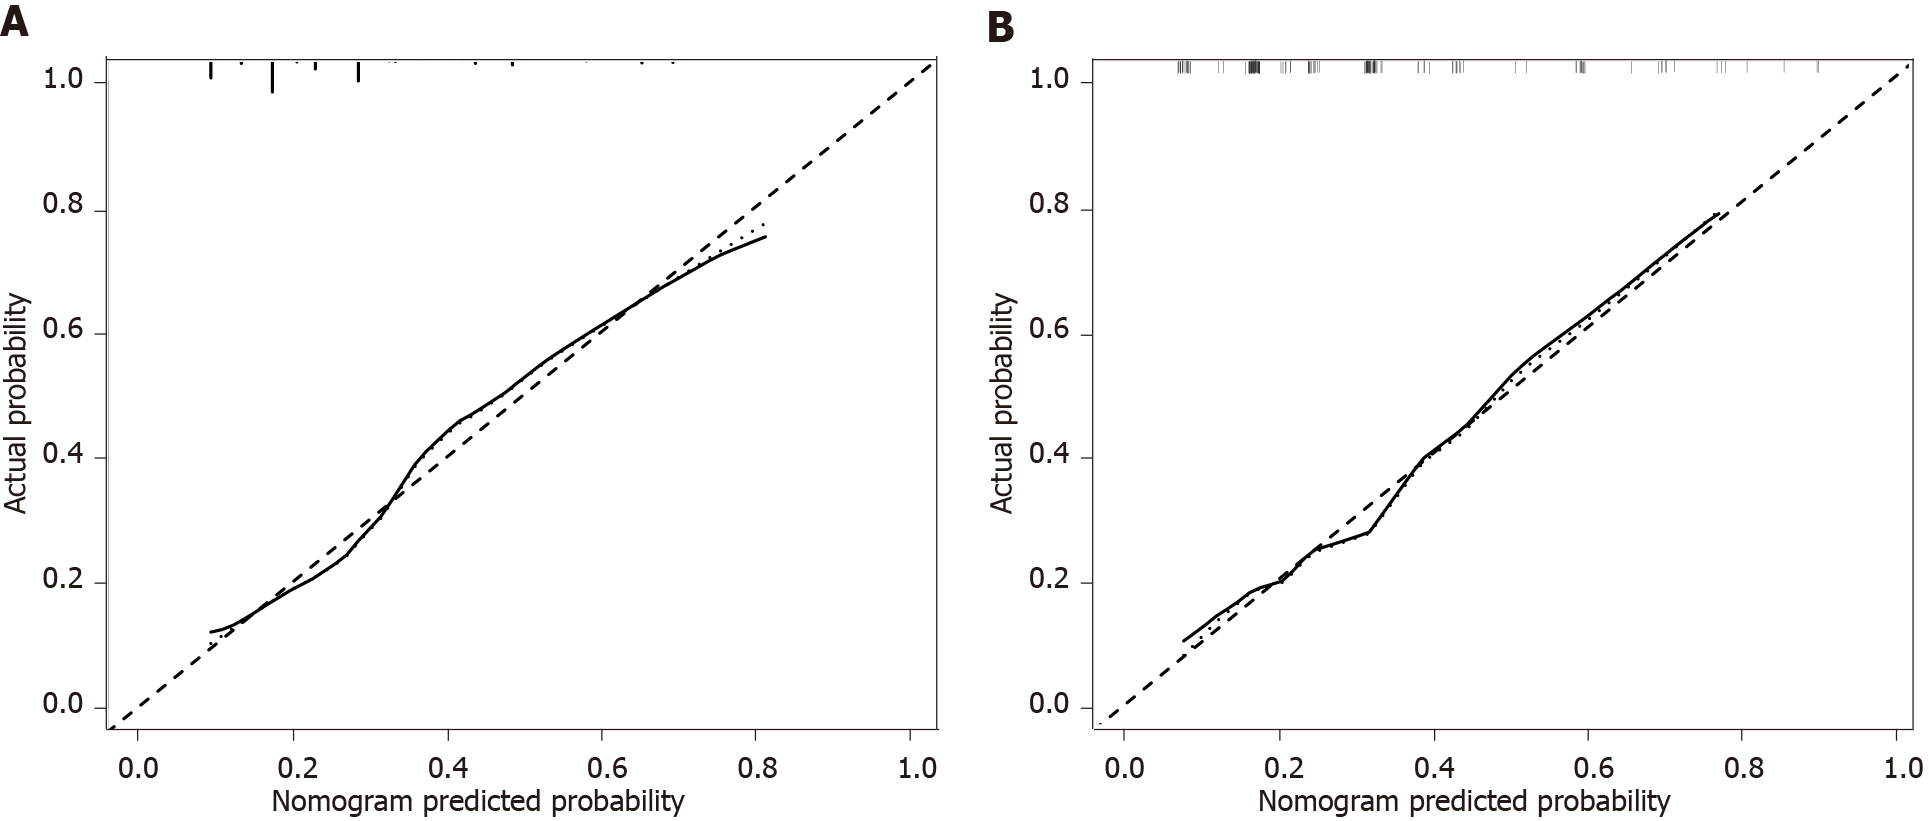
Figure 2 Calibration curves for predicting the prognosis.
The nomogram had c-index values of 0.748 and 0.743 in the training and validation cohorts, respectively. A: In the training; B: In the validation cohorts.
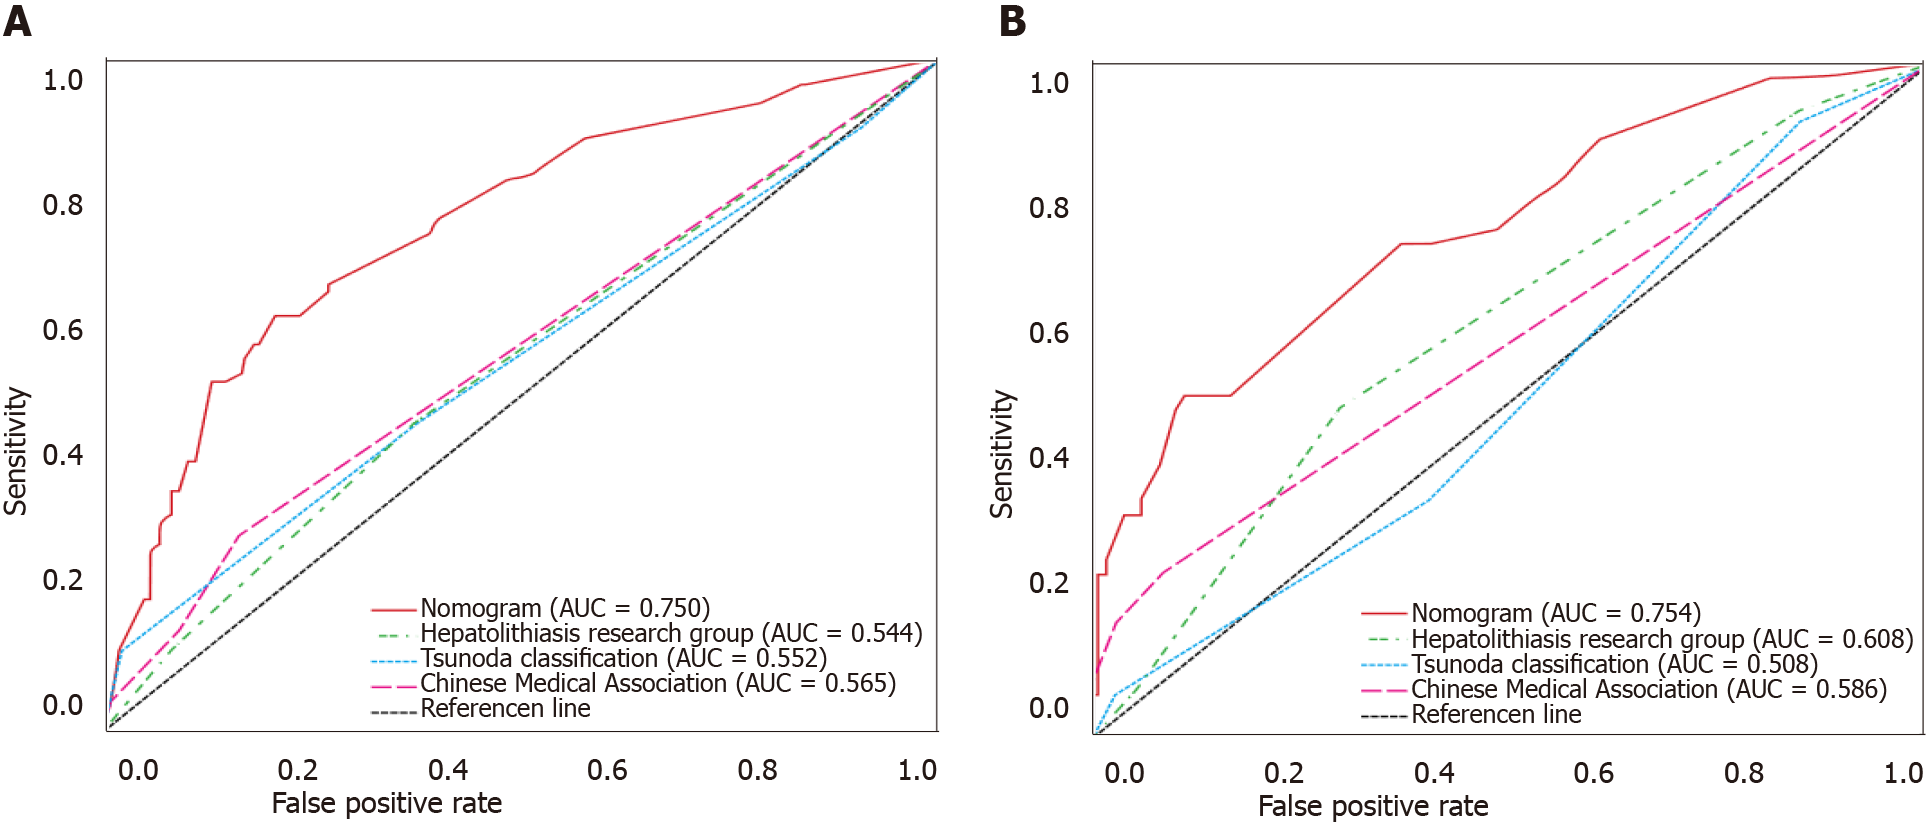
Figure 3 Receiver operating characteristic curve of our nomogram and other three traditional classifications.
A: In the training; B: In the validation cohorts. AUC: Area under the curve.
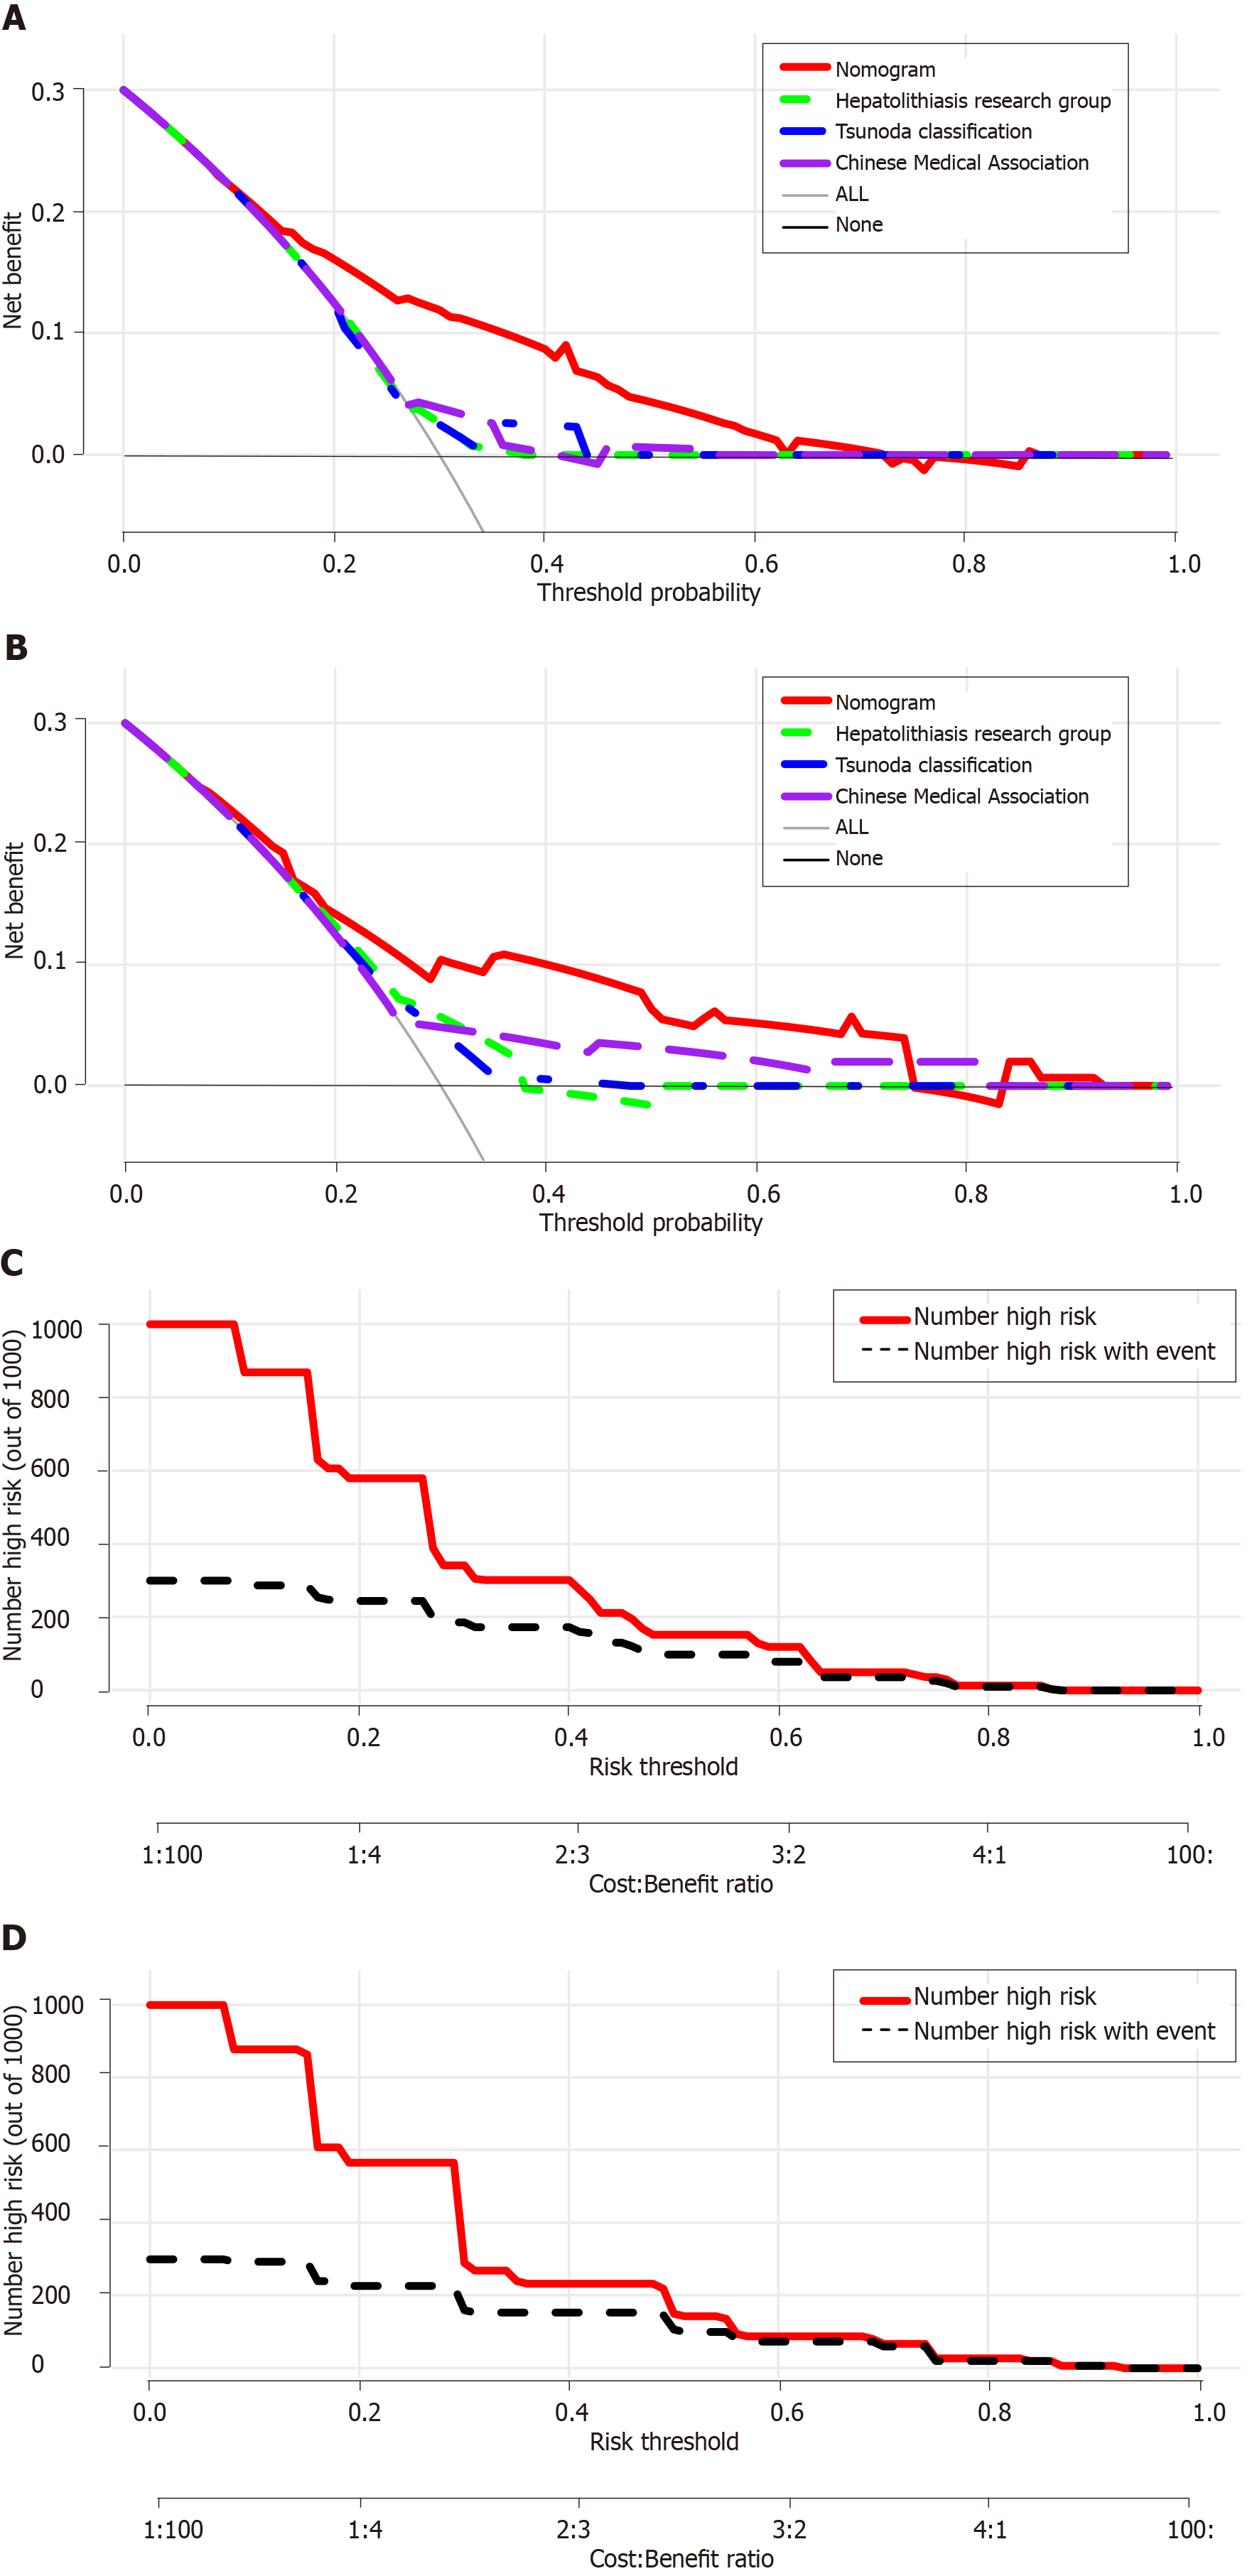
Figure 4 The decision curve analysis of our nomogram and three other traditional classifications.
The x-axis represents the threshold probability and the y-axis represents the net benefit. The horizontal solid black line represents the hypothesis that no patients reached the endpoint, and the solid gray line represents the hypothesis that all patients met the endpoint. A: In the training; B: In the validation cohorts; C: Clinical impact curves of the nomogram in the training; D: Validation cohorts. At different threshold probabilities within a given population, the number of high-risk patients and the number of high-risk patients with the outcome are shown.
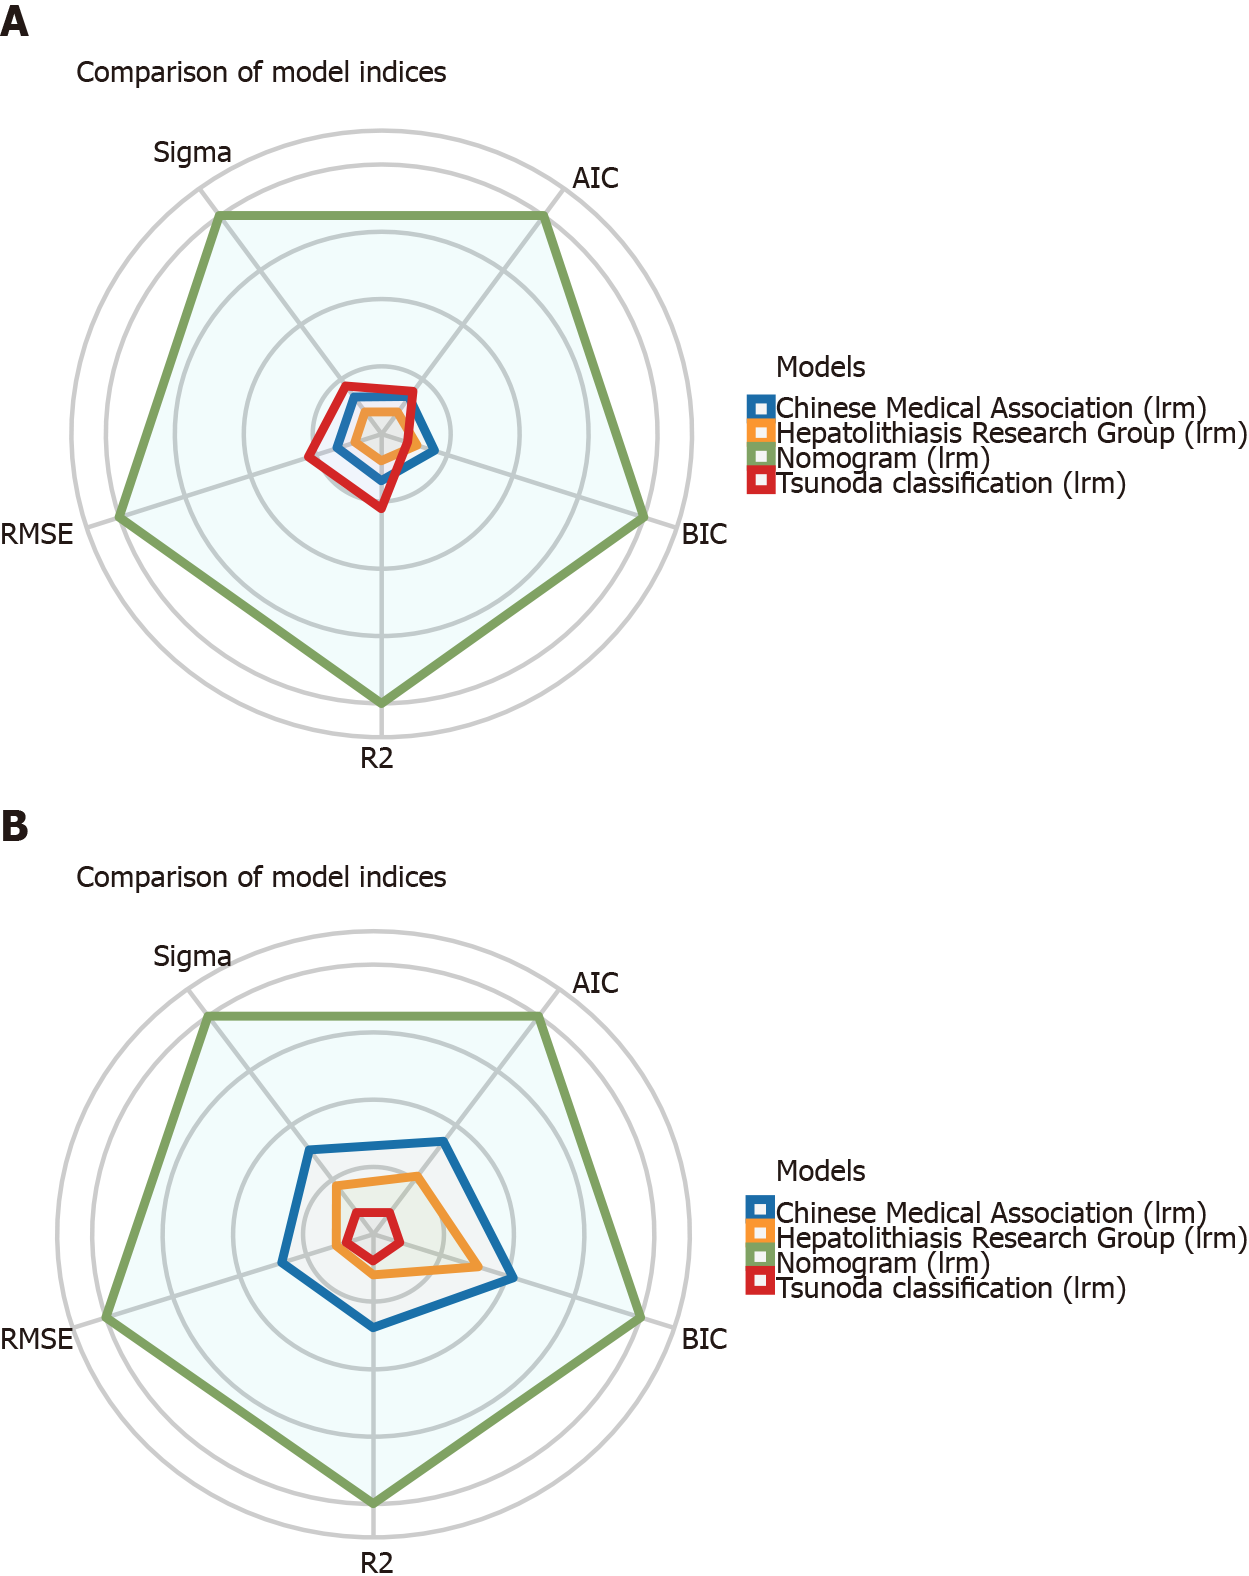
Figure 5 Visual fit indices of our nomogram and other three traditional classifications.
A: In the training; B: In the validation cohorts.
- Citation: Pu T, Chen JM, Li ZH, Jiang D, Guo Q, Li AQ, Cai M, Chen ZX, Xie K, Zhao YJ, Wang C, Hou H, Lu Z, Geng XP, Liu FB. Clinical online nomogram for predicting prognosis in recurrent hepatolithiasis after biliary surgery: A multicenter, retrospective study. World J Gastroenterol 2022; 28(7): 715-731
- URL: https://www.wjgnet.com/1007-9327/full/v28/i7/715.htm
- DOI: https://dx.doi.org/10.3748/wjg.v28.i7.715


