Copyright
©The Author(s) 2022.
World J Gastroenterol. Feb 14, 2022; 28(6): 635-652
Published online Feb 14, 2022. doi: 10.3748/wjg.v28.i6.635
Published online Feb 14, 2022. doi: 10.3748/wjg.v28.i6.635
Figure 1 Box-plots showing alpha diversity indices (Chao1, Shannon, and evenness indices) in samples.
Statistical differences were evaluated using paired Wilcoxon signed-rank test for Chao, Shannon, and evenness indices. P value less than 0.05 were considered statistically significant.
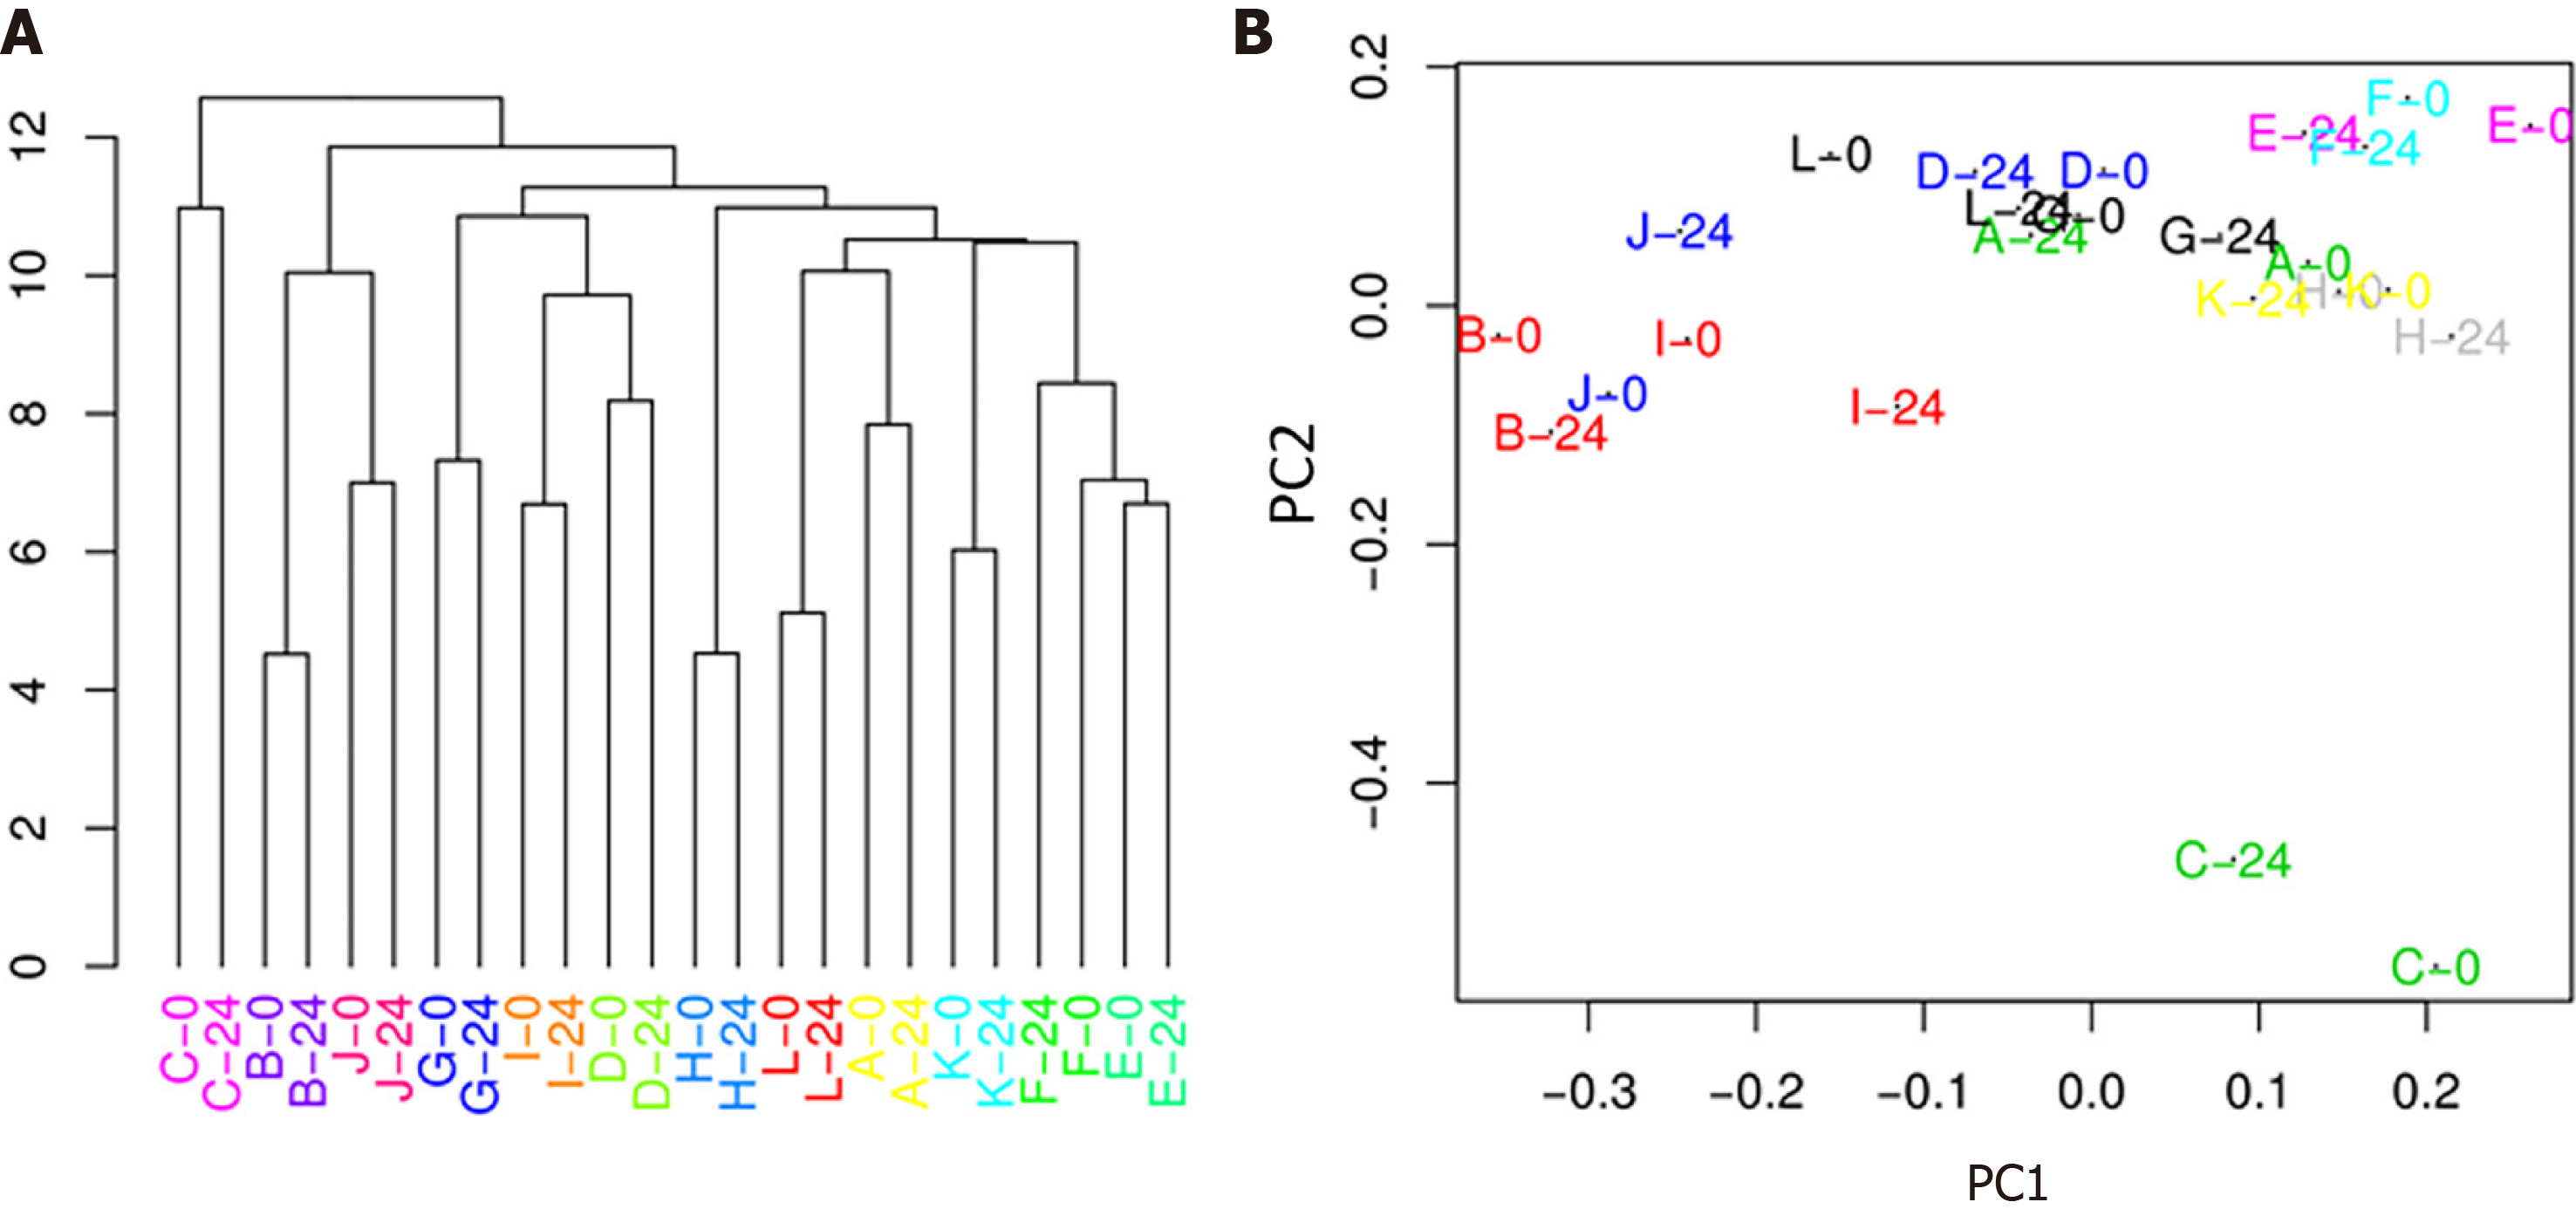
Figure 2 Cluster analysis (A) and principal coordinate analysis showing that samples do not separate into two groups depending on their condition (0-24 wk) (B).
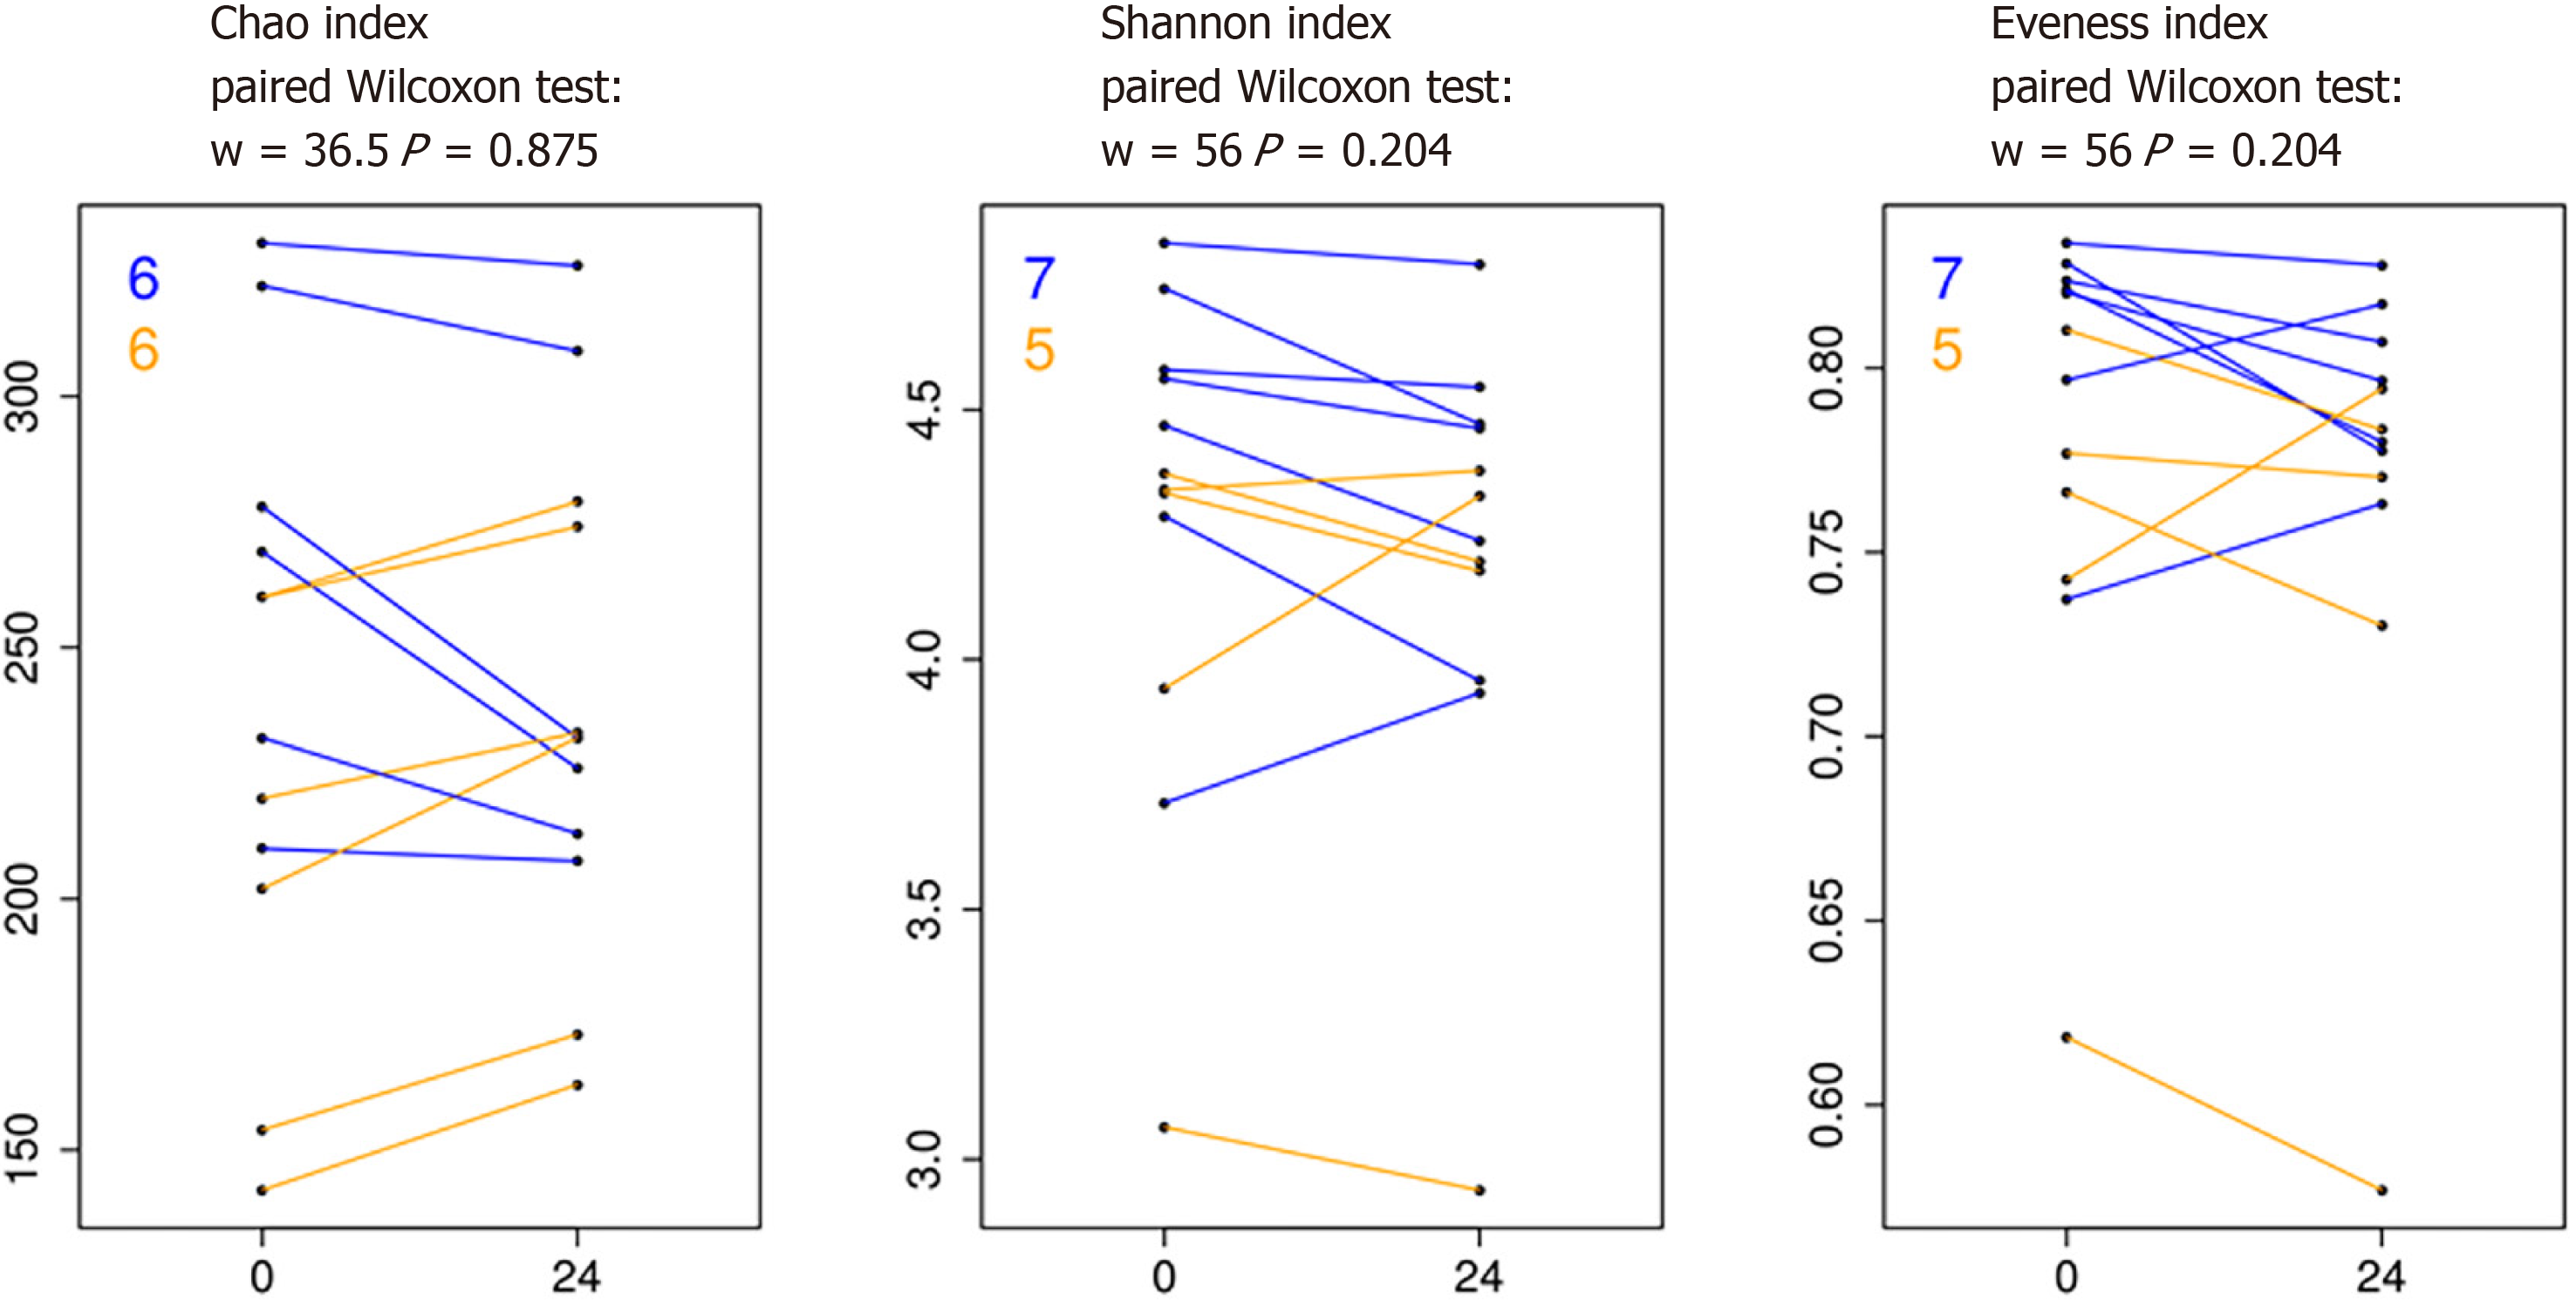
Figure 3 Segment plots depicting taxa with significantly differences between high viremia (time point 0) and viral suppression (time point 24) conditions.
Lines connect paired samples and highlight the differences in normalized abundance for the indicated rank. Orange or blue colors highlight decrease or increase, respectively. Numbers in the top-left corner represent counts of increased (orange) and decreased (blue) measurement for paired samples.
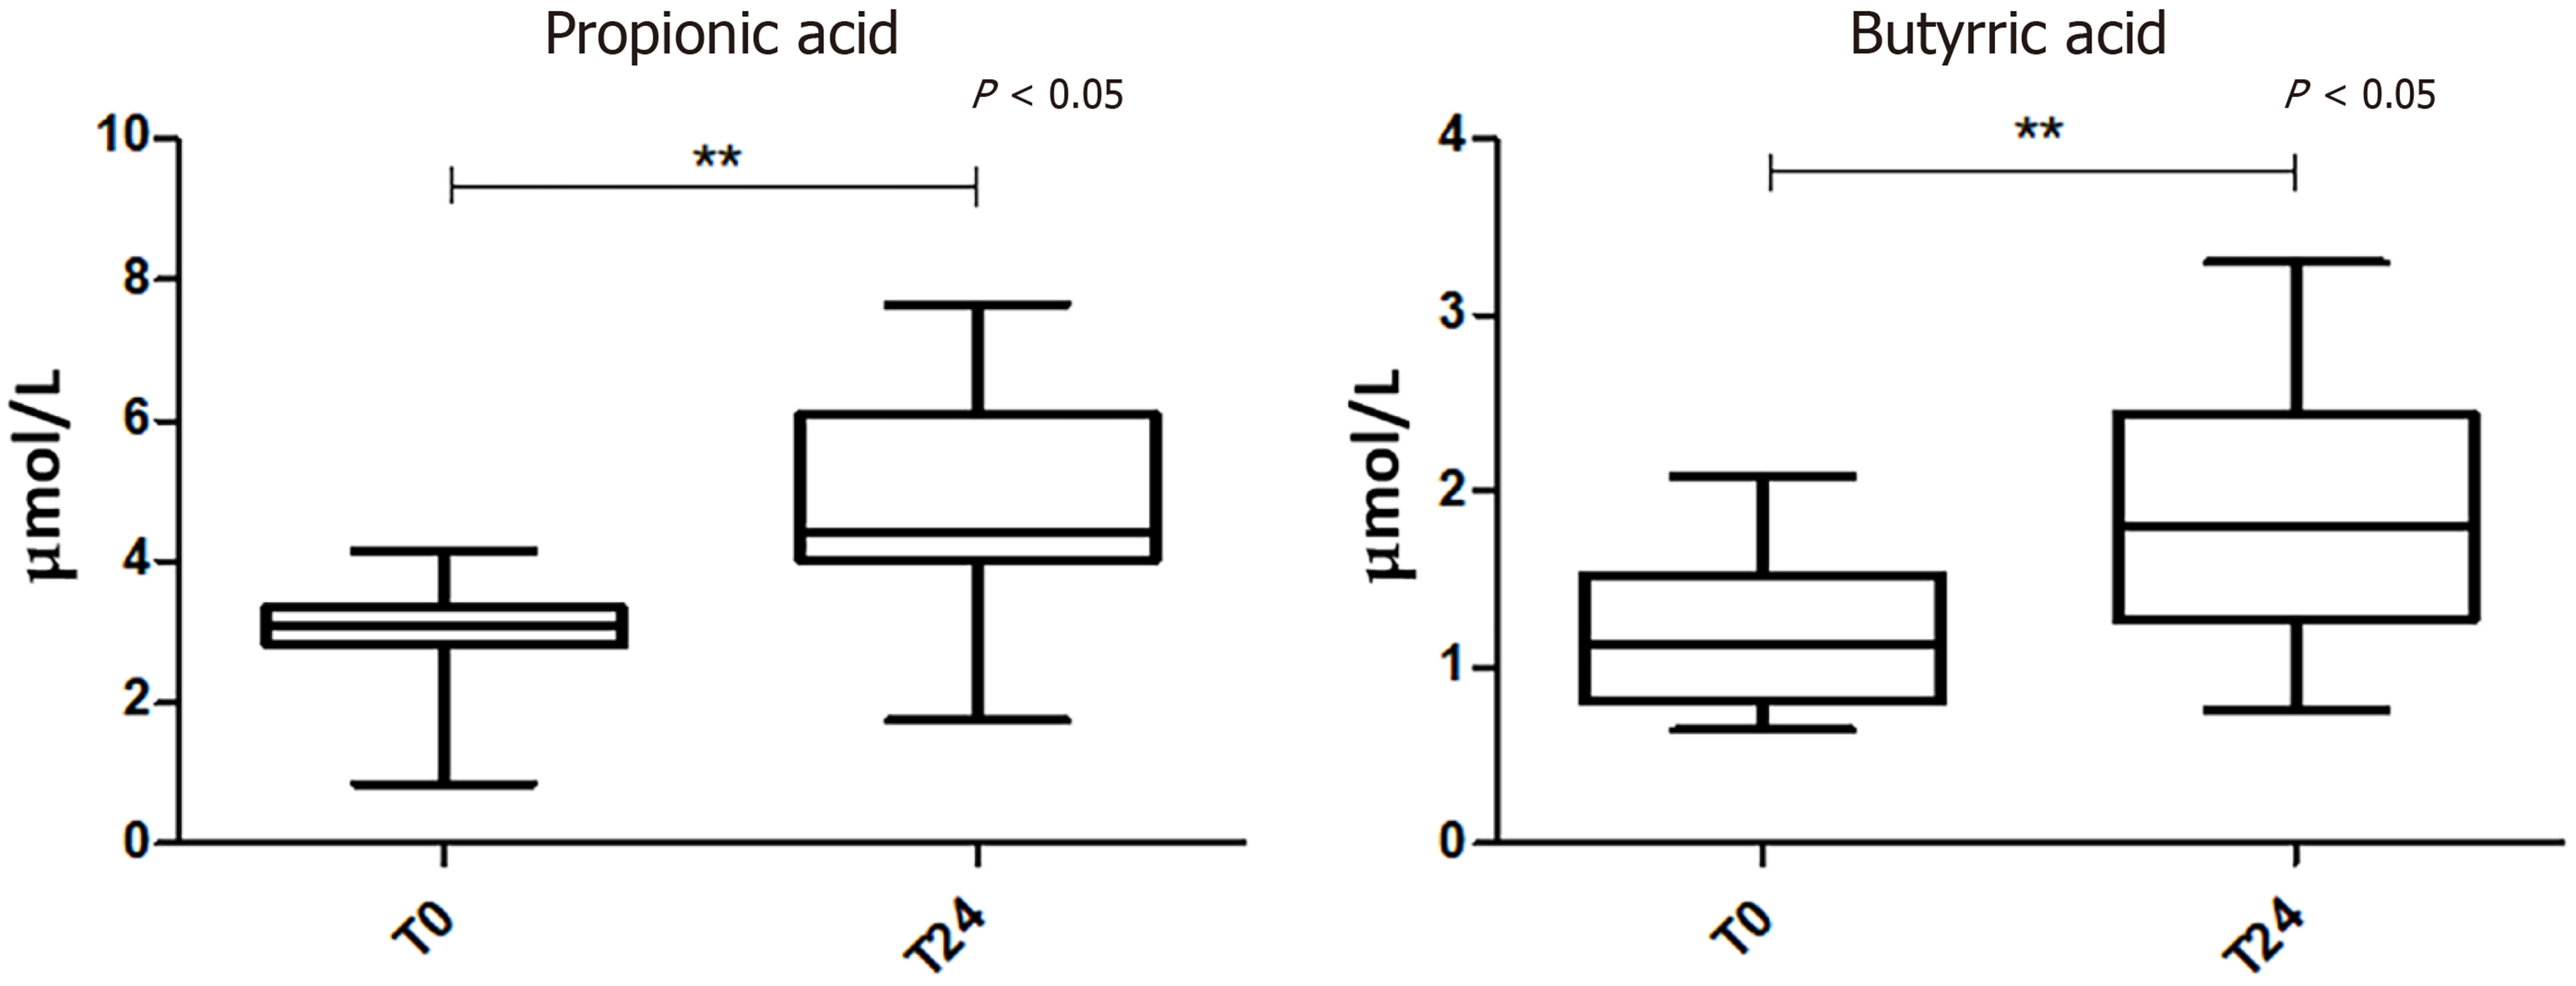
Figure 4 Boxplots showing statistically different levels of serum short-chain fatty acids between high viremia and viral suppressor patients, assessed by the Wilcoxon test.
P value < 0.05 was considered statistically significant.
Figure 5 Boxplots showing statistically different levels of serum cytokines between high viremia and viral suppressor patients, assessed by the Wilcoxon test.
A P value < 0.05 was considered statistically significant.
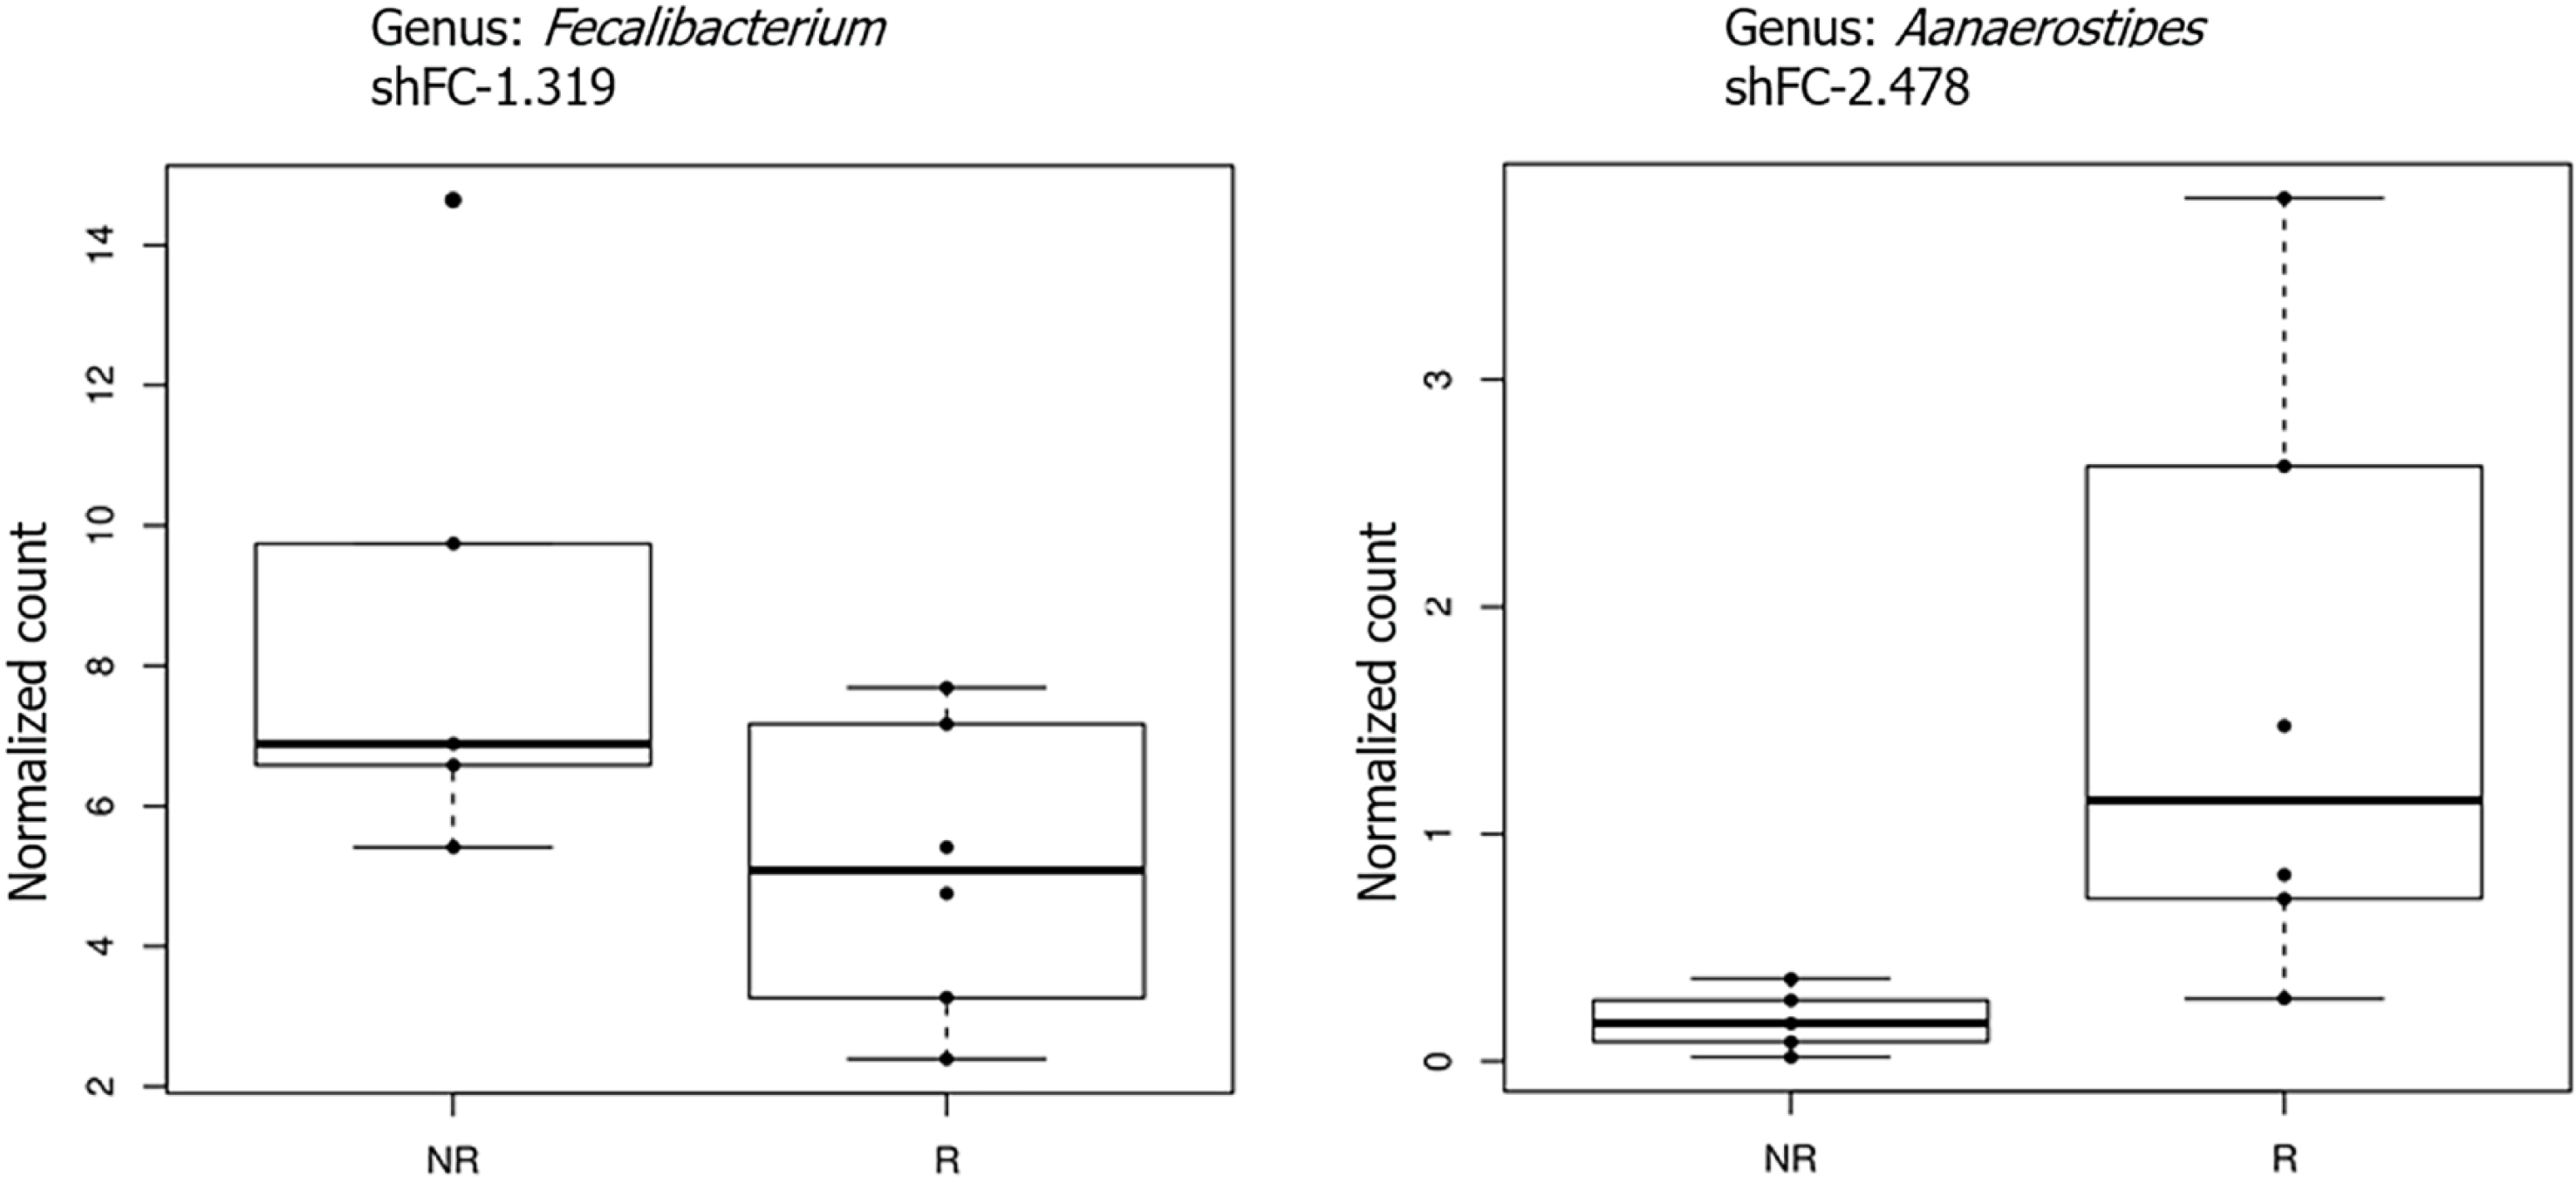
Figure 6 Boxplots showing the results of taxa-level differential abundance analysis between immunological responders and immunological non-responders at 24 wk.
Plot titles report the shrunk Log2 fold change (according to the DESeq2 function lfcShrink). All results have a P value < 0.05. NR = INRs, R = IRs. IRs: Immunological responders; INRs: Immunological non-responders.
Figure 7 Boxplots showing statistically different fecal short-chain fatty acid abundances between immunological responders and immunological non-responders, assessed by the Mann-Whitney test.
aP value < 0.05 was considered statistically significant.
- Citation: Russo E, Nannini G, Sterrantino G, Kiros ST, Di Pilato V, Coppi M, Baldi S, Niccolai E, Ricci F, Ramazzotti M, Pallecchi M, Lagi F, Rossolini GM, Bartoloni A, Bartolucci G, Amedei A. Effects of viremia and CD4 recovery on gut “microbiome-immunity” axis in treatment-naïve HIV-1-infected patients undergoing antiretroviral therapy. World J Gastroenterol 2022; 28(6): 635-652
- URL: https://www.wjgnet.com/1007-9327/full/v28/i6/635.htm
- DOI: https://dx.doi.org/10.3748/wjg.v28.i6.635


