Copyright
©The Author(s) 2022.
World J Gastroenterol. Dec 28, 2022; 28(48): 6935-6949
Published online Dec 28, 2022. doi: 10.3748/wjg.v28.i48.6935
Published online Dec 28, 2022. doi: 10.3748/wjg.v28.i48.6935
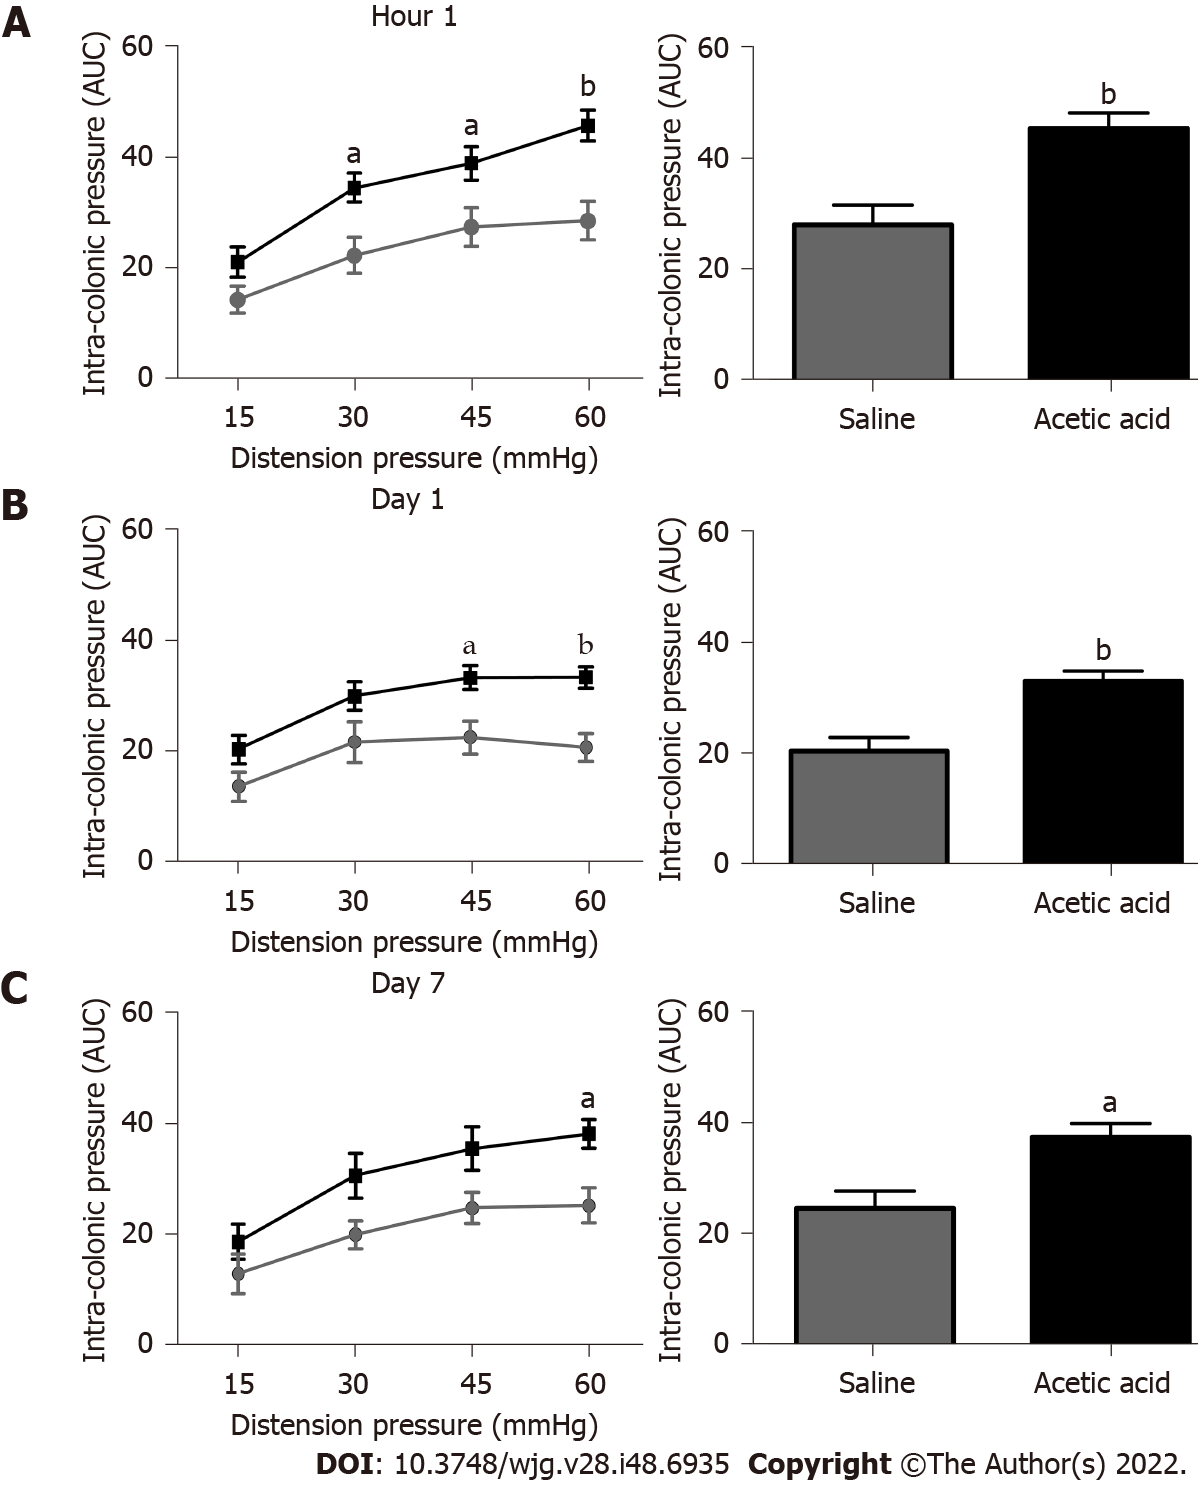
Figure 1 Assessment of visceromotor response to colorectal distensions.
A-C: Changes in intracolonic pressure in response to isobaric colorectal distensions (15, 30, 45 and 60 mmHg) after intravesical injections of acetic acid (0.75%) vs saline (NaCl 0.9%) in mice at 1 h (A), 1 d (B) and 7 d (C) after injections, with details of the comparison at 60 mmHg of distension on the right. n = 8 mice per group. aP < 0.05 and bP < 0.001. Variability in the results is represented by the standard error of the mean (area under the curve ± standard error of the mean). AUC: Area under the curve.
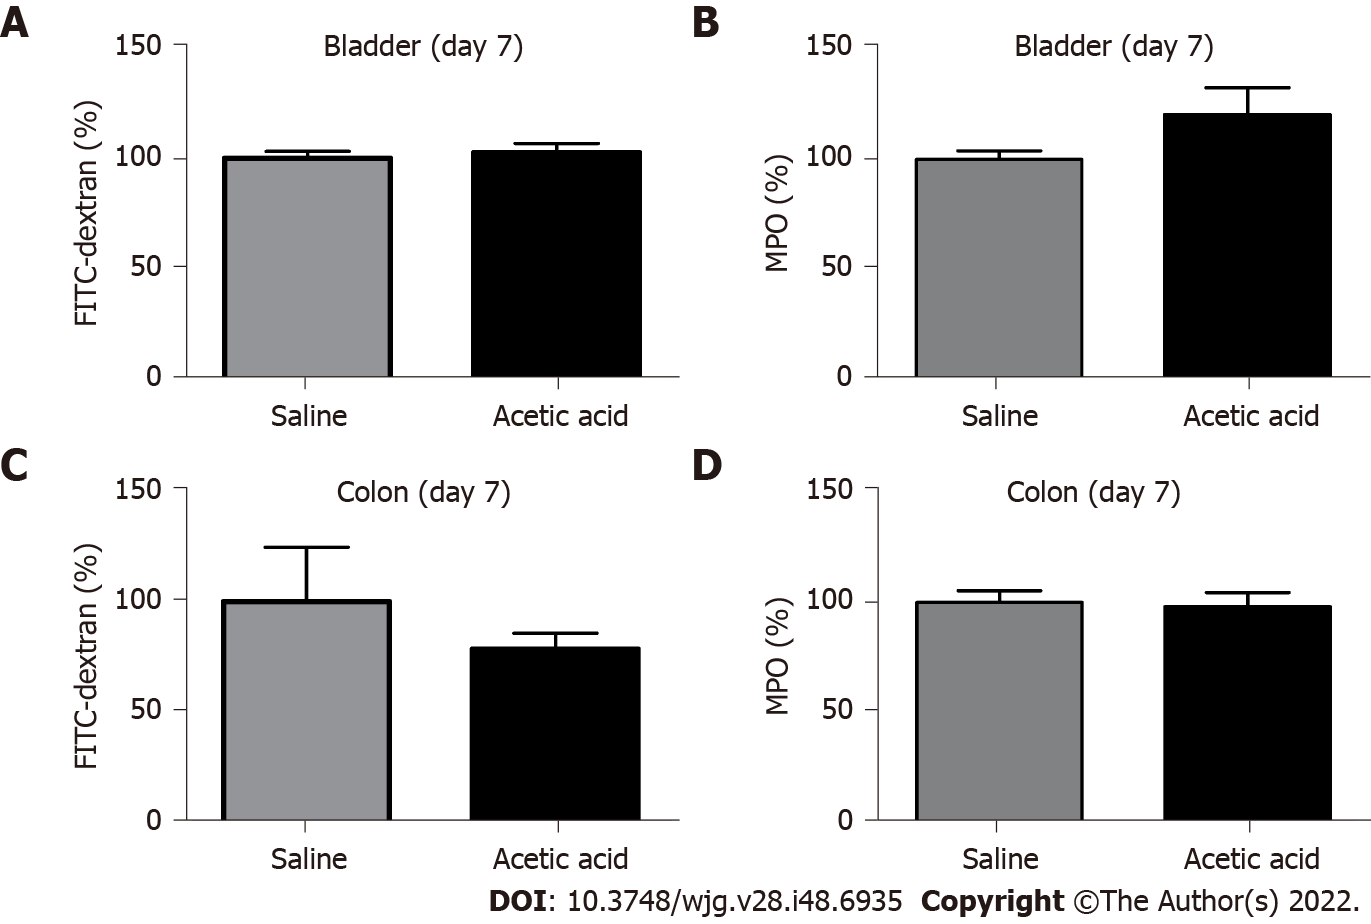
Figure 2 Bladder and colorectal permeabilities and inflammation.
A-D: Urinary bladder (A) and colorectal (B) permeabilities assessed by fluorescein isothiocyanate (FITC)-dextran, and urinary bladder (C) and colon (D) inflammatory levels assessed by myeloperoxidase (MPO) activities. They were not different between mice with intravesical injections of saline (NaCl 0.9%) or acetic acid (0.75%) at day 7. n = 4-5 mice per group. Results of mice treated by intravesical injections of acetic acid were normalized to those of mice treated with saline. Variability in the results is represented by the standard error of the mean.
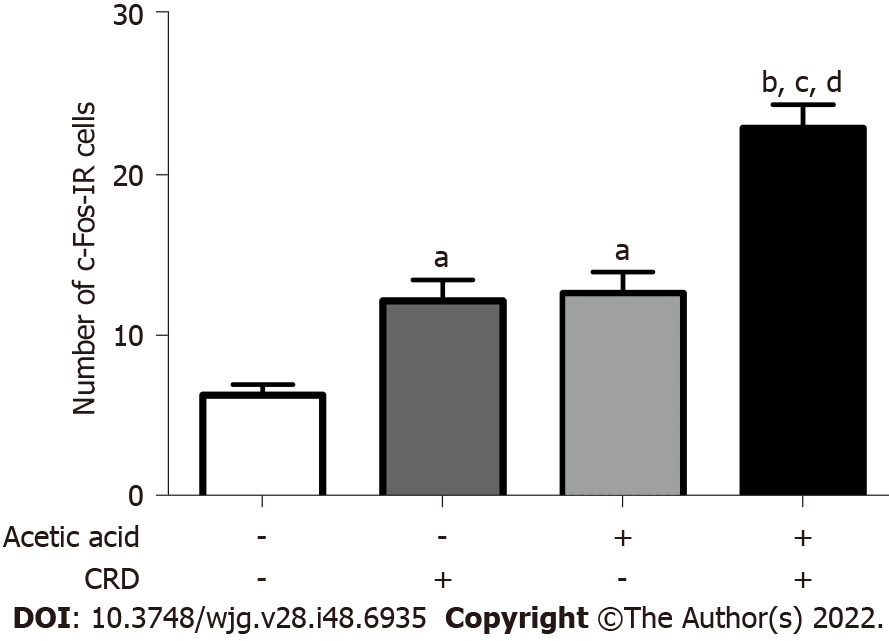
Figure 3 Quantification of c-Fos immunoreactive cells.
Quantification of c-Fos immunoreactive (IR) cells in lamina I and II of the dorsal horn per slice of the L6-S1 spinal cord on day 7 after intravesical injection of saline (NaCl 0.9%) or acetic acid 0.75%, with or without prior colorectal distensions (CRDs) at 45 mmHg for 120 min (n = 6-7 mice per group). aP < 0.05 and bP < 0.0001 (compared to mice treated with saline and no prior CRD); cP < 0.001 (compared to mice treated with saline and prior CRD); dP < 0.01 (compared to mice treated with acetic acid and no prior CRD). Results are expressed as the mean ± standard error of the mean.
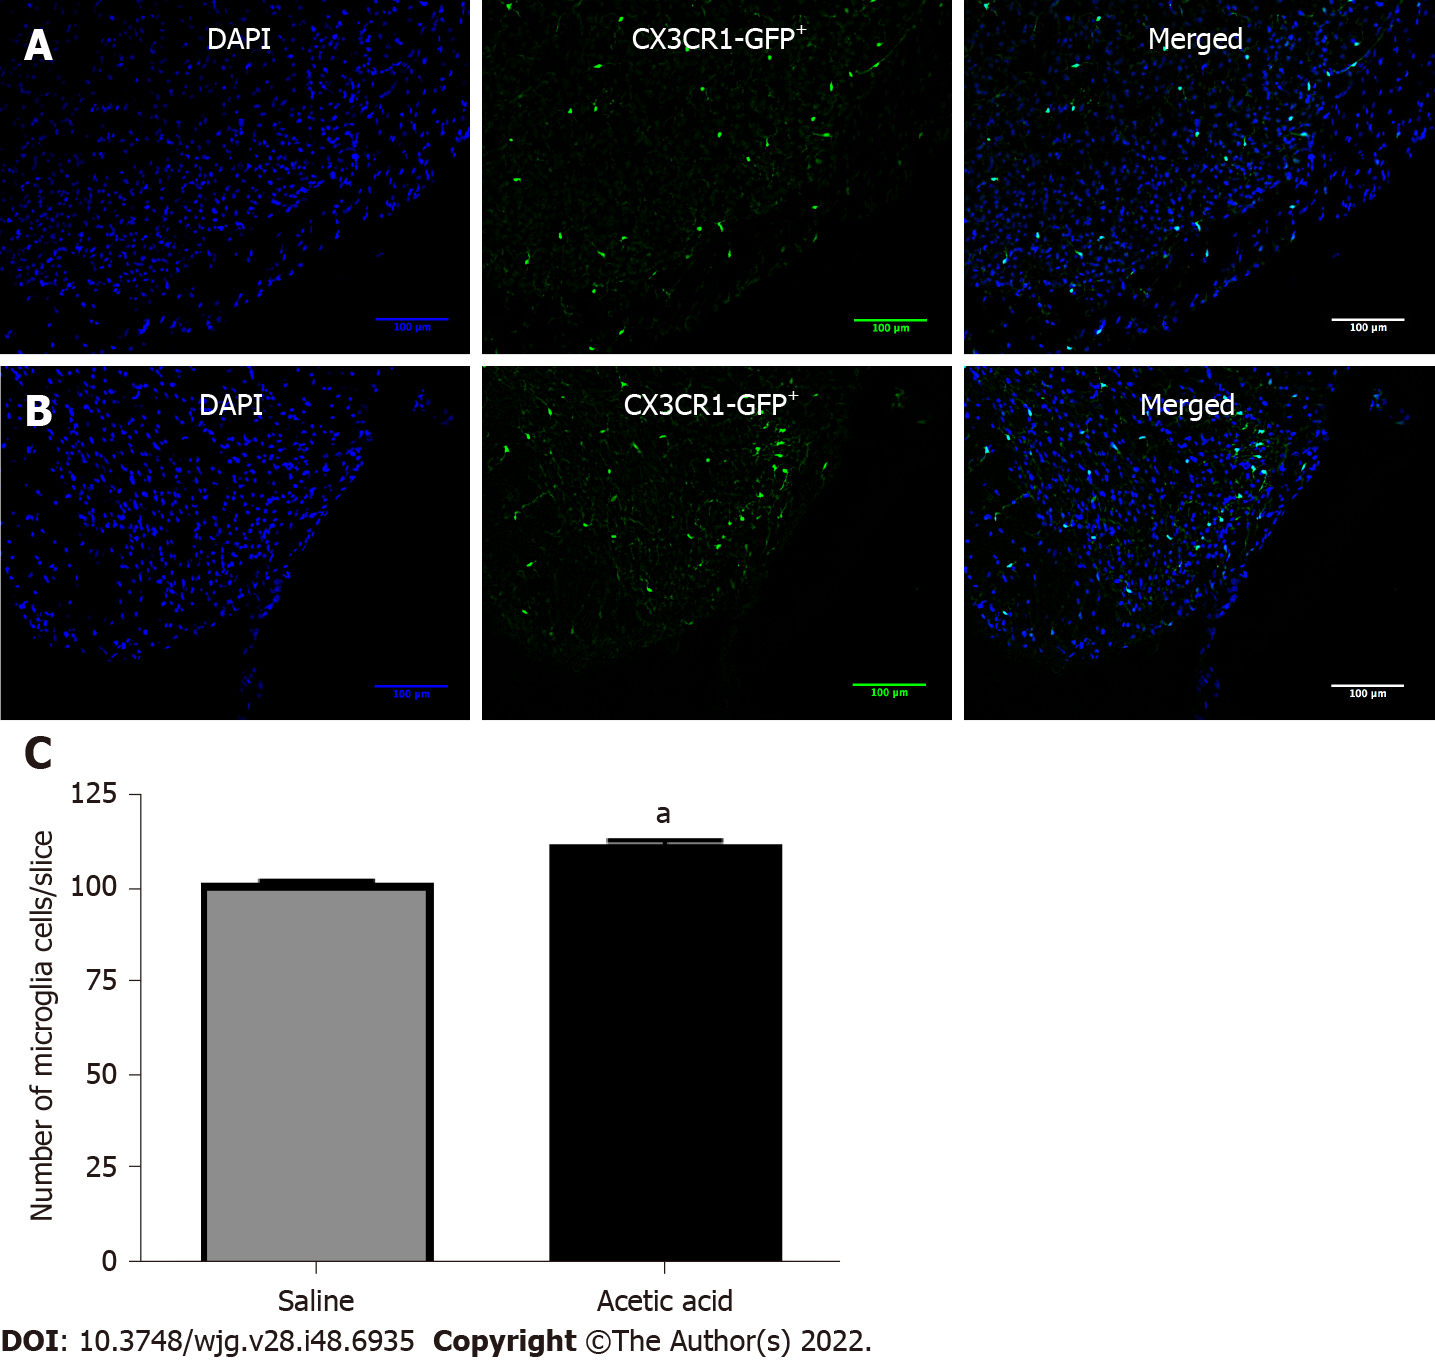
Figure 4 Number of microglia cells in the spinal cord.
A and B: Microglial cells in the dorsal horn of the L6-S1 level of the spinal cord were stained green [green fluorescent protein on the fractalkine receptor-positive (CX3CR1gfp+) mice], while nuclei appear in blue (DAPI) at day 7 after intravesical injections of saline (NaCl 0.9%) (A) or acetic acid 0.75% (B); C: The number of microglial cells per field was compared between the two groups using a Mann-Whitney bilateral test (n = 5 per group, average of 23 slices analyzed per mouse). aP < 0.05. Results are expressed as the mean ± standard error of the mean.
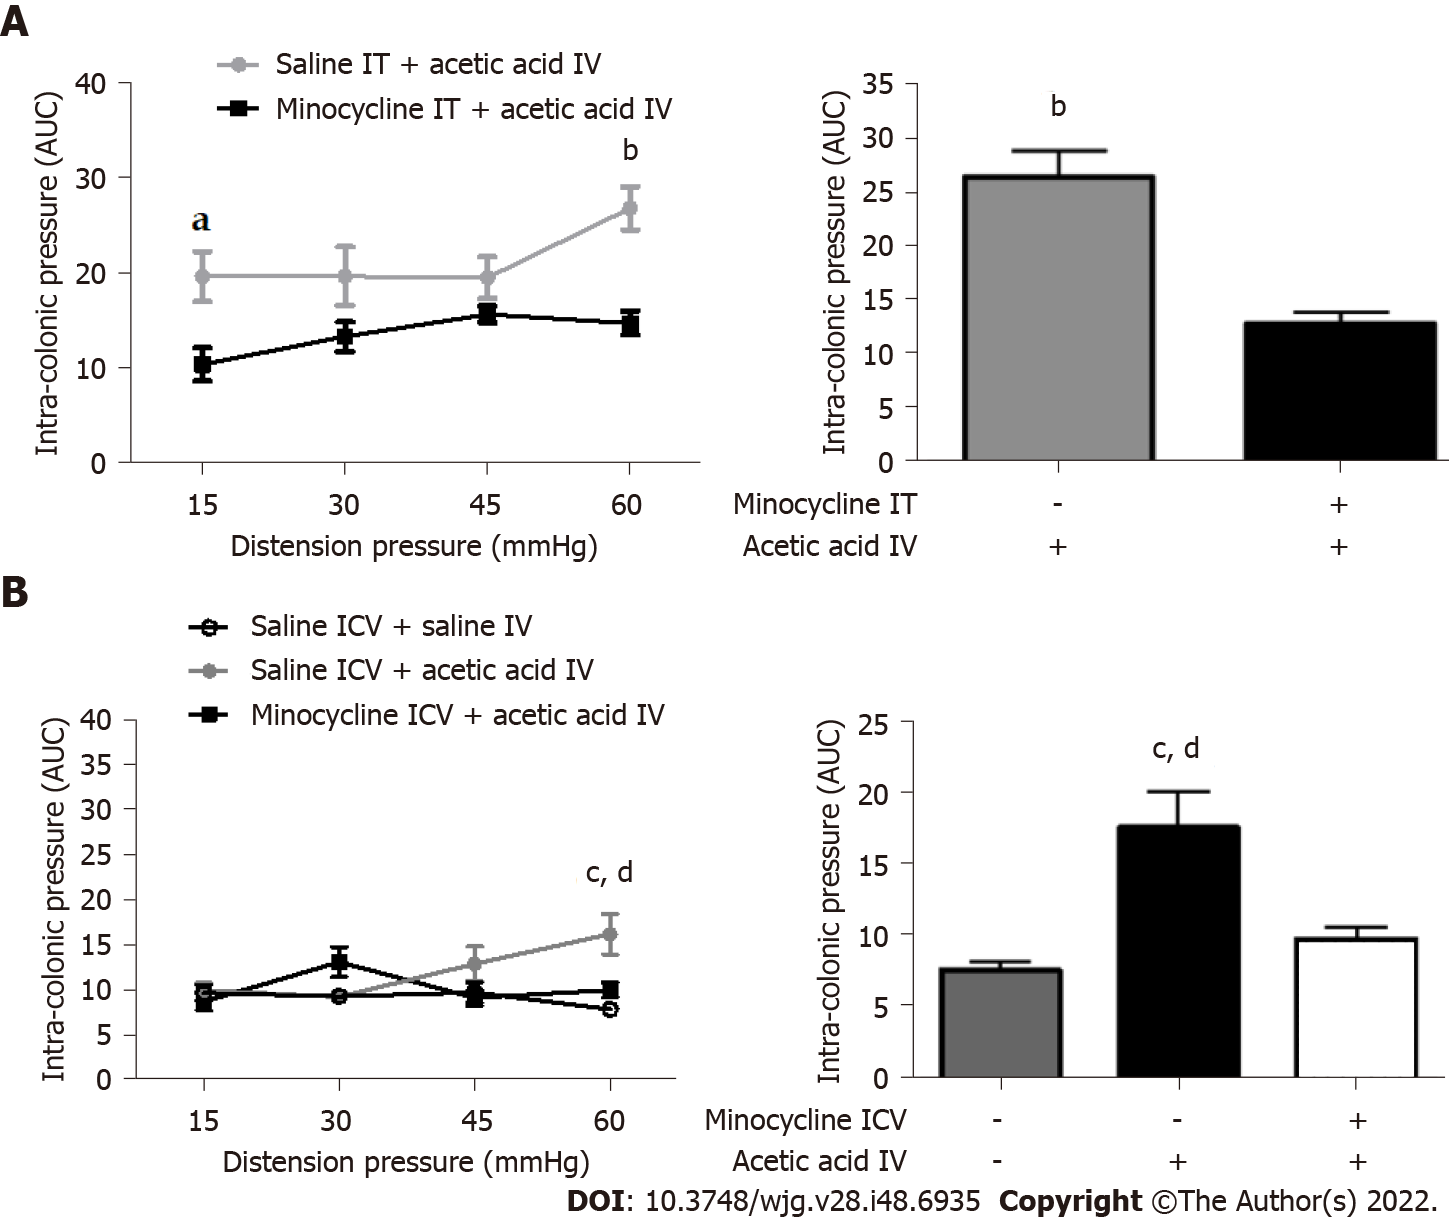
Figure 5 Effect of minocycline injection at the central level on visceral sensitivity.
A and B: Changes in intracolonic pressure in response to isobaric colorectal distensions (15, 30, 45 and 60 mmHg) intrathecal (IT) injections of saline (NaCl 0.9%) (A) or minocycline (1.25 mg/kg) prior to intravesical (IV) injections of acetic acid 0.75% and after intracerebroventricular (ICV) injections of saline or minocycline (1.25 mg/kg) (B) prior to IV injections of saline or acetic acid 0.75% in mice at day 7, both with details of the comparison at 60 mmHg of distension on the right. n = 6-8 mice per group. aP < 0.05 and bP < 0.001 (compared to the minocycline IT + acetic acid IV group); cP < 0.0001 (compared to the saline ICV + saline IV group); dP < 0.05 (compared to the minocycline ICV + acetic acid IV group). Variability in the results is represented by the standard error of the mean (area under the curve ± standard error of the mean). AUC: Area under the curve.
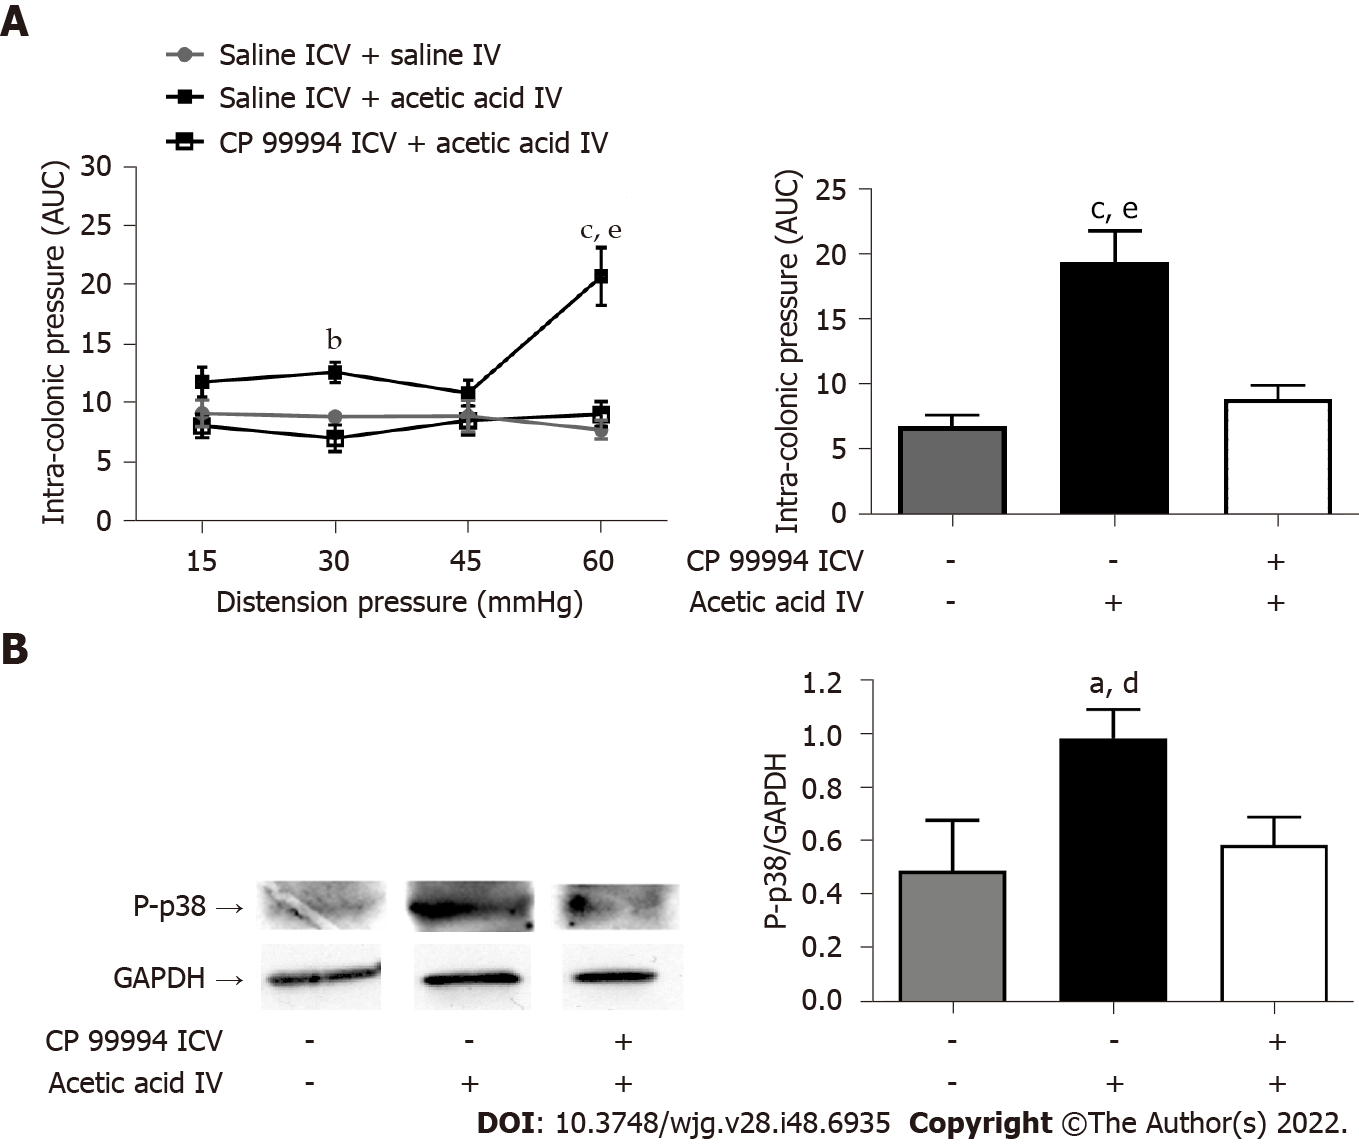
Figure 6 Effect of CP 99994 injection at the central level on visceral sensitivity and the expression of phosphorylated MAPK-p38.
A: Changes in intracolonic pressure in response to isobaric colorectal distensions (15, 30, 45 and 60 mmHg) after intracerebroventricular (ICV) injections of saline (NaCl 0.9%) or CP 99994 (7.5 mg/kg) prior to intravesical (IV) injection of saline or acetic acid 0.75% in mice at day 7, with details of the comparison at 60 mmHg of distension on the right. n = 8 mice per group; B: Expression of phosphorylated MAPK-p38 (P-p38) at the L6-S1 level of the spinal cord, with quantitative analysis (ratio to the reference protein GAPDH) on the right. Samples were run on separate gels and compiled for the figure. n = 5-8 mice per group. aP < 0.05, bP < 0.01 and cP < 0.001 (compared to the saline ICV + saline IV group); dP < 0.05 and eP < 0.001 (compared to the CP 99994 ICV + acetic acid IV group). Variability in the results is represented by the standard error of the mean (area under the curve ± standard error of the mean). AUC: Area under the curve.
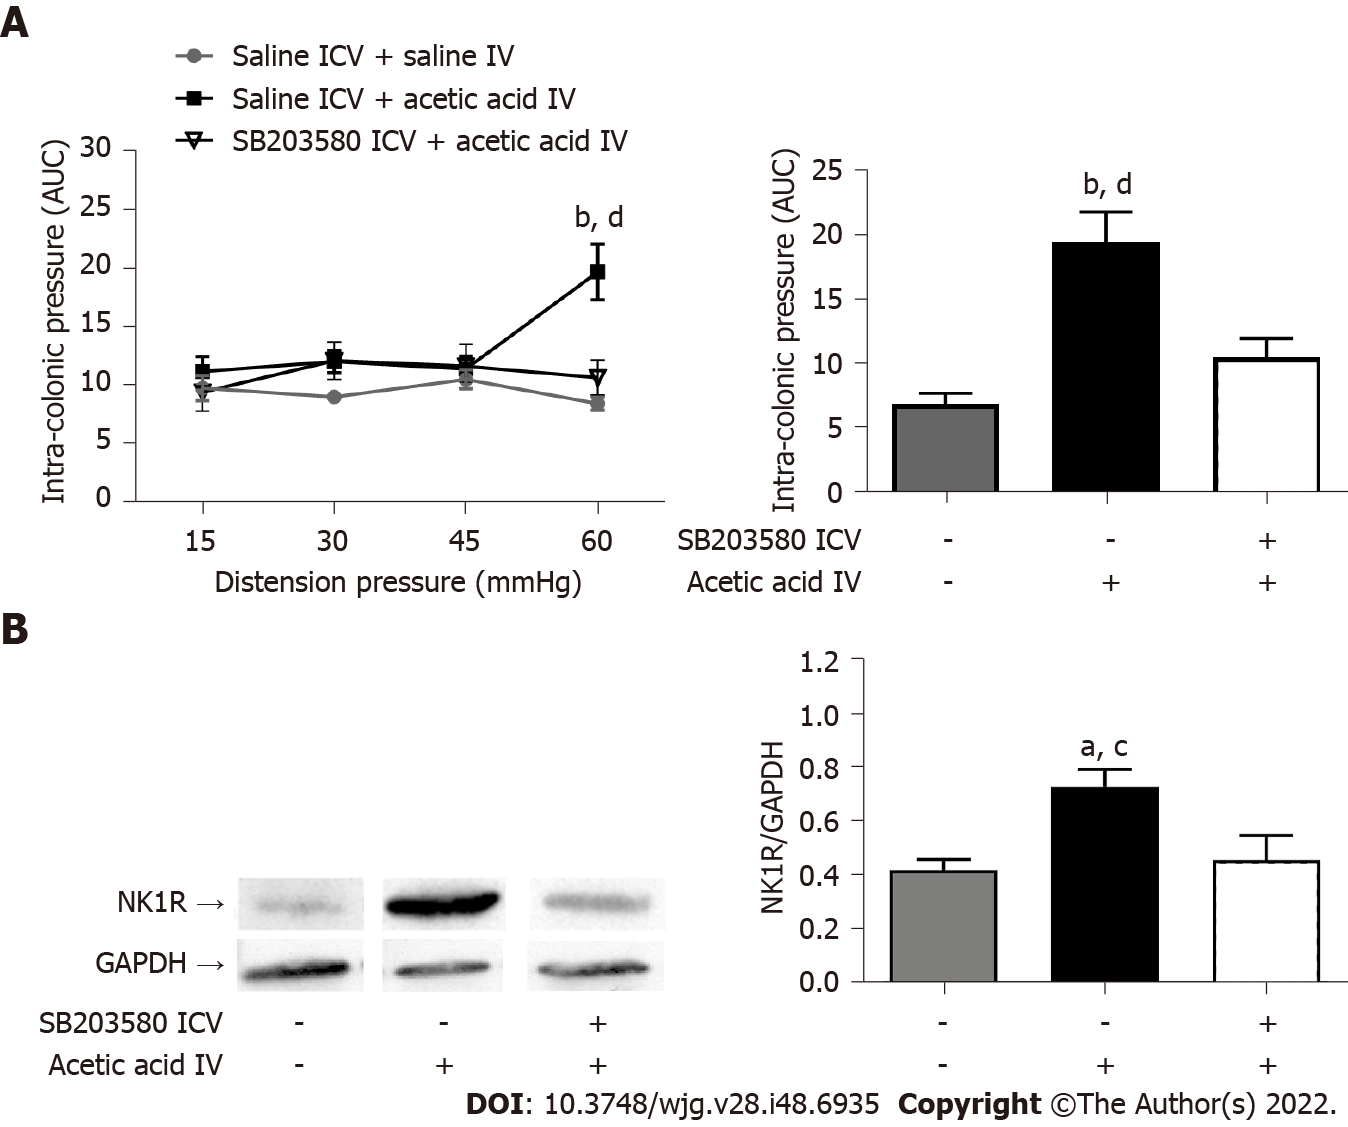
Figure 7 Effect of SB203580 injection at the central level on visceral sensitivity and the expression of NK1 receptors.
A: Changes in intracolonic pressure in response to isobaric colorectal distensions (15, 30, 45 and 60 mmHg) after intracerebroventricular (ICV) injections of saline (NaCl 0.9%) or SB203580 (2.5 mg/kg) prior to intravesical (IV) injection of saline or acetic acid 0.75% in mice at day 7, with details of the comparison at 60 mmHg of distension on the right. n = 8 mice per group; B: Expression of NK1R at the L6-S1 level of the spinal cord, with quantitative analysis (ratio to the reference protein GAPDH) on the right. Samples were run on separate gels and compiled for the figure. n = 5-8 mice per group. aP < 0.05 and bP < 0.001 (compared to the saline ICV + saline IV group); cP < 0.05 and dP < 0.01 (compared to the SB203580 ICV + acetic acid IV group). Variability in the results is represented by the standard error of the mean (area under the curve ± standard error of the mean). AUC: Area under the curve.
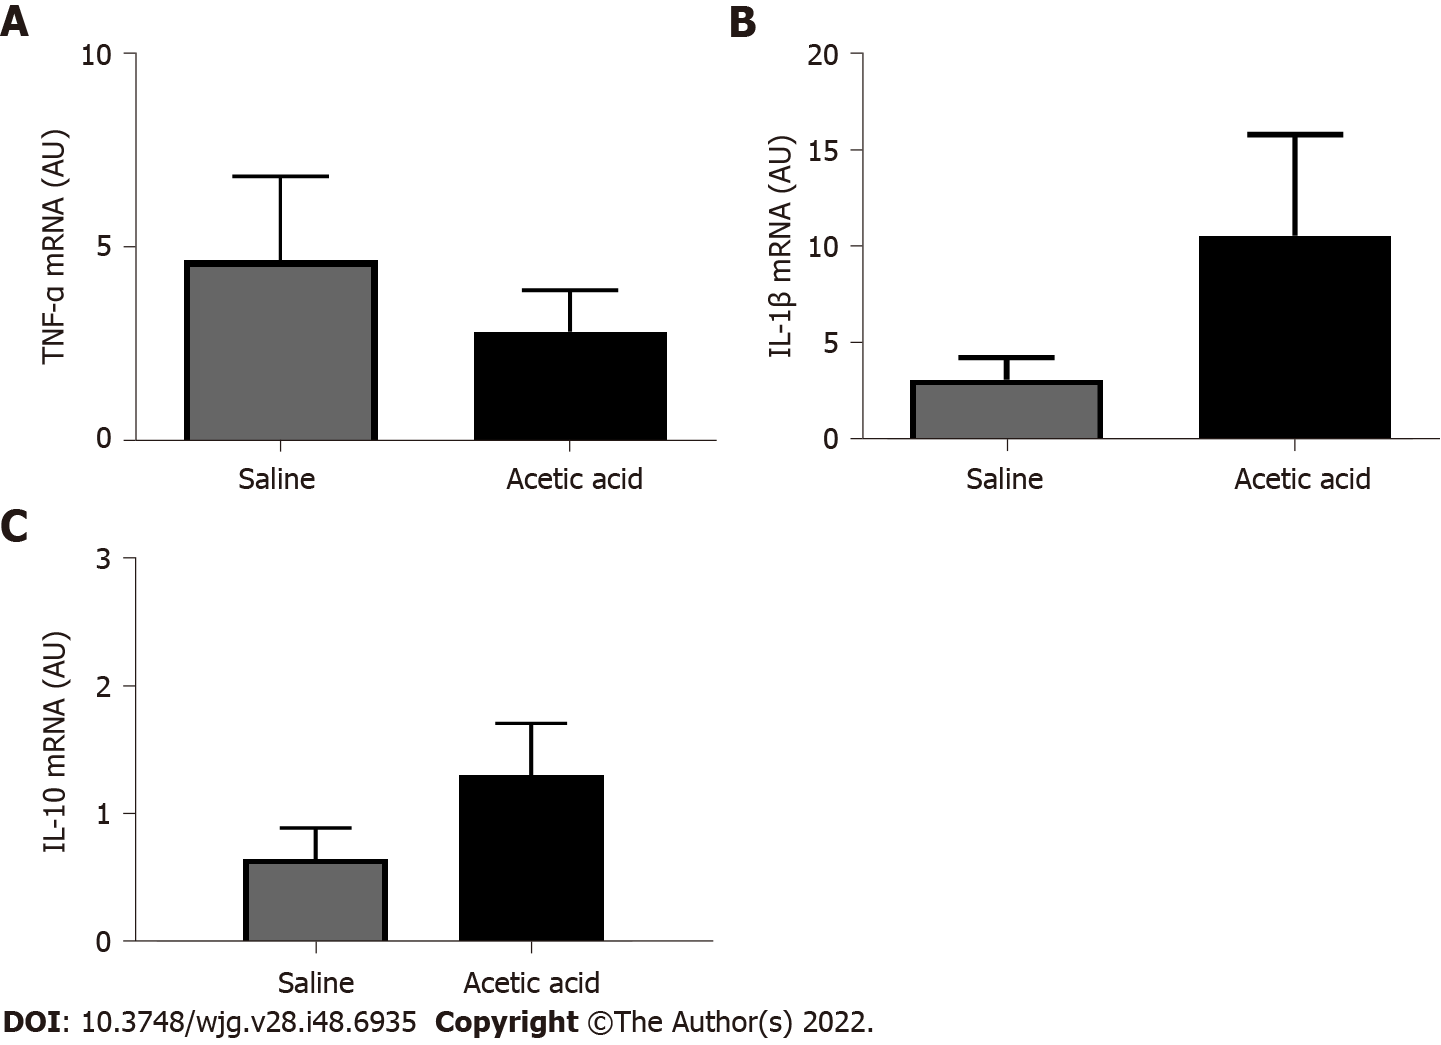
Figure 8 Expression of inflammatory cytokines in the spinal cord.
A-C: Expression levels of TNF-α (A), IL-1β (B) and IL-10 (C) mRNA in the L6-S1 level of the spinal cord on day 7 were not different between mice with intravesical injections of acetic acid 0.75% or saline (NaCl 0.9%) on day 7. n = 7 per group. Results were expressed as the mean ± standard error of the mean. AU: Arbitrary unit.
- Citation: Atmani K, Wuestenberghs F, Baron M, Bouleté I, Guérin C, Bahlouli W, Vaudry D, do Rego JC, Cornu JN, Leroi AM, Coëffier M, Meleine M, Gourcerol G. Bladder-colon chronic cross-sensitization involves neuro-glial pathways in male mice. World J Gastroenterol 2022; 28(48): 6935-6949
- URL: https://www.wjgnet.com/1007-9327/full/v28/i48/6935.htm
- DOI: https://dx.doi.org/10.3748/wjg.v28.i48.6935


