Copyright
©The Author(s) 2022.
World J Gastroenterol. Dec 21, 2022; 28(47): 6769-6787
Published online Dec 21, 2022. doi: 10.3748/wjg.v28.i47.6769
Published online Dec 21, 2022. doi: 10.3748/wjg.v28.i47.6769
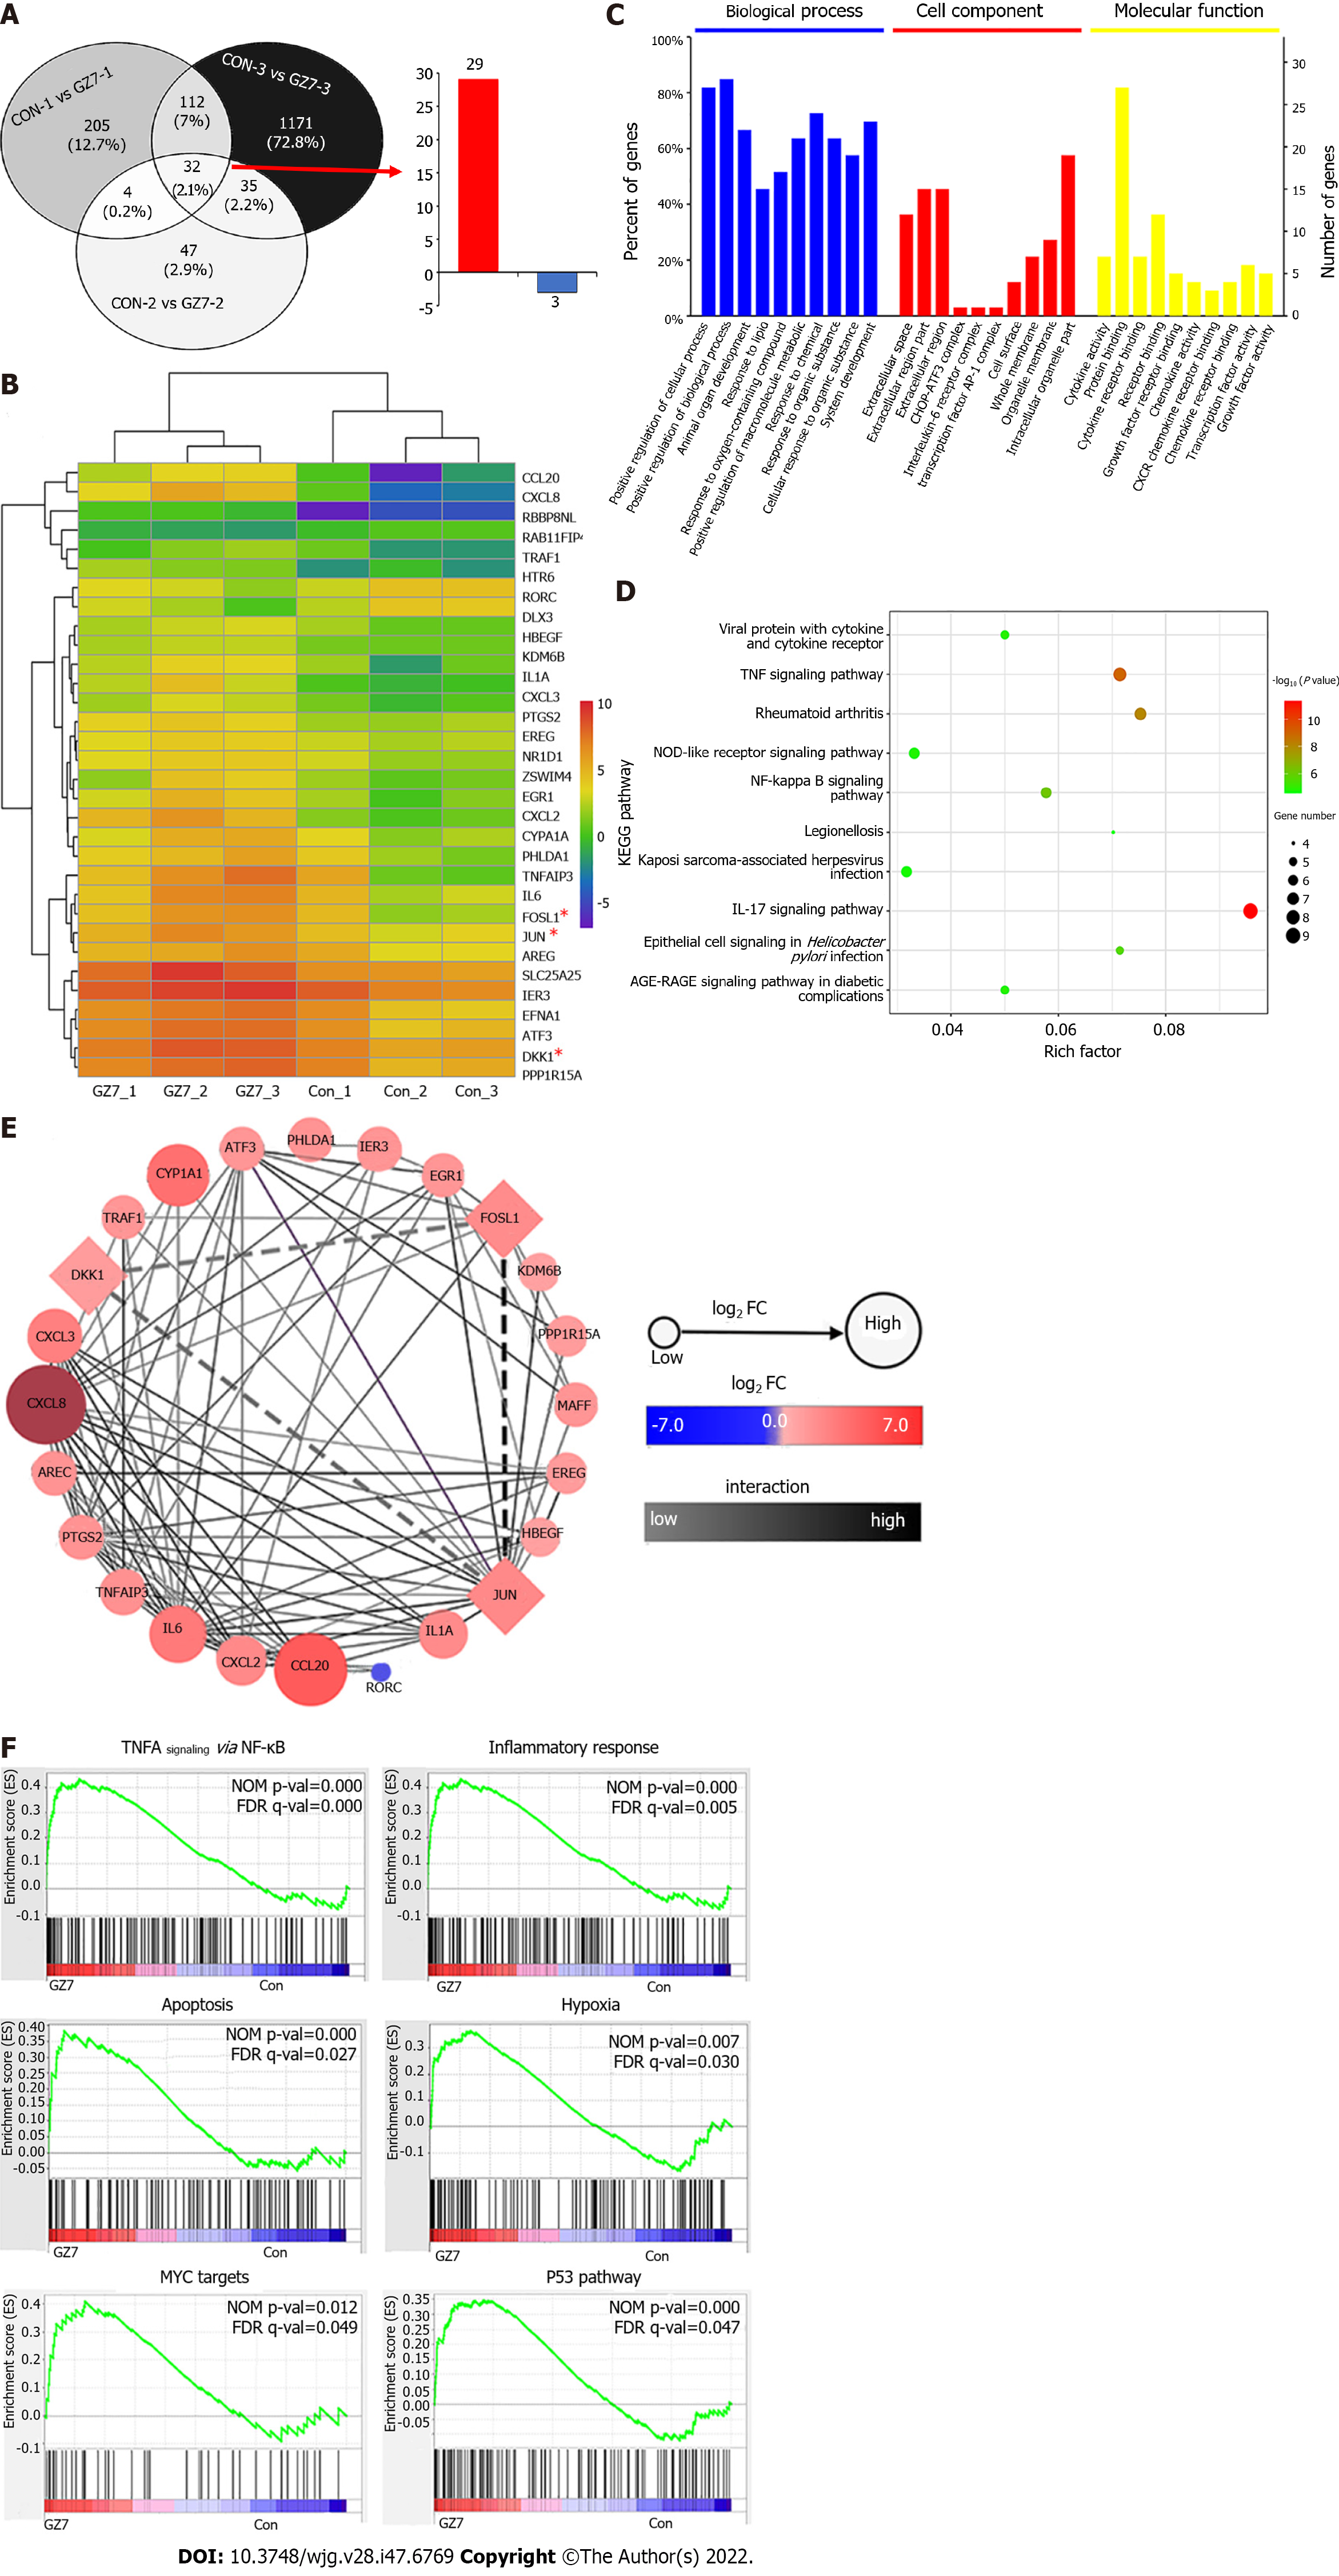
Figure 1 Comparison of differentially expressed genes between primary gastric cancer cells with and without Helicobacterpylori infection.
A: Venn diagram of differentially expressed genes (>DEGs); B: DEGs heatmap analysis by R heatmap package. Asterisks indicate the genes investigated in this study; C: Gene Ontology analysis of the DEGs; D: Kyoto Encyclopedia of Genes and Genomes pathway enrichment analysis of the DEGs; E: Protein-protein interaction network of the DEGs; F: Gene set enrichment analysis (GSEA) enrichment analyses of the DEGs with GSEA version 4.1.0. Con: Control; GZ7: Helicobacter pylori GZ7. TNF: Tumor necrosis factor; FOSL1: Fos-like antigen-1; DKK1: Dickkopf-related protein 1.
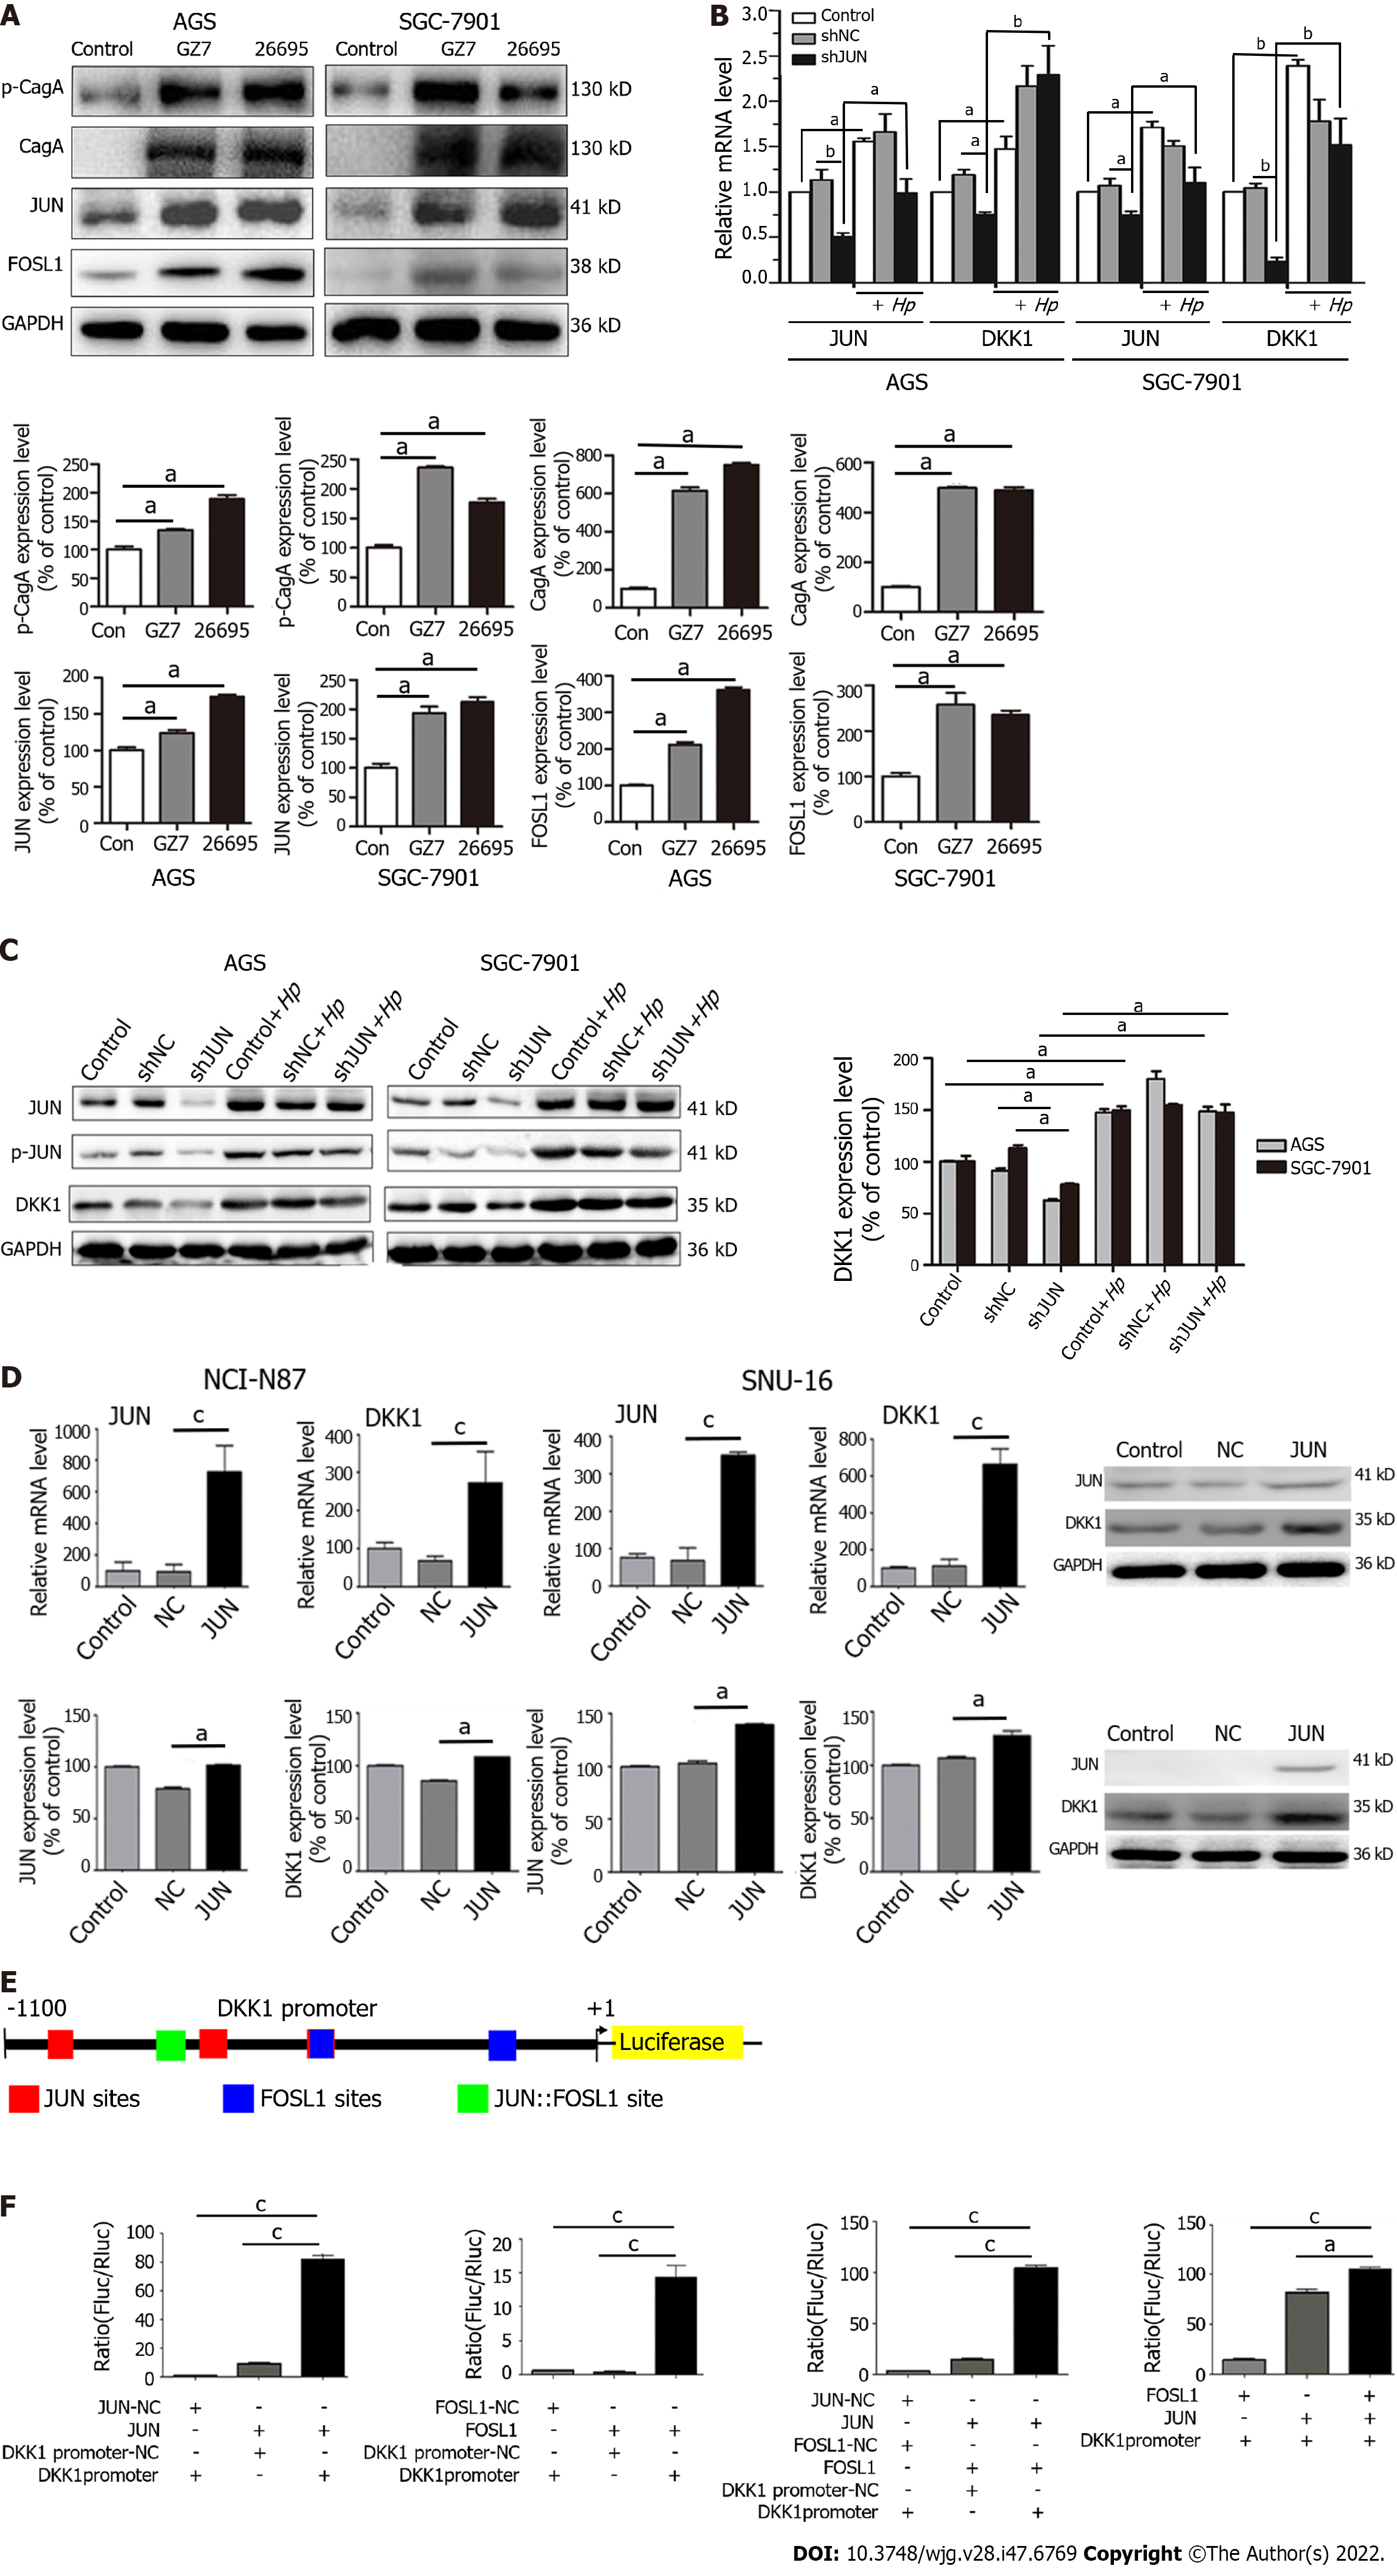
Figure 2 Helicobacterpylori infection increases JUN and fos-like antigen-1 expression to activate the dickkopf-related protein 1 promoter.
A: Western blotting for CagA, p-CagA, JUN, and fos-like antigen-1 (FOSL1) in AGS and SGC-7901 cells infected with Helicobacter pylori (H. pylori) for 6 h. aP < 0.05; B: RT-qPCR for JUN and dickkopf-related protein 1 (DKK1) in JUN knockdown and/or H. pylori-infected AGS and SGC-7901 cells. aP < 0.05; bP < 0.01; C: Western blotting for JUN, p-JUN, and DKK1 in JUN knockdown and/or H. pylori-infected AGS and SGC-7901 cells. aP < 0.05; D: RT-qPCR (top) and Western blotting (bottom) for JUN and DKK1 in NCI-N87 and SNU-16 cells with JUN overexpression. aP < 0.05; cP < 0.001; E: Prediction of AP-1 binding sites in the DKK1 promoter (from -1100 to + 1 bps) by JASPAR; F: JUN and/or FOSL1 promotes DKK1 promoter activity in AGS cells by dual-luciferase reporter assay. The ratio of firefly to Renilla luciferase (Fluc/Rluc) is used to display the results. aP < 0.01; cP < 0.001; Con: Control; Hp: H. pylori; GZ7: H. pylori GZ7; 26695: H. pylori 26695. FOSL1: Fos-like antigen-1; DKK1: Dickkopf-related protein 1; H. pylori: Helicobacter pylori.
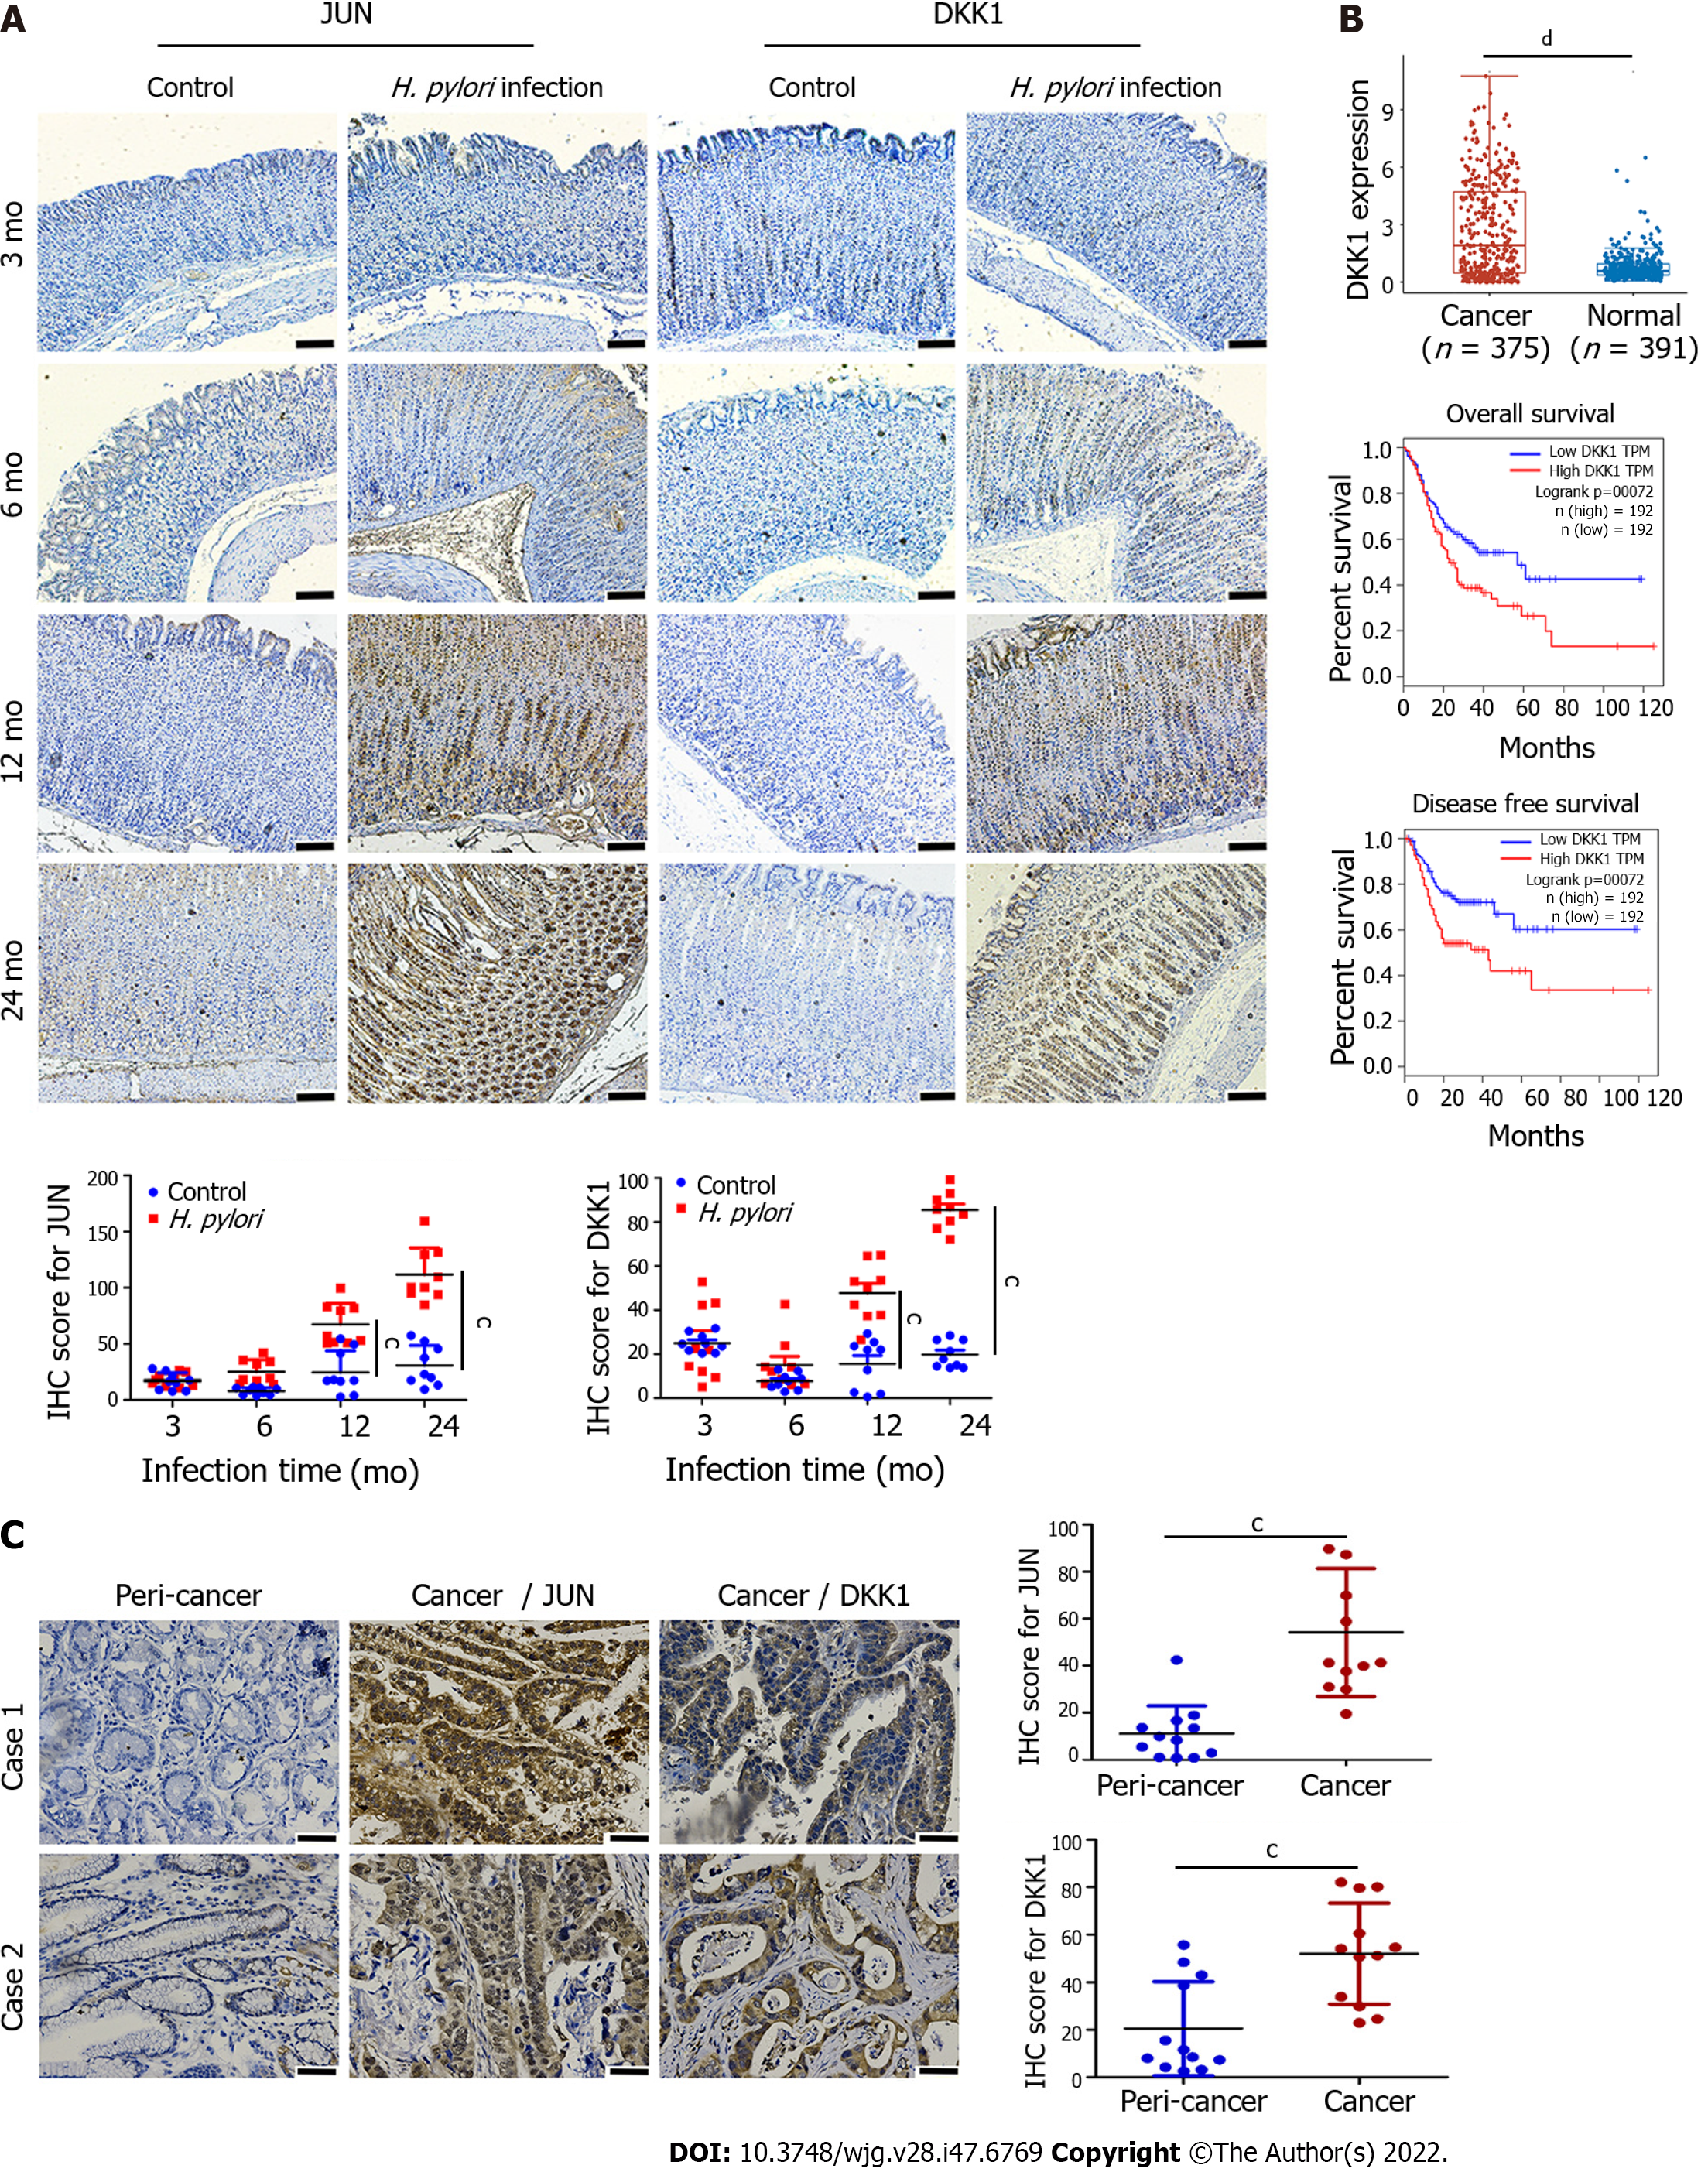
Figure 3 Immunohistochemistry for JUN and dickkopf-related protein 1 in gerbil stomach infected with Helicobacterpylori and gastric cancer tissues.
A: Immunohistochemical analysis of JUN and dickkopf-related protein 1 (DKK1) proteins in Helicobacter pylori (H. pylori)-infected gerbil stomach tissues at 3 mo, 6 mo, 12 mo, and 24 mo post-infection (n = 3). Dot diagrams show the quantification of JUN and DKK1 staining in immunohistochemical samples. Nine sections were chosen randomly from three different samples and used to determine mean ± SD of the immunohistochemistry (IHC) score, which was calculated as described in the methods. Scale bar = 100 μm. cP < 0.001; B: DKK1 expression and survival analysis in gastric cancer patients from the TCGA-STAD dataset. dP < 0.0001; C: Representative images of immunohistochemical staining of JUN and DKK1 proteins in human gastric cancer specimens. Dot diagrams show the quantitation of JUN and DKK1 staining. Scale bar = 50 μm. Data from 12 clinical samples of gastric cancer patients are expressed as mean ± SD. cP < 0.001. DKK1: Dickkopf-related protein 1; H. pylori: Helicobacter pylori.
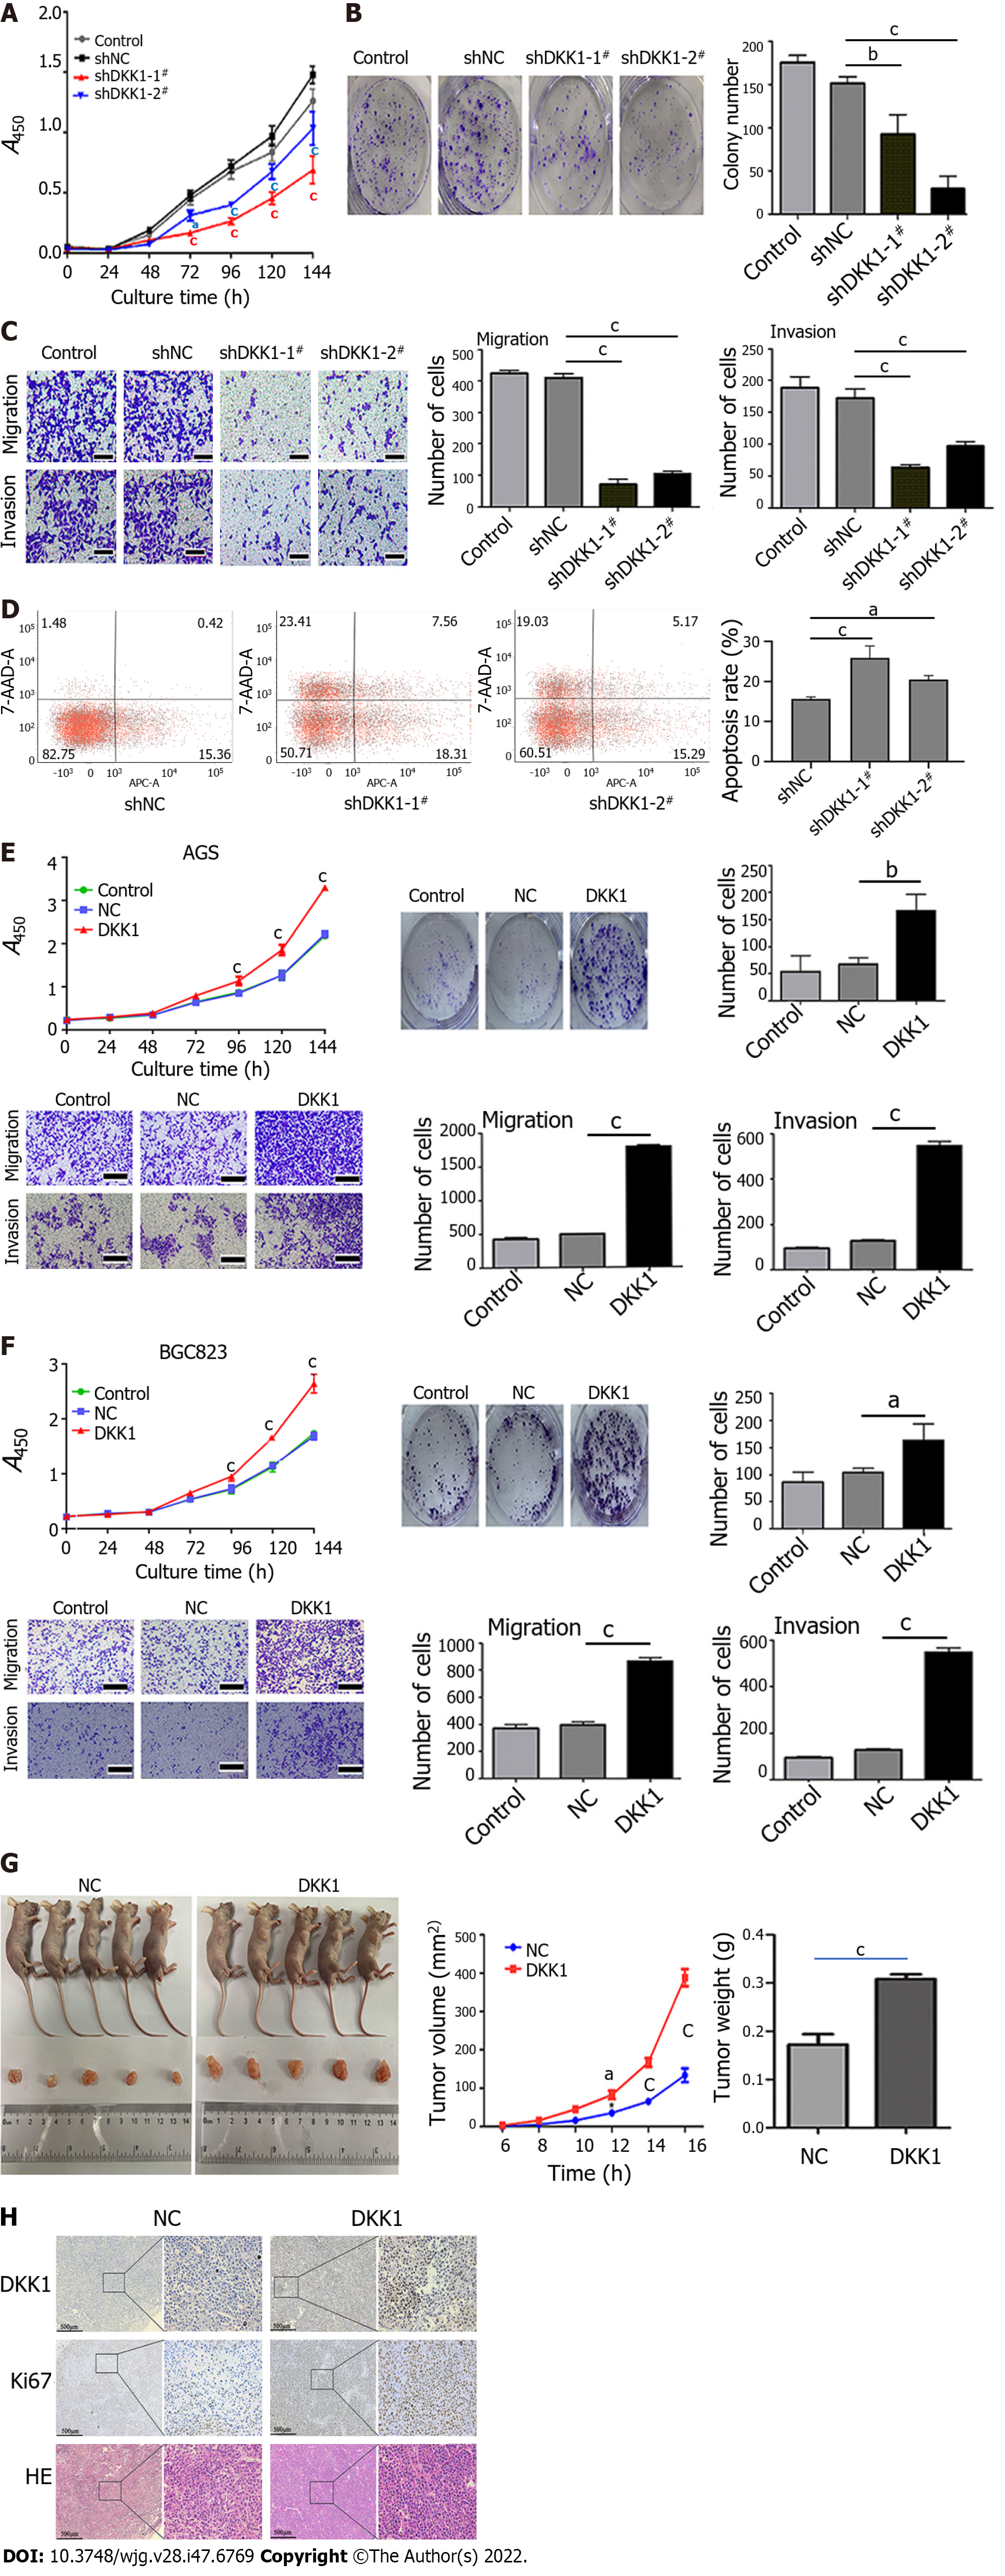
Figure 4 The effects of dickkopf-related protein 1 knockdown and overexpression on gastric cancer cell growth, migration, invasion, apoptosis, and xenograft growth in nude mice.
A: Growth curve of dickkopf-related protein 1 (DKK1) knockdown AGS cells using CCK8 assay. aP < 0.05; cP < 0.001; B: Colony formation assay of AGS cells with DKK1 knockdown. bP < 0.01; cP < 0.001; C: Migration and invasion assay of DKK1 knockdown AGS cells using Transwell system. Bar graphs show the number of migrated or invaded cells (right). cP < 0.001. Scale bar = 200 μm; D: Flow cytometry analysis for apoptosis in DKK1 knockdown AGS cells. Bar graphs show the percentage of apoptotic cells (right). aP < 0.05; cP < 0.001; E and F: CCK8, colony formation, and Transwell assays were used to measure the growth curve, colony formation, migration, and invasion of AGS (E) and BGC823 (F) cells with DKK1 overexpression. aP < 0.05; bP < 0.01; cP < 0.001; Scale bar = 200 μm; G: DKK1 overexpression promotes xenograft tumor growth in nude mice. Line dot and bar graph show tumor volume and weight, respectively (n = 5 mice per group). aP < 0.05; cP < 0.001; H: Hematoxylin eosin staining of xenograft tumors and immunohistochemical analysis of DKK1 and Ki67 in xenograft tumors from nude mice. The boxed regions are magnified to the right. Scale bar = 500 μm. DKK1: Dickkopf-related protein 1; HE: Hematoxylin eosin.
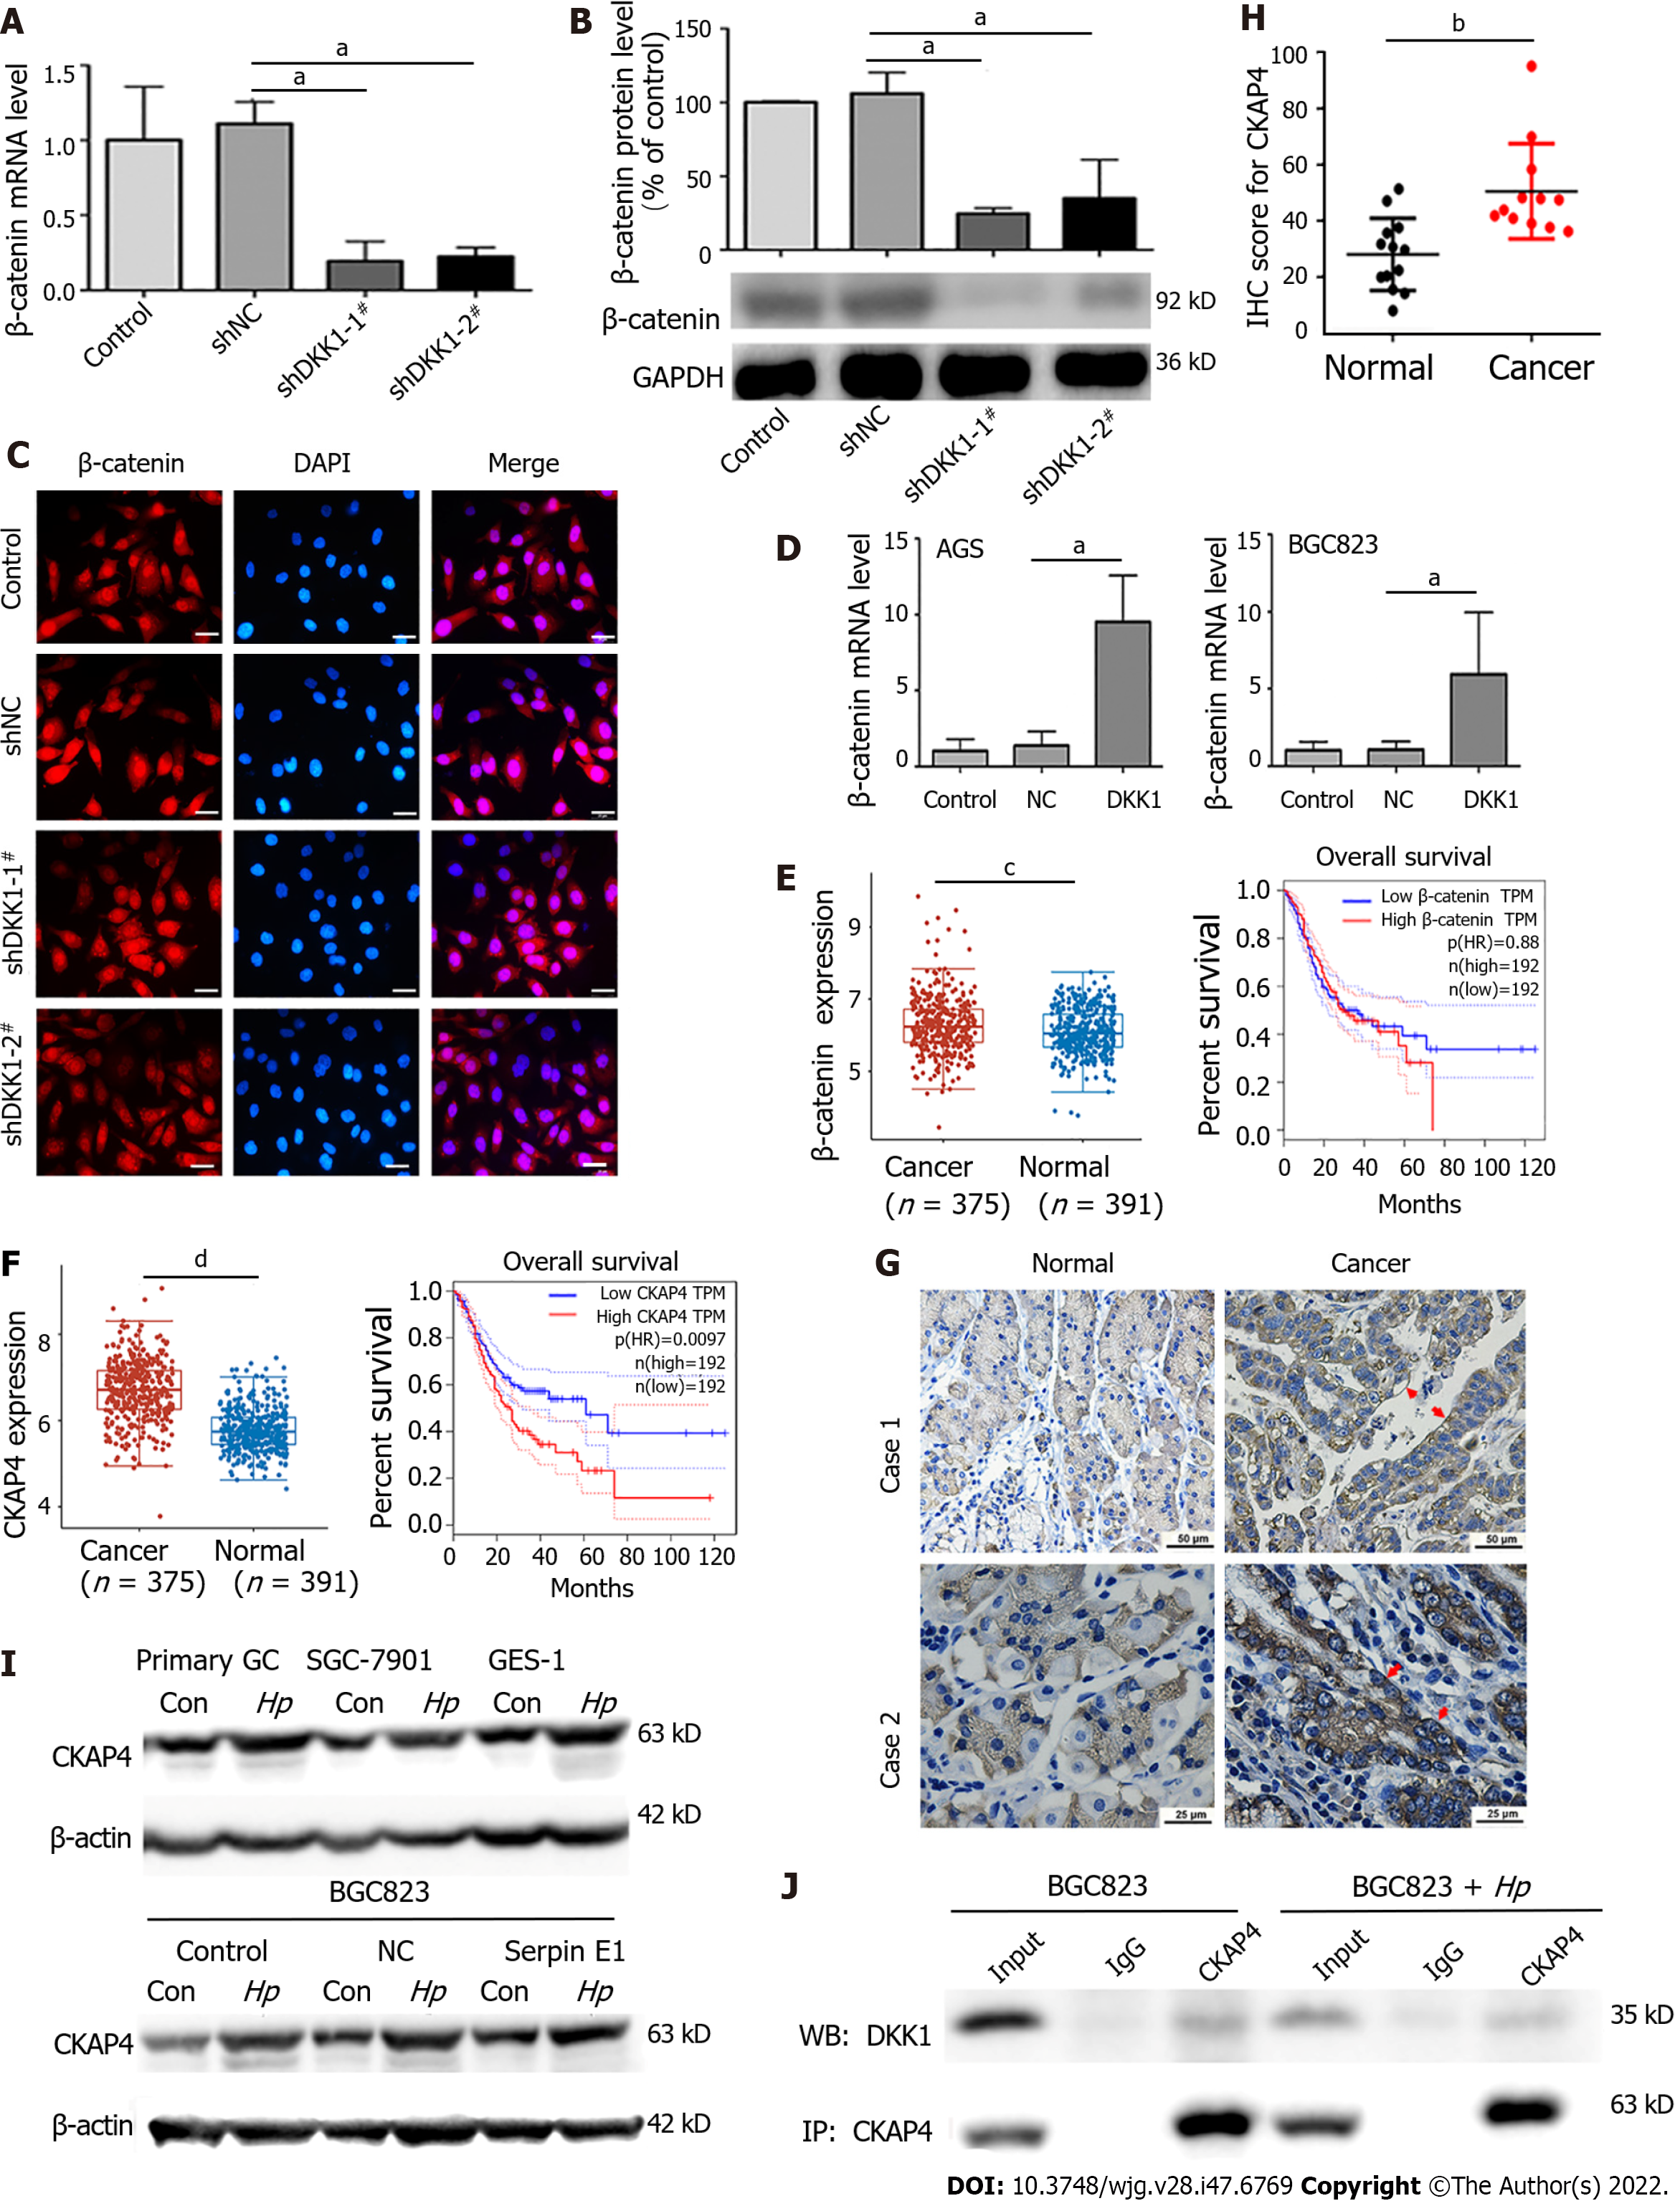
Figure 5 Dickkopf-related protein 1 promotes β-catenin and cytoskeleton-associated protein 4 expression and the binding of dickkopf-related protein 1 to cytoskeleton-associated protein 4 in gastric cancer tissues and cells but does not affect the nuclear translocation of β-catenin.
A-C: Dickkopf-related protein 1 (DKK1) knockdown decreases β-catenin expression without changing β-catenin nuclear translocation in AGS cells, as determined using RT-qPCR (A), Western blotting (B), and immunofluorescence (C). Scale bar = 25 μm; aP < 0.05; D: RT-qPCR for β-catenin in AGS and BGC823 cells with DKK1 overexpression. aP < 0.05; E: β-catenin expression and its association with 10-year overall survival in gastric cancer (GC) samples of the TCGA-STAD database. cP < 0.001; F: Cytoskeleton-associated protein 4 (CKAP4) expression and its positive association with 10-year overall survival in GC samples of the TCGA-STAD database. dP < 0.0001; G: Immunohistochemical staining of CKAP4 in clinical GC tissues and matched normal tissues. The red arrow indicates CKAP4 expression in the cell membrane; H: CKAP4 staining quantification in G. Data from 12 independent samples are expressed as means ± SD. bP < 0.01; I: Western blotting for CKAP4 in GC cells with or without Helicobacter pylori (H. pylori) infection for 72 h; J: Co-IP of DKK1 and CKAP4 in BGC823 cells with and without H. pylori infection for 72 h. Con: Control; Hp: H. pylori. DKK1: Dickkopf-related protein 1; H. pylori: Helicobacter pylori; CKAP4: Cytoskeleton-associated protein 4; GC: Gastric cancer.
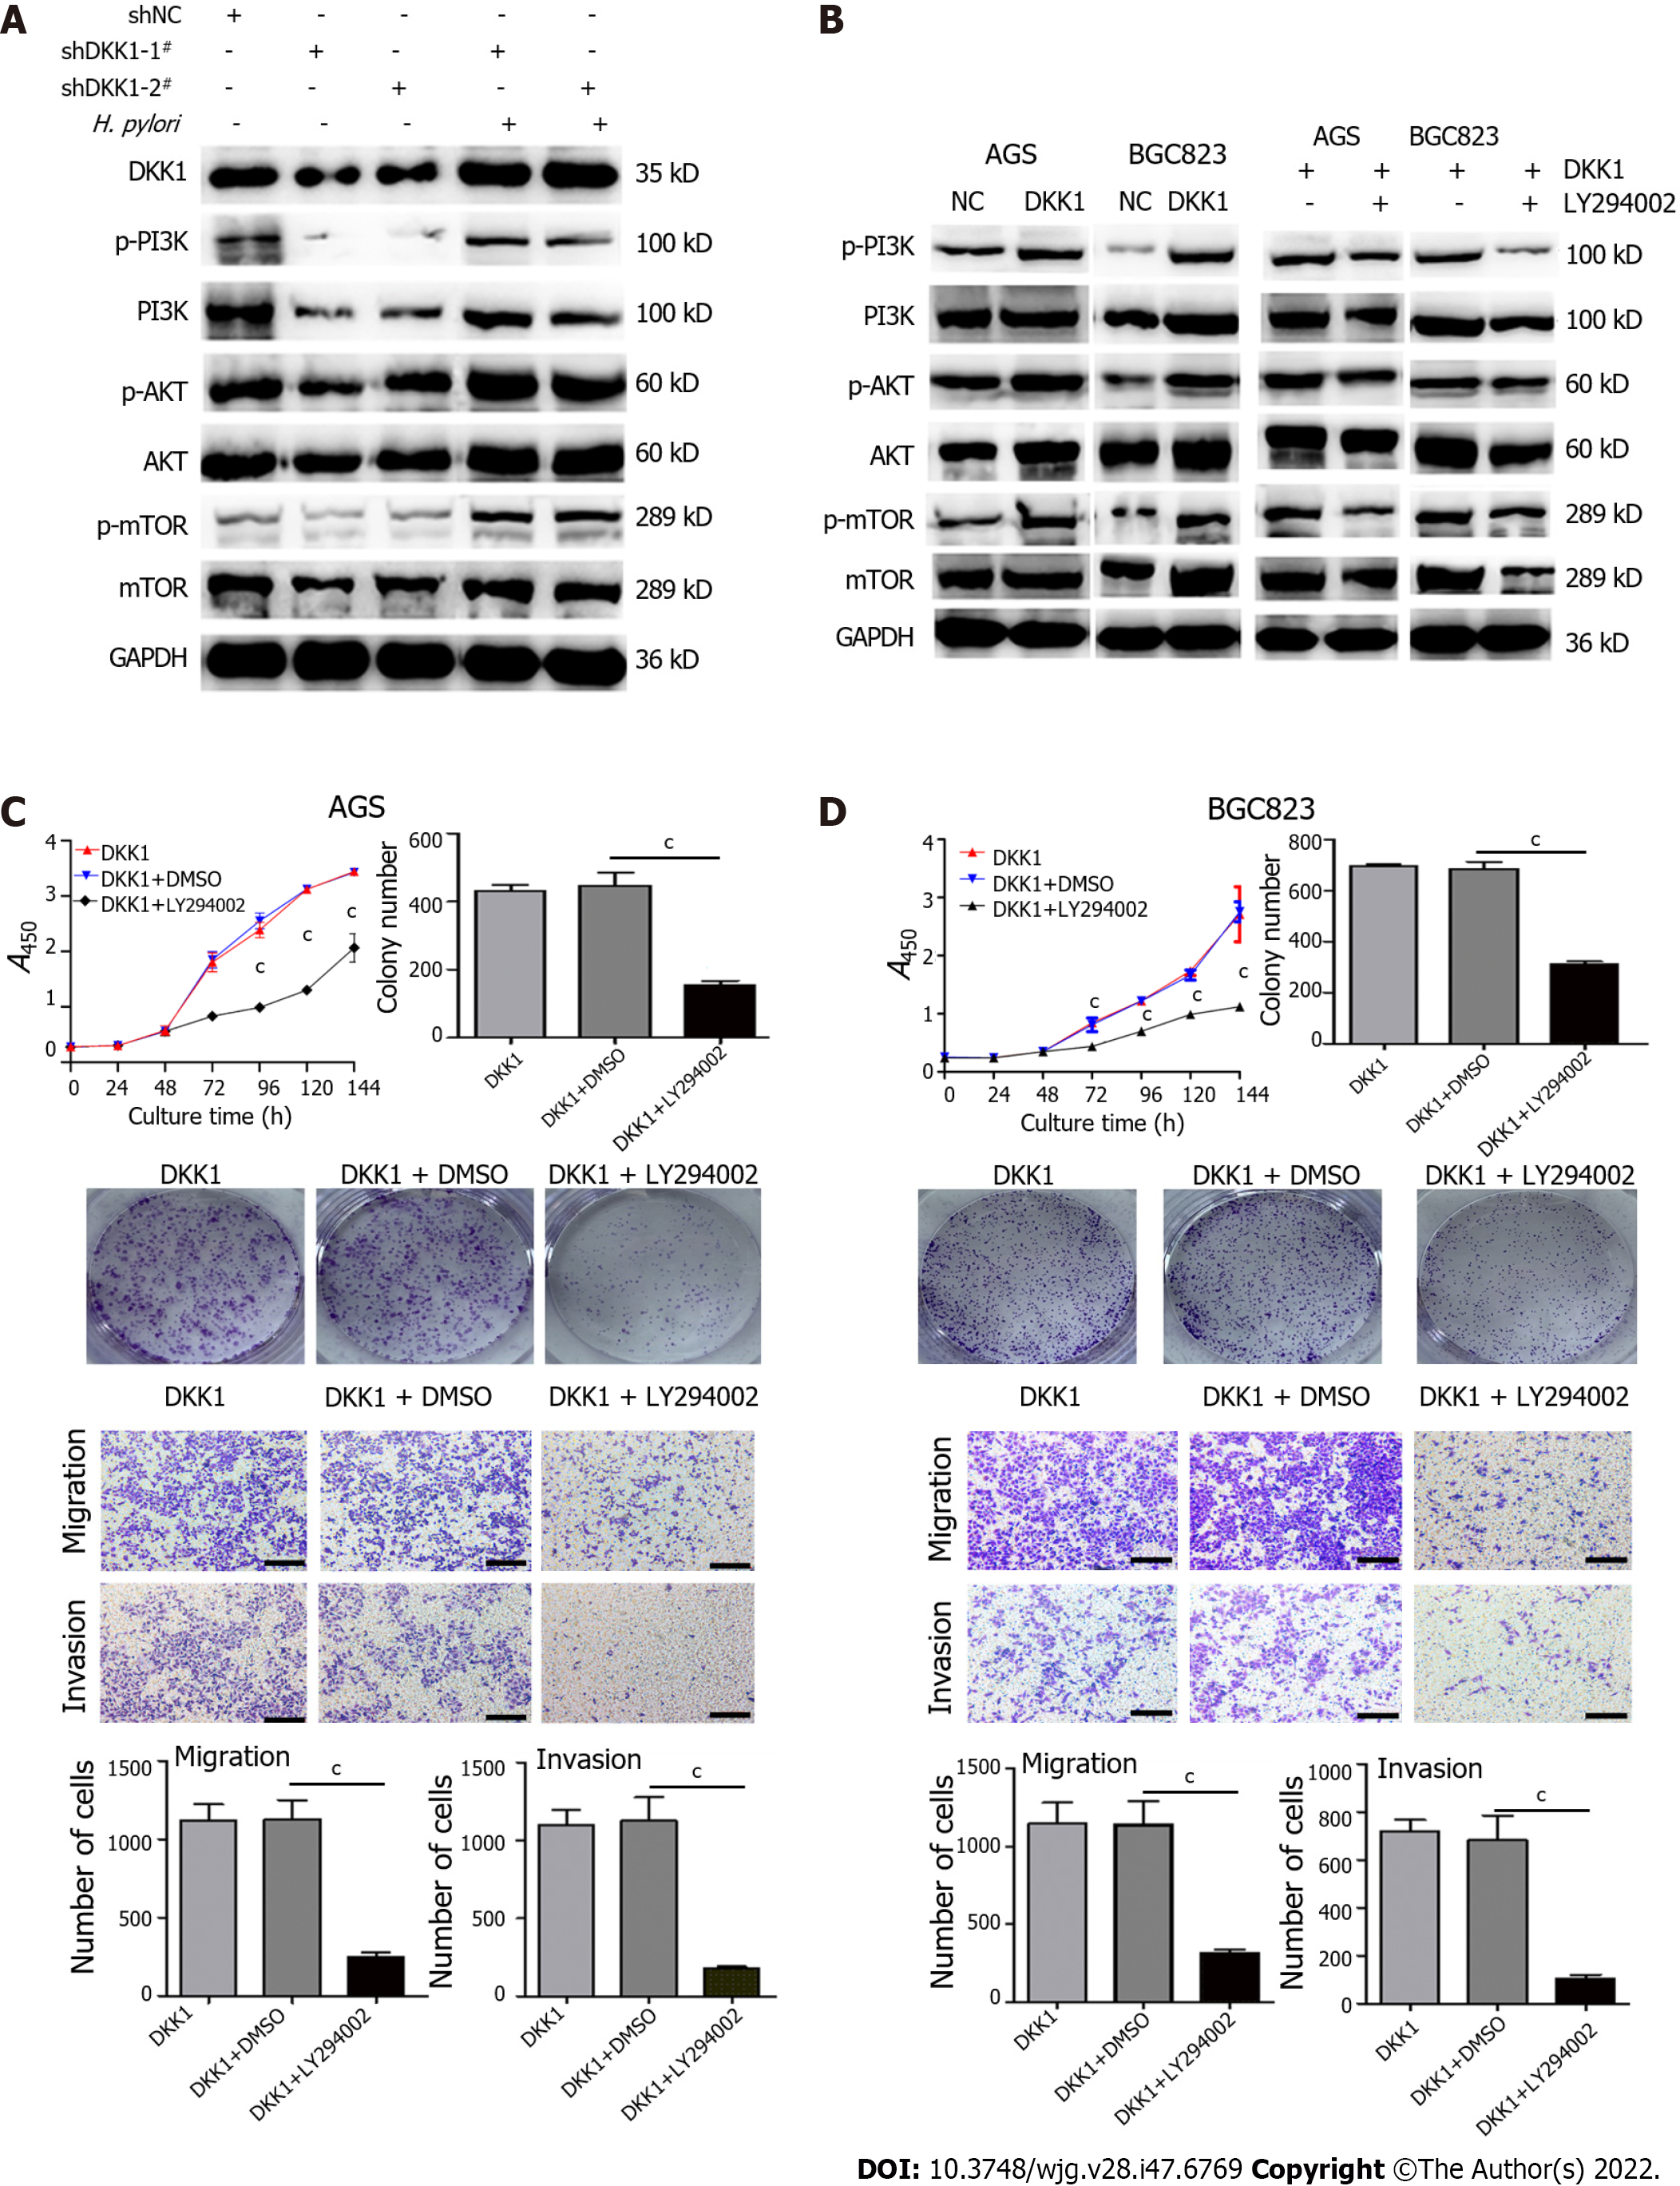
Figure 6 Dickkopf-related protein 1 promotes the growth, migration, and invasion of AGS and BGC823 cells by activating the phosphatidylinositol 3-kinase/AKT/ mammalian target of rapamycin pathway.
A and B: Western blotting for phosphatidylinositol 3-kinase (PI3K), p-PI3K, AKT, p-AKT, mammalian target of rapamycin (mTOR), and p-mTOR in dickkopf-related protein 1 (DKK1) knockdown and/or Helicobacter pylori-infected AGS cells (A) and DKK1 overexpression and/or LY294002 (50 μmol/L)-treated AGS and BGC823 cells (B); C and D: LY294002 treatment (50 μmol/L) decreases cell proliferation, colony formation, migration, and invasion in DKK1 overexpression AGS (C) and BGC823 (D) cells. Bar graphs show the quantitation of colony numbers or migrated and invaded cell numbers. Scale bar = 200 μm. cP < 0.001. DKK1: Dickkopf-related protein 1; H. pylori: Helicobacter pylori; PI3K: Phosphatidylinositol 3-kinase; mTOR: Mammalian target of rapamycin.
- Citation: Luo M, Chen YJ, Xie Y, Wang QR, Xiang YN, Long NY, Yang WX, Zhao Y, Zhou JJ. Dickkopf-related protein 1/cytoskeleton-associated protein 4 signaling activation by Helicobacter pylori-induced activator protein-1 promotes gastric tumorigenesis via the PI3K/AKT/mTOR pathway. World J Gastroenterol 2022; 28(47): 6769-6787
- URL: https://www.wjgnet.com/1007-9327/full/v28/i47/6769.htm
- DOI: https://dx.doi.org/10.3748/wjg.v28.i47.6769


