Copyright
©The Author(s) 2022.
World J Gastroenterol. Dec 21, 2022; 28(47): 6752-6768
Published online Dec 21, 2022. doi: 10.3748/wjg.v28.i47.6752
Published online Dec 21, 2022. doi: 10.3748/wjg.v28.i47.6752
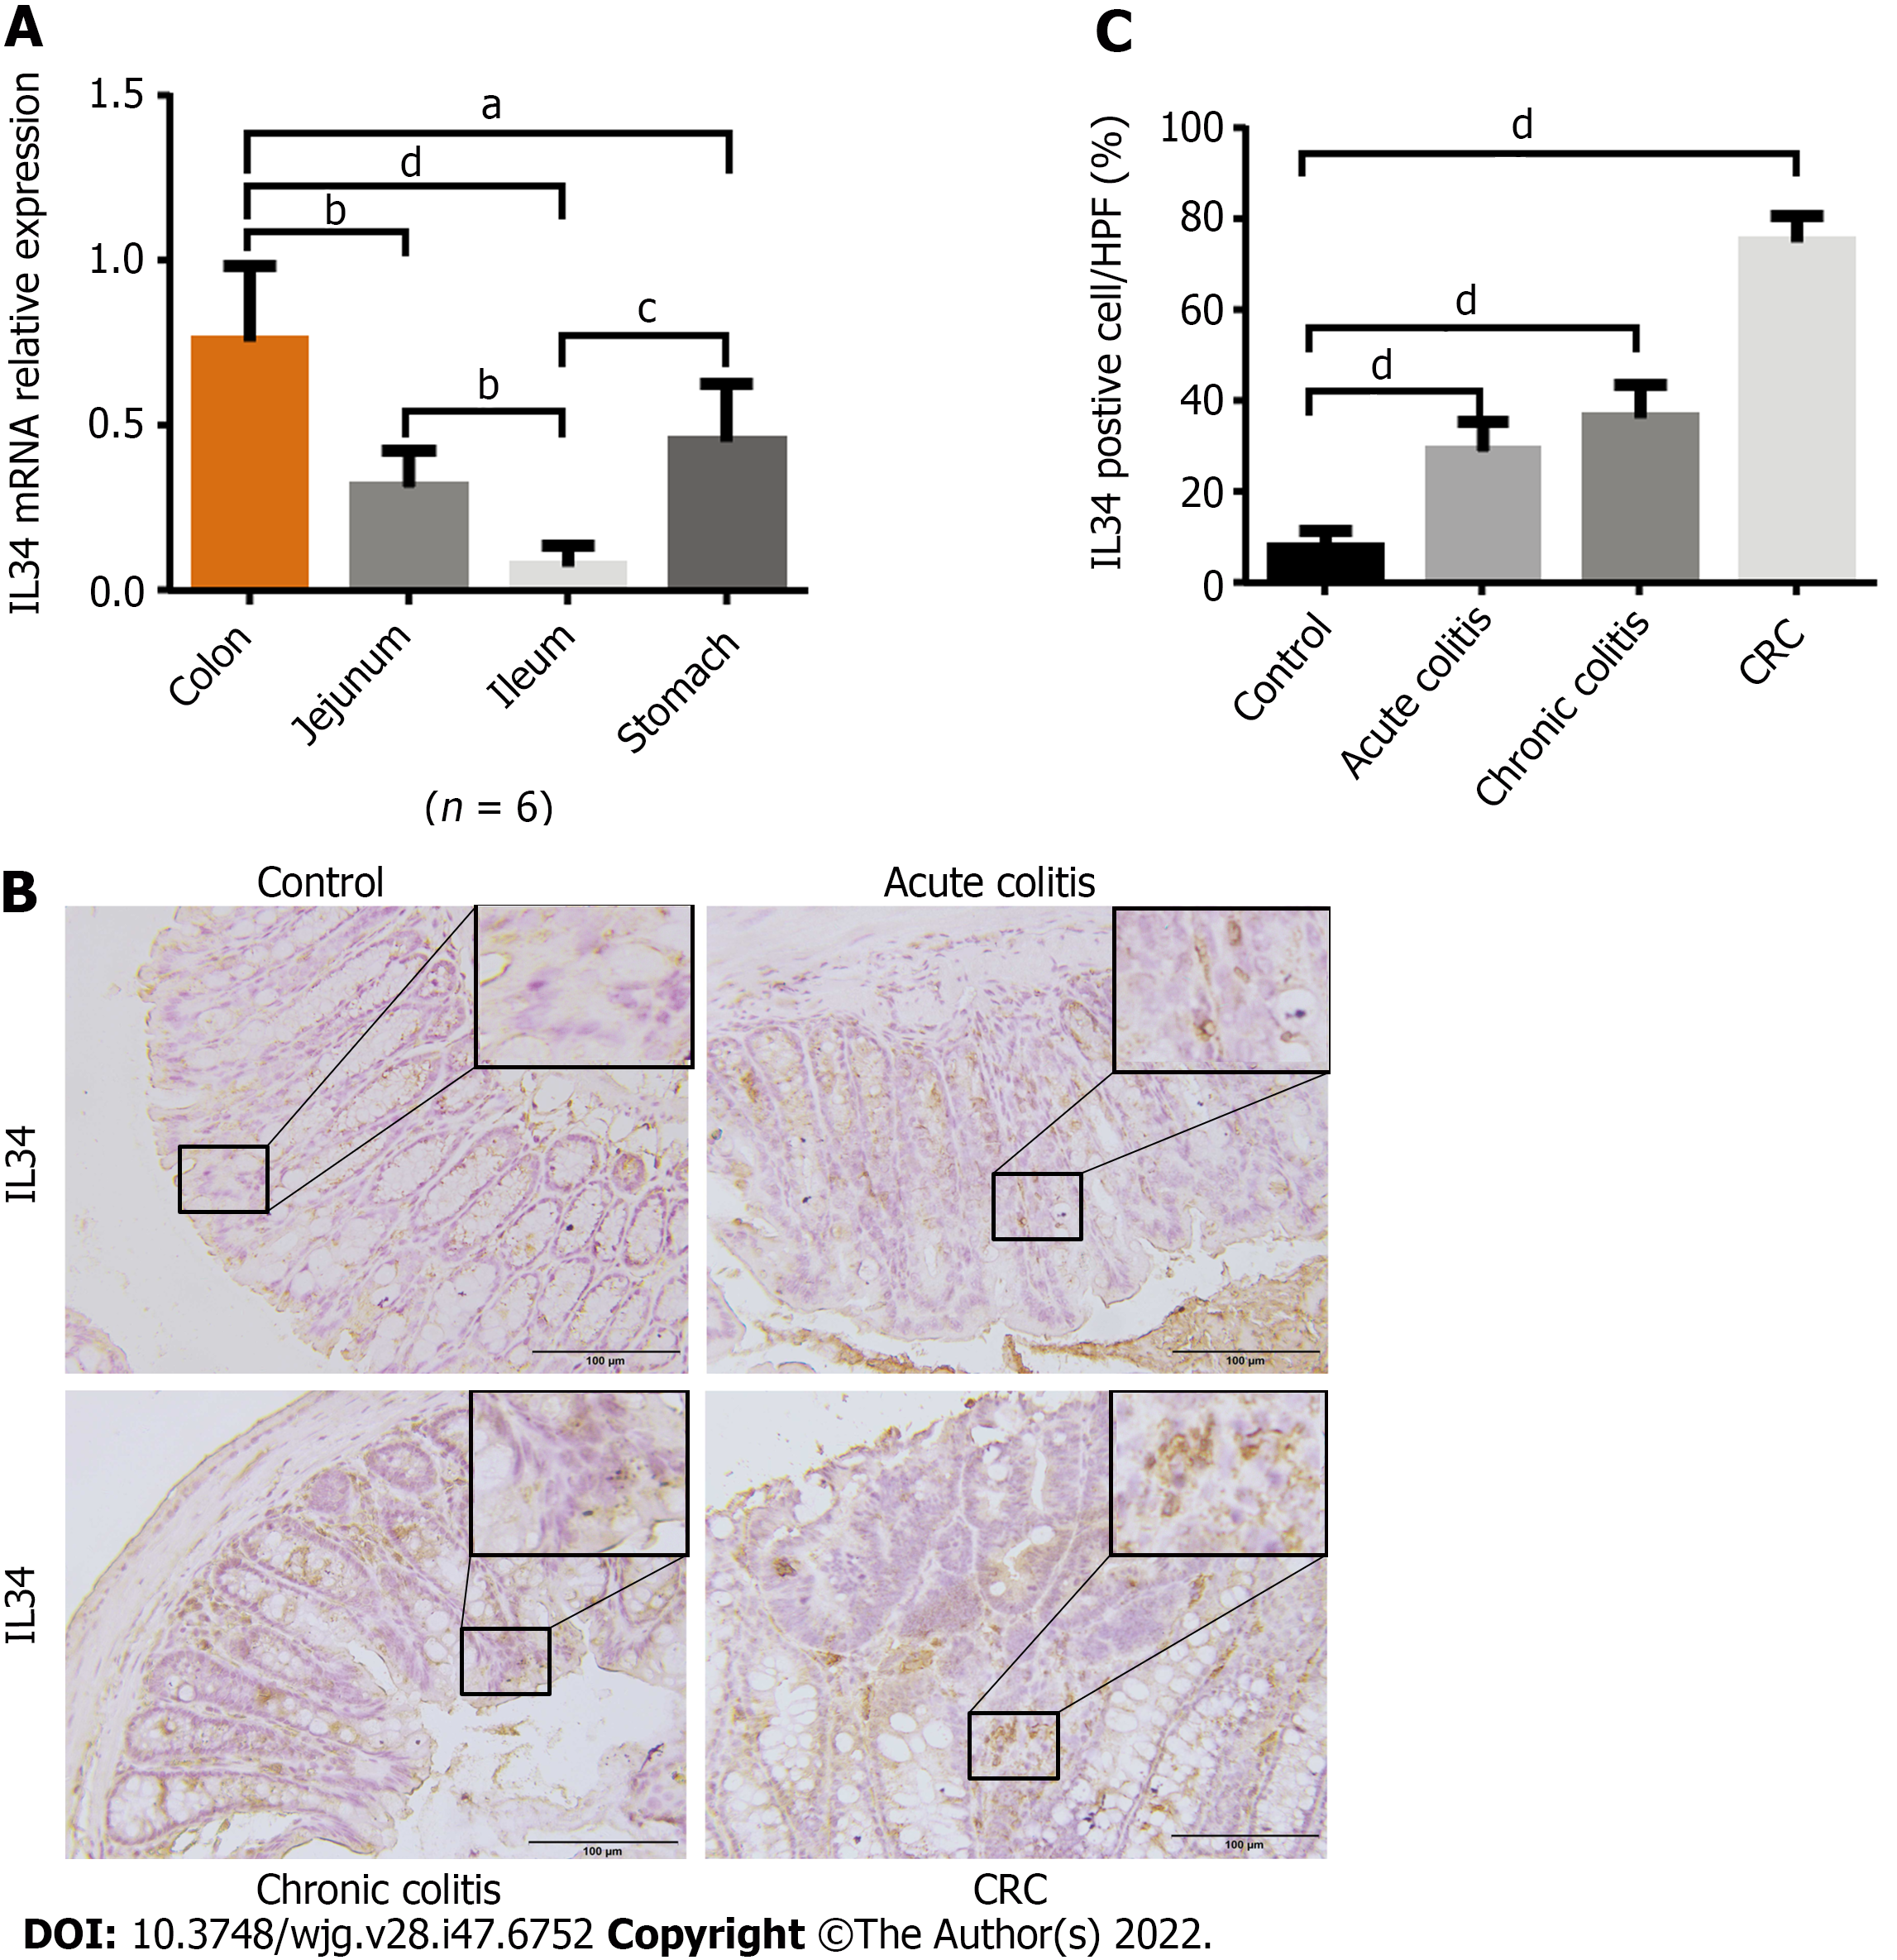
Figure 1 Interleukin-34 is elevated in colitis and colitis-related cancers.
A: Interleukin-34 (IL-34) relative mRNA expression in stomach, jejunum, ileum and colon in wild-type mice (C57BL/6J) (n = 6); B and C: The dynamic of IL-34 expression in dextran sodium sulfate (DSS)-induced colitis and azoxymethane-DSS-induced colorectal cancer in wild-type mice (n = 6 per group); representative IL-34 immunohistochemical staining for healthy control, acute colitis, chronic colitis and colorectal cancer mice (B); the percentage of IL-34-positive cells per high-power field were quantified in colonic tissue of four groups of mice (n = 6 per group) (C). AOM: Azoxymethane; CRC: Colorectal cancer; DSS: Dextran sodium sulfate; IL-34: Interleukin-34. Scale bars = 100 μm. Data depict the mean ± SD. aP < 0.05, bP < 0.01, cP < 0.005, dP < 0.001.
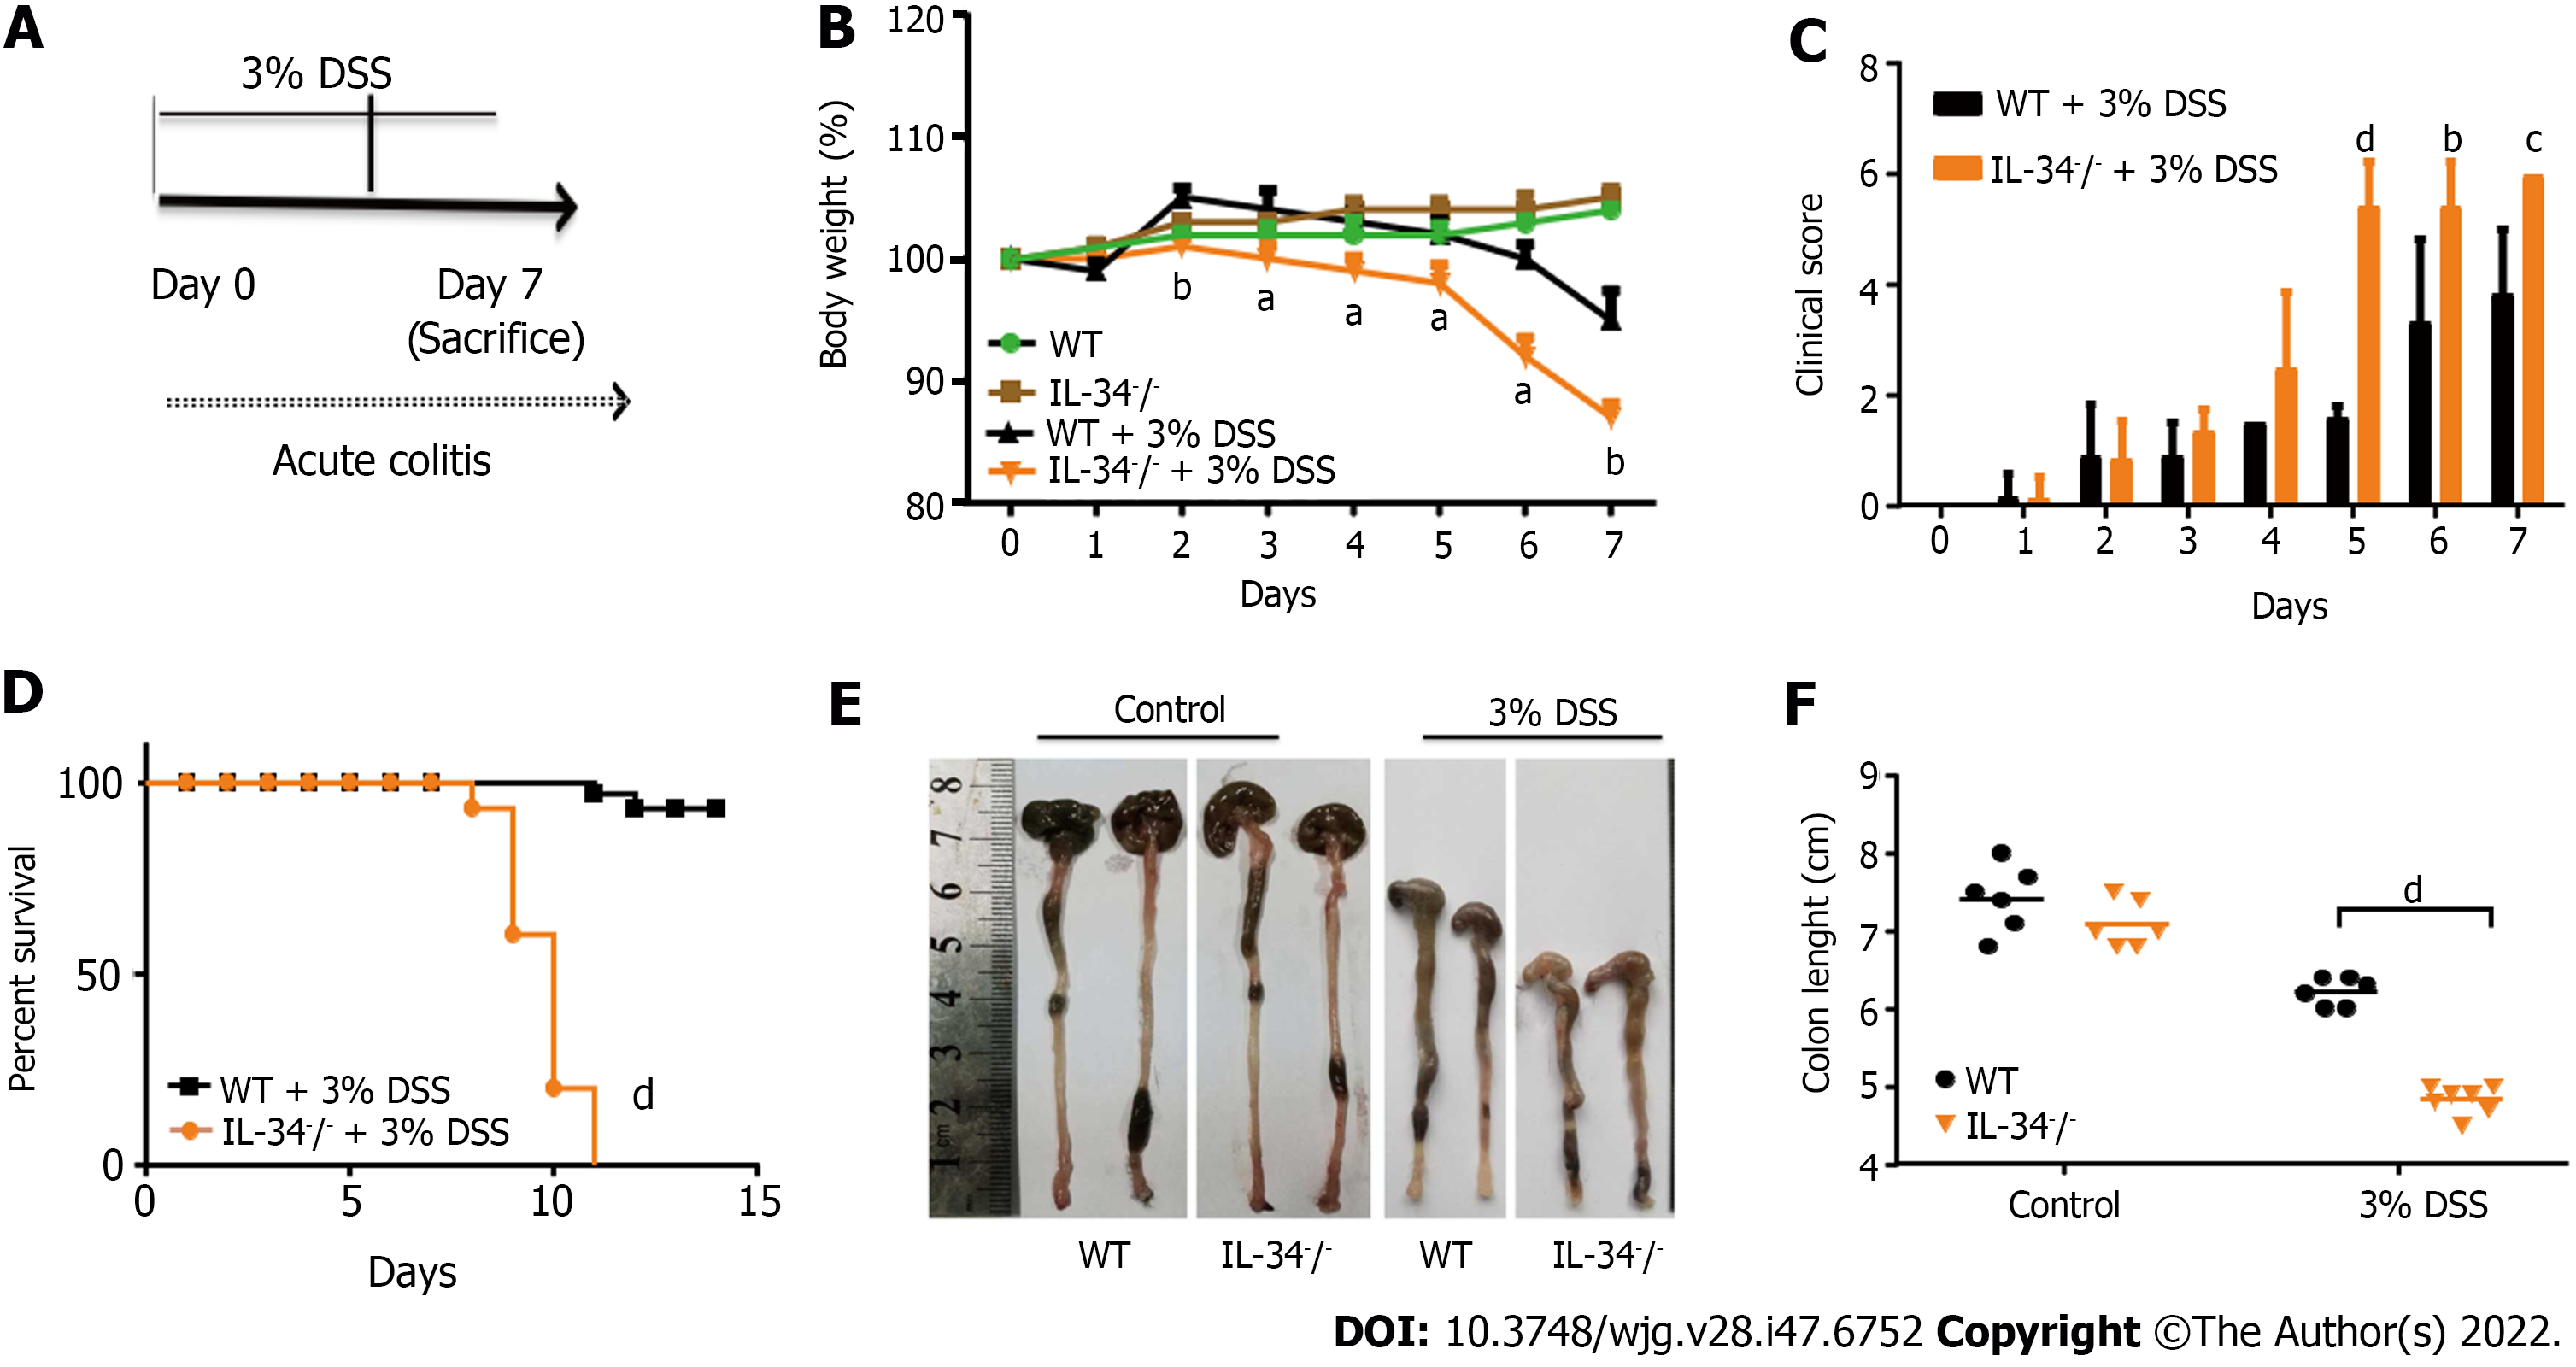
Figure 2 Interleukin-34 deficiency aggravates acute colitis induced by dextran sodium sulfate.
A: Schematic of the design of acute dextran sodium sulfate (DSS)-induced colitis model. IL-34-/- and WT mice were fed with a 3% DSS solution in drinking water for 7 d and then sacrificed (n = 6 or 7 per group); B: Body weight was represented as a percentage of starting weight in IL-34-/- and WT mice after administration of 3% DSS (n = 6 or 7 per group); C: The clinical score of IL-34-/- and WT mice treated with 3% DSS (n = 6 or 7 per group). Data depict the mean ± SD; D: Kaplan-Meier survival curves were plotted in IL-34-/- and WT mice administrated with 3% DSS for 15 d (n = 10 per group); E and F: Colon length was measured in IL-34-/- and WT mice fed with 3% DSS for 7 d (n = 6 or 7 per group). DSS: Dextran sodium sulfate; IL-34: Interleukin-34; WT: Wild-type. Data depict the mean ± SD. aP < 0.05, bP < 0.01, cP < 0.005, dP < 0.001.
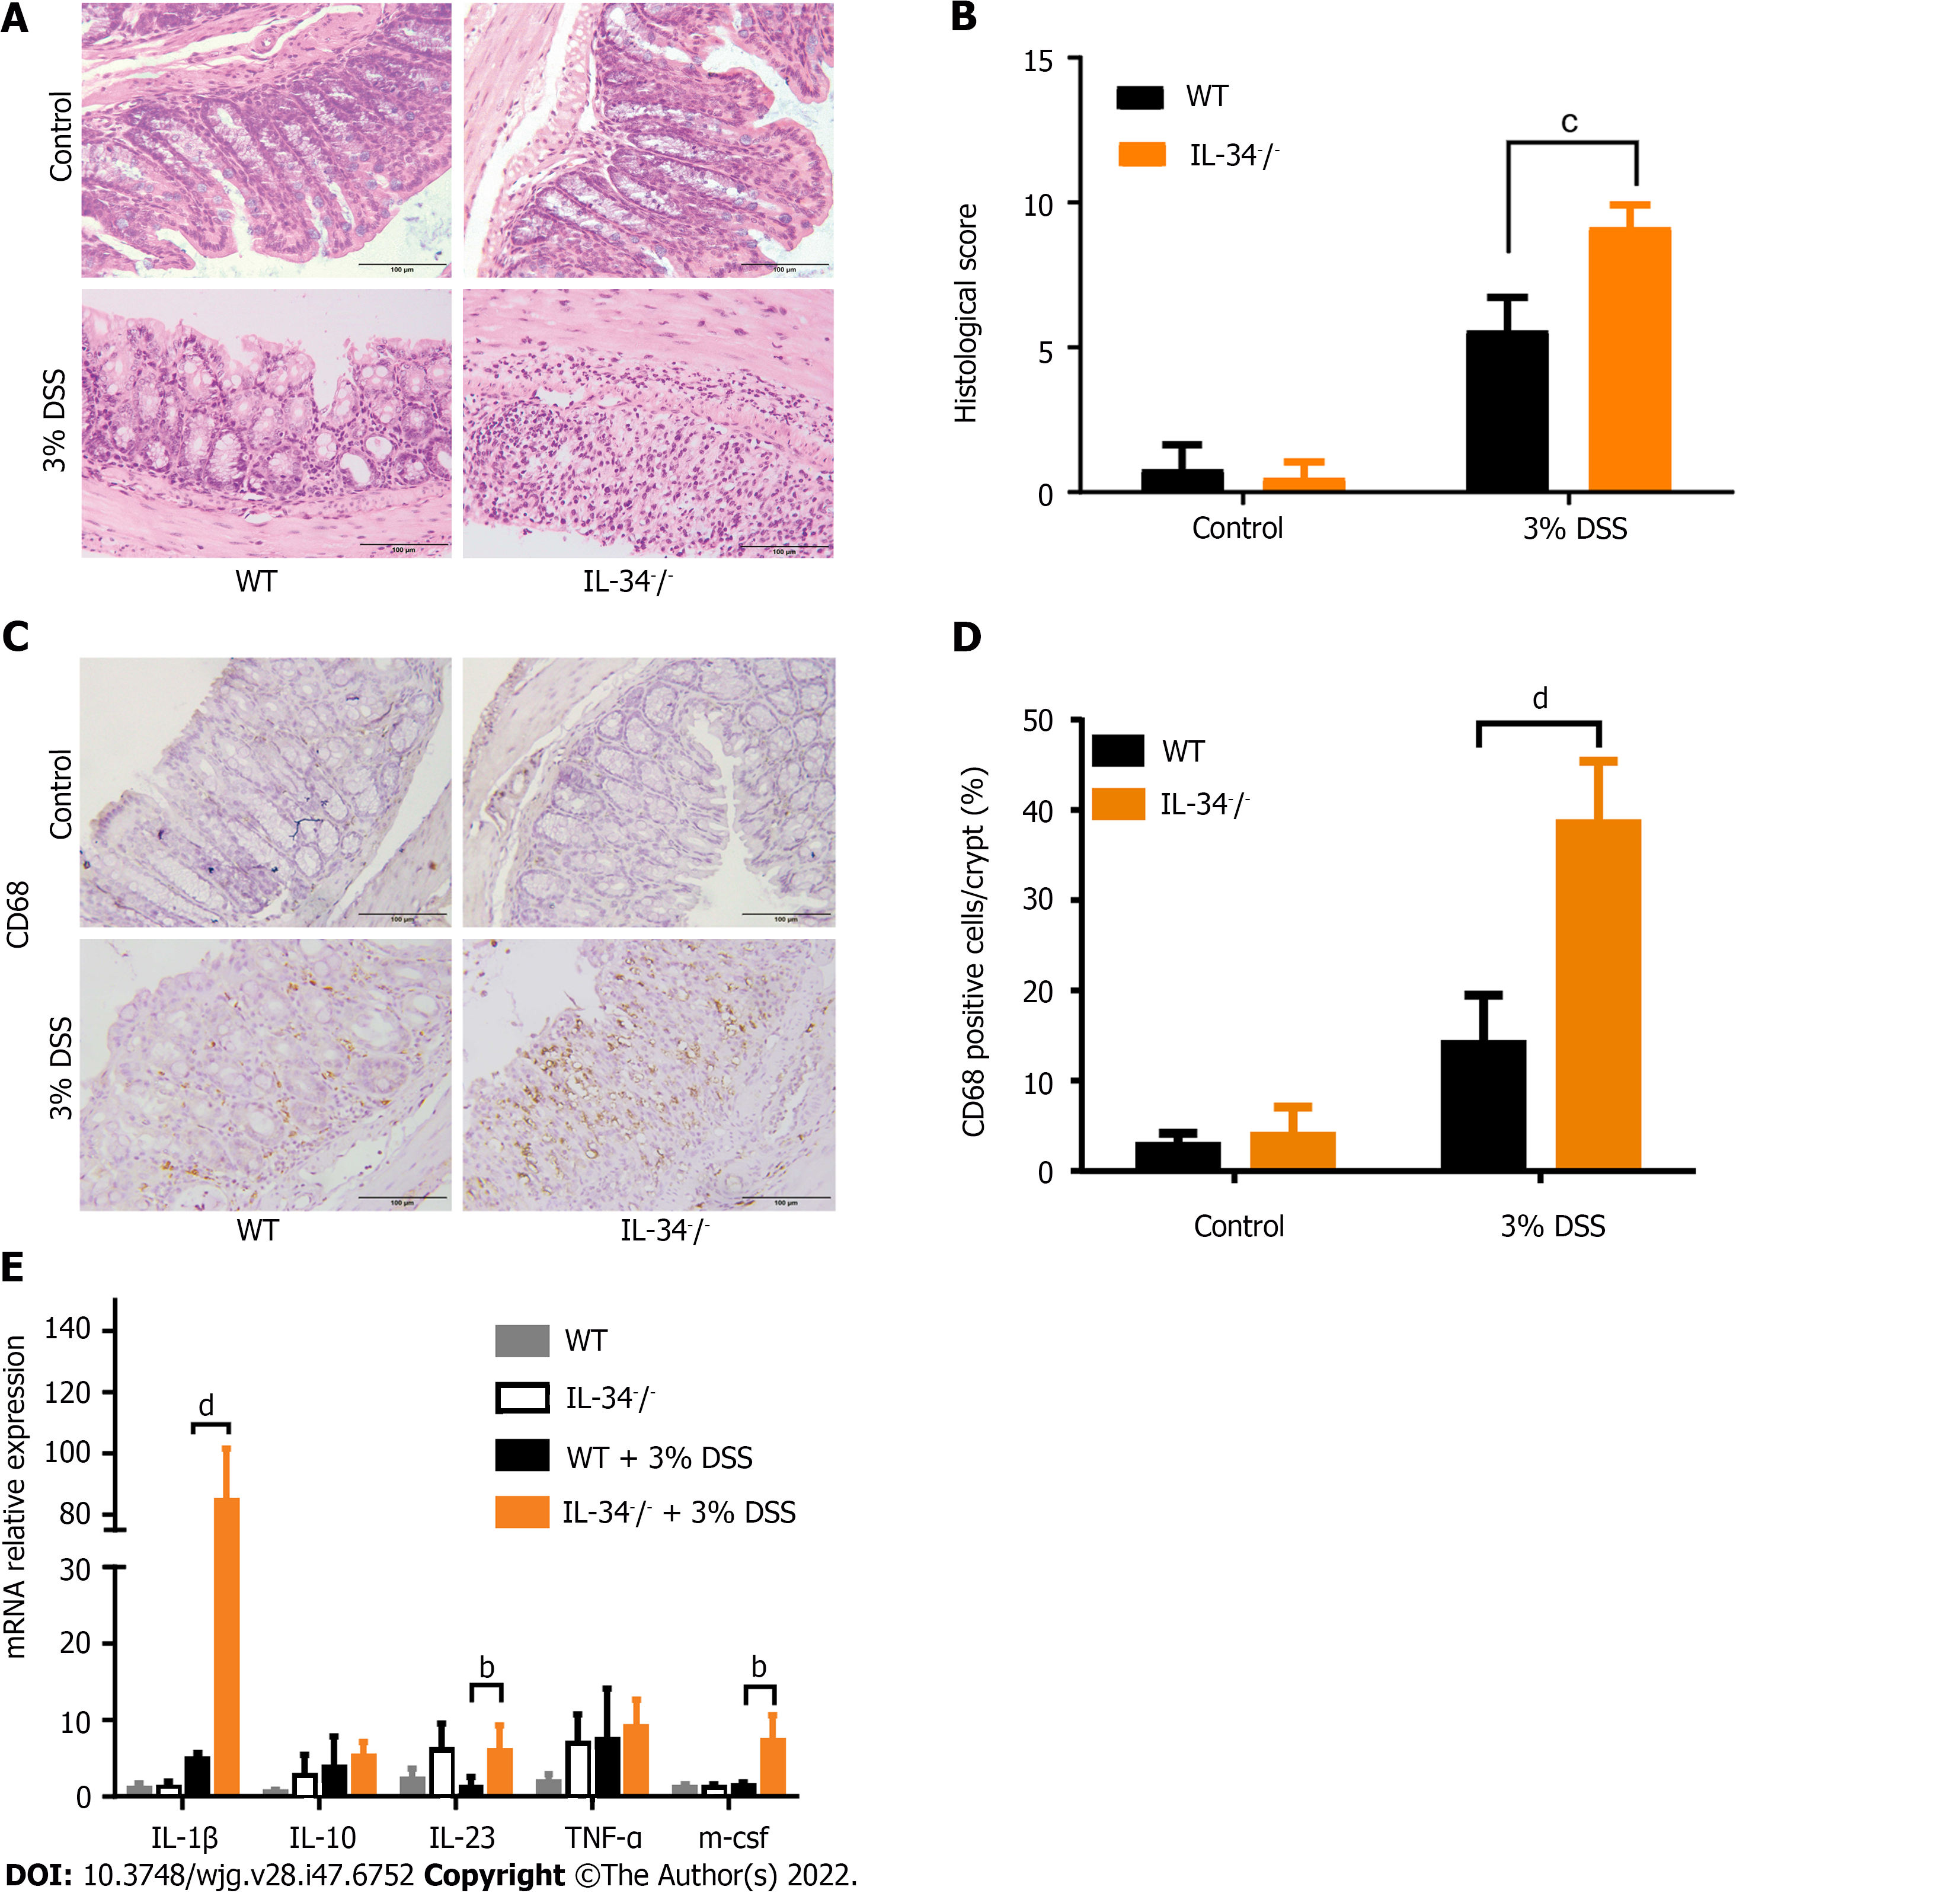
Figure 3 Interleukin-34 deficiency aggravates acute colitis and increase proinflammatory cytokines.
A: Representative microscopic pictures of hematoxylin and eosin-stained colon sections of Interleukin-34 (IL-34)-/- and WT mice fed with 3% DSS for 7 d (n = 6 or 7 per group); B: Histological score for IL-34-/- and WT mice fed with 3% dextran sodium sulfate (DSS); C: Representative photomicrographs of macrophage staining in colon sections of IL-34-/- and WT mice treated with DSS; D: Statistical analysis of CD68-positive cells in IL-34-/- and WT mice treated with DSS; E: mRNA expression of proinflammatory cytokines including IL-1β, IL-10, IL-23, TNF-α, and M-CSF in IL-34-/- and WT mice fed with 3% DSS. DSS: Dextran sodium sulfate; IL: Interleukin; M-CSF: Macrophage colony-stimulating factor; TNF-α: Tumor necrosis factor-α; WT: Wild-type. Scale bars = 100 μm. Data depict the mean ± SD. bP < 0.01, cP < 0.005, dP < 0.001.
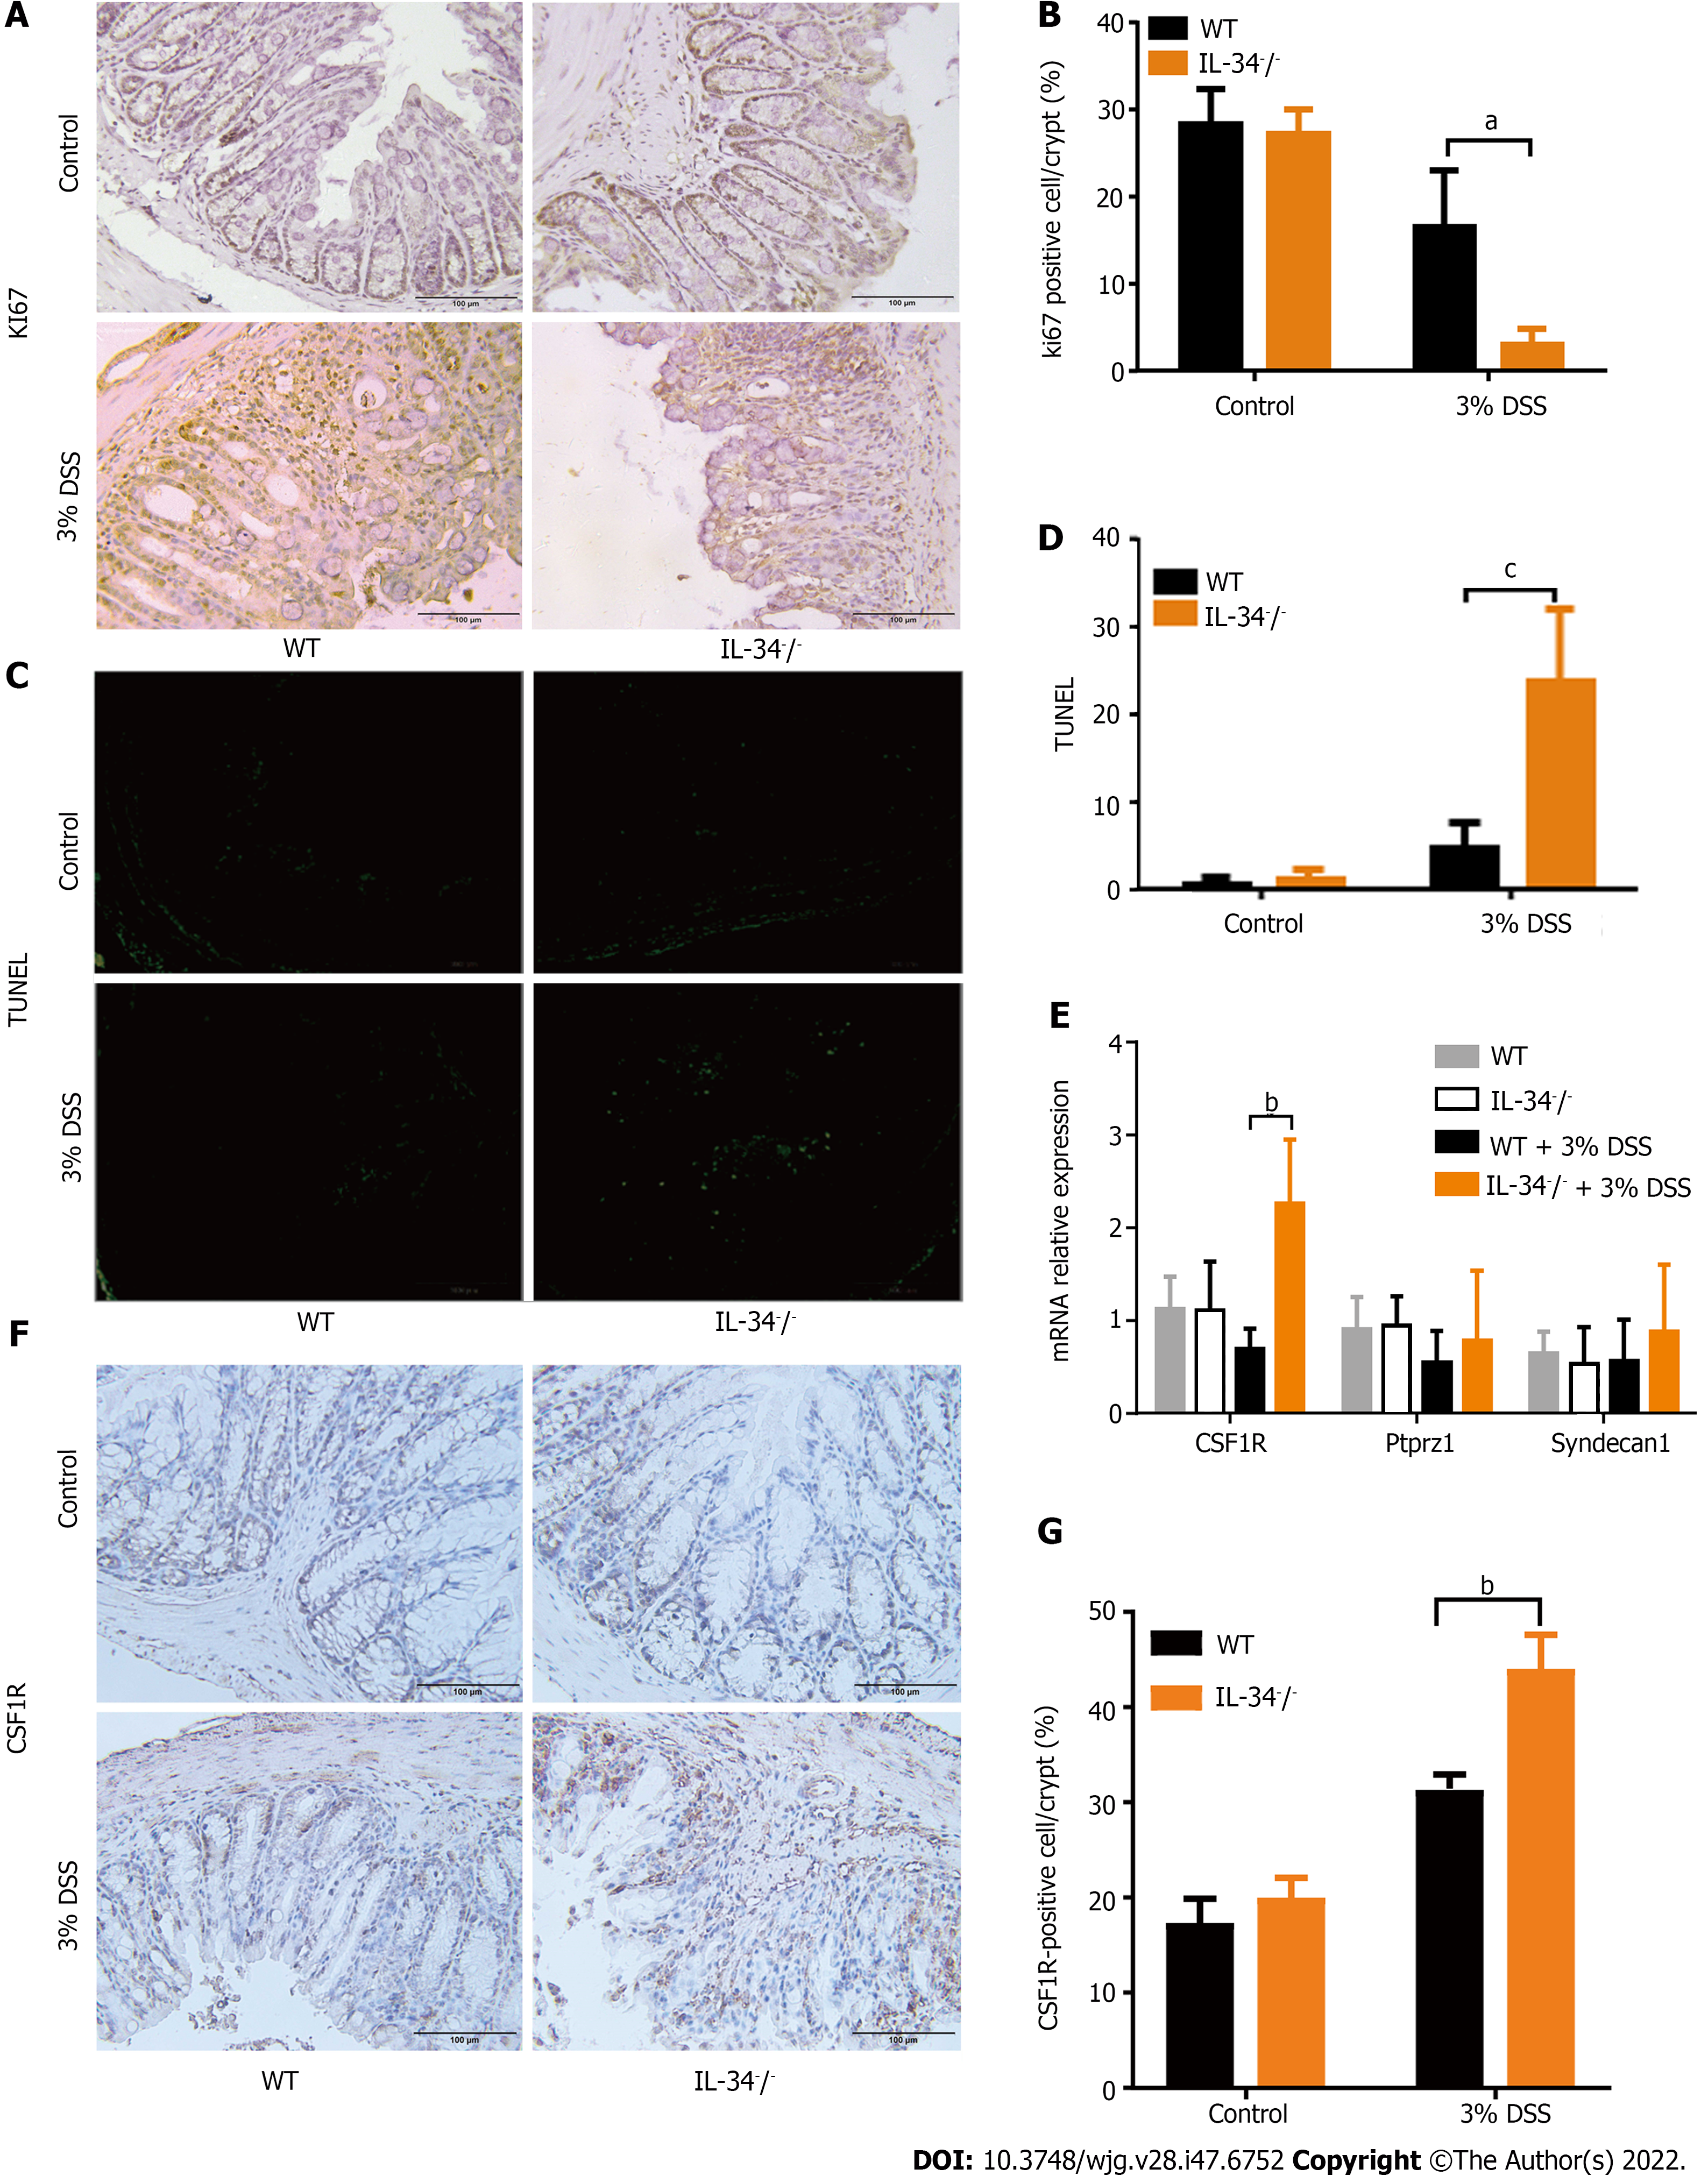
Figure 4 Interleukin-34 deficiency inhibits proliferation and promotes apoptosis of colonic epithelium in dextran sodium sulfate-induced colitis.
A: Representative photomicrographs of Ki-67 immunohistochemical staining for colon sections of IL-34-/- and WT mice treated with dextran sodium sulfate (DSS); B: Percentage of proliferation marker Ki-67 per crypt; C and D: Representative microscopic pictures of TUNEL staining (C) and quantification of TUNEL-positive cells per field (D) in IL-34-/- and WT mice treated with DSS as before; E: mRNA expression of three receptors for IL-34 (CSF1R, ptprz1 and syndecan-1) was detected in IL-34-/- and WT mice treated with DSS (n = 6 or 7 per group); F and G: Representative photomicrographs of CSF1R immunohistochemical staining (F) and percentage of CSF1R-positive cells (G) in colon sections of IL-34-/- and WT mice treated with 3% DSS. CSF1R: Colony-stimulating factor-1 receptor; DSS: Dextran sodium sulfate; IL-34: Interleukin-34; WT: Wild-type. Scale bars = 100 μm. Data depict mean ± SD. aP < 0.05, bP < 0.01, cP < 0.005.
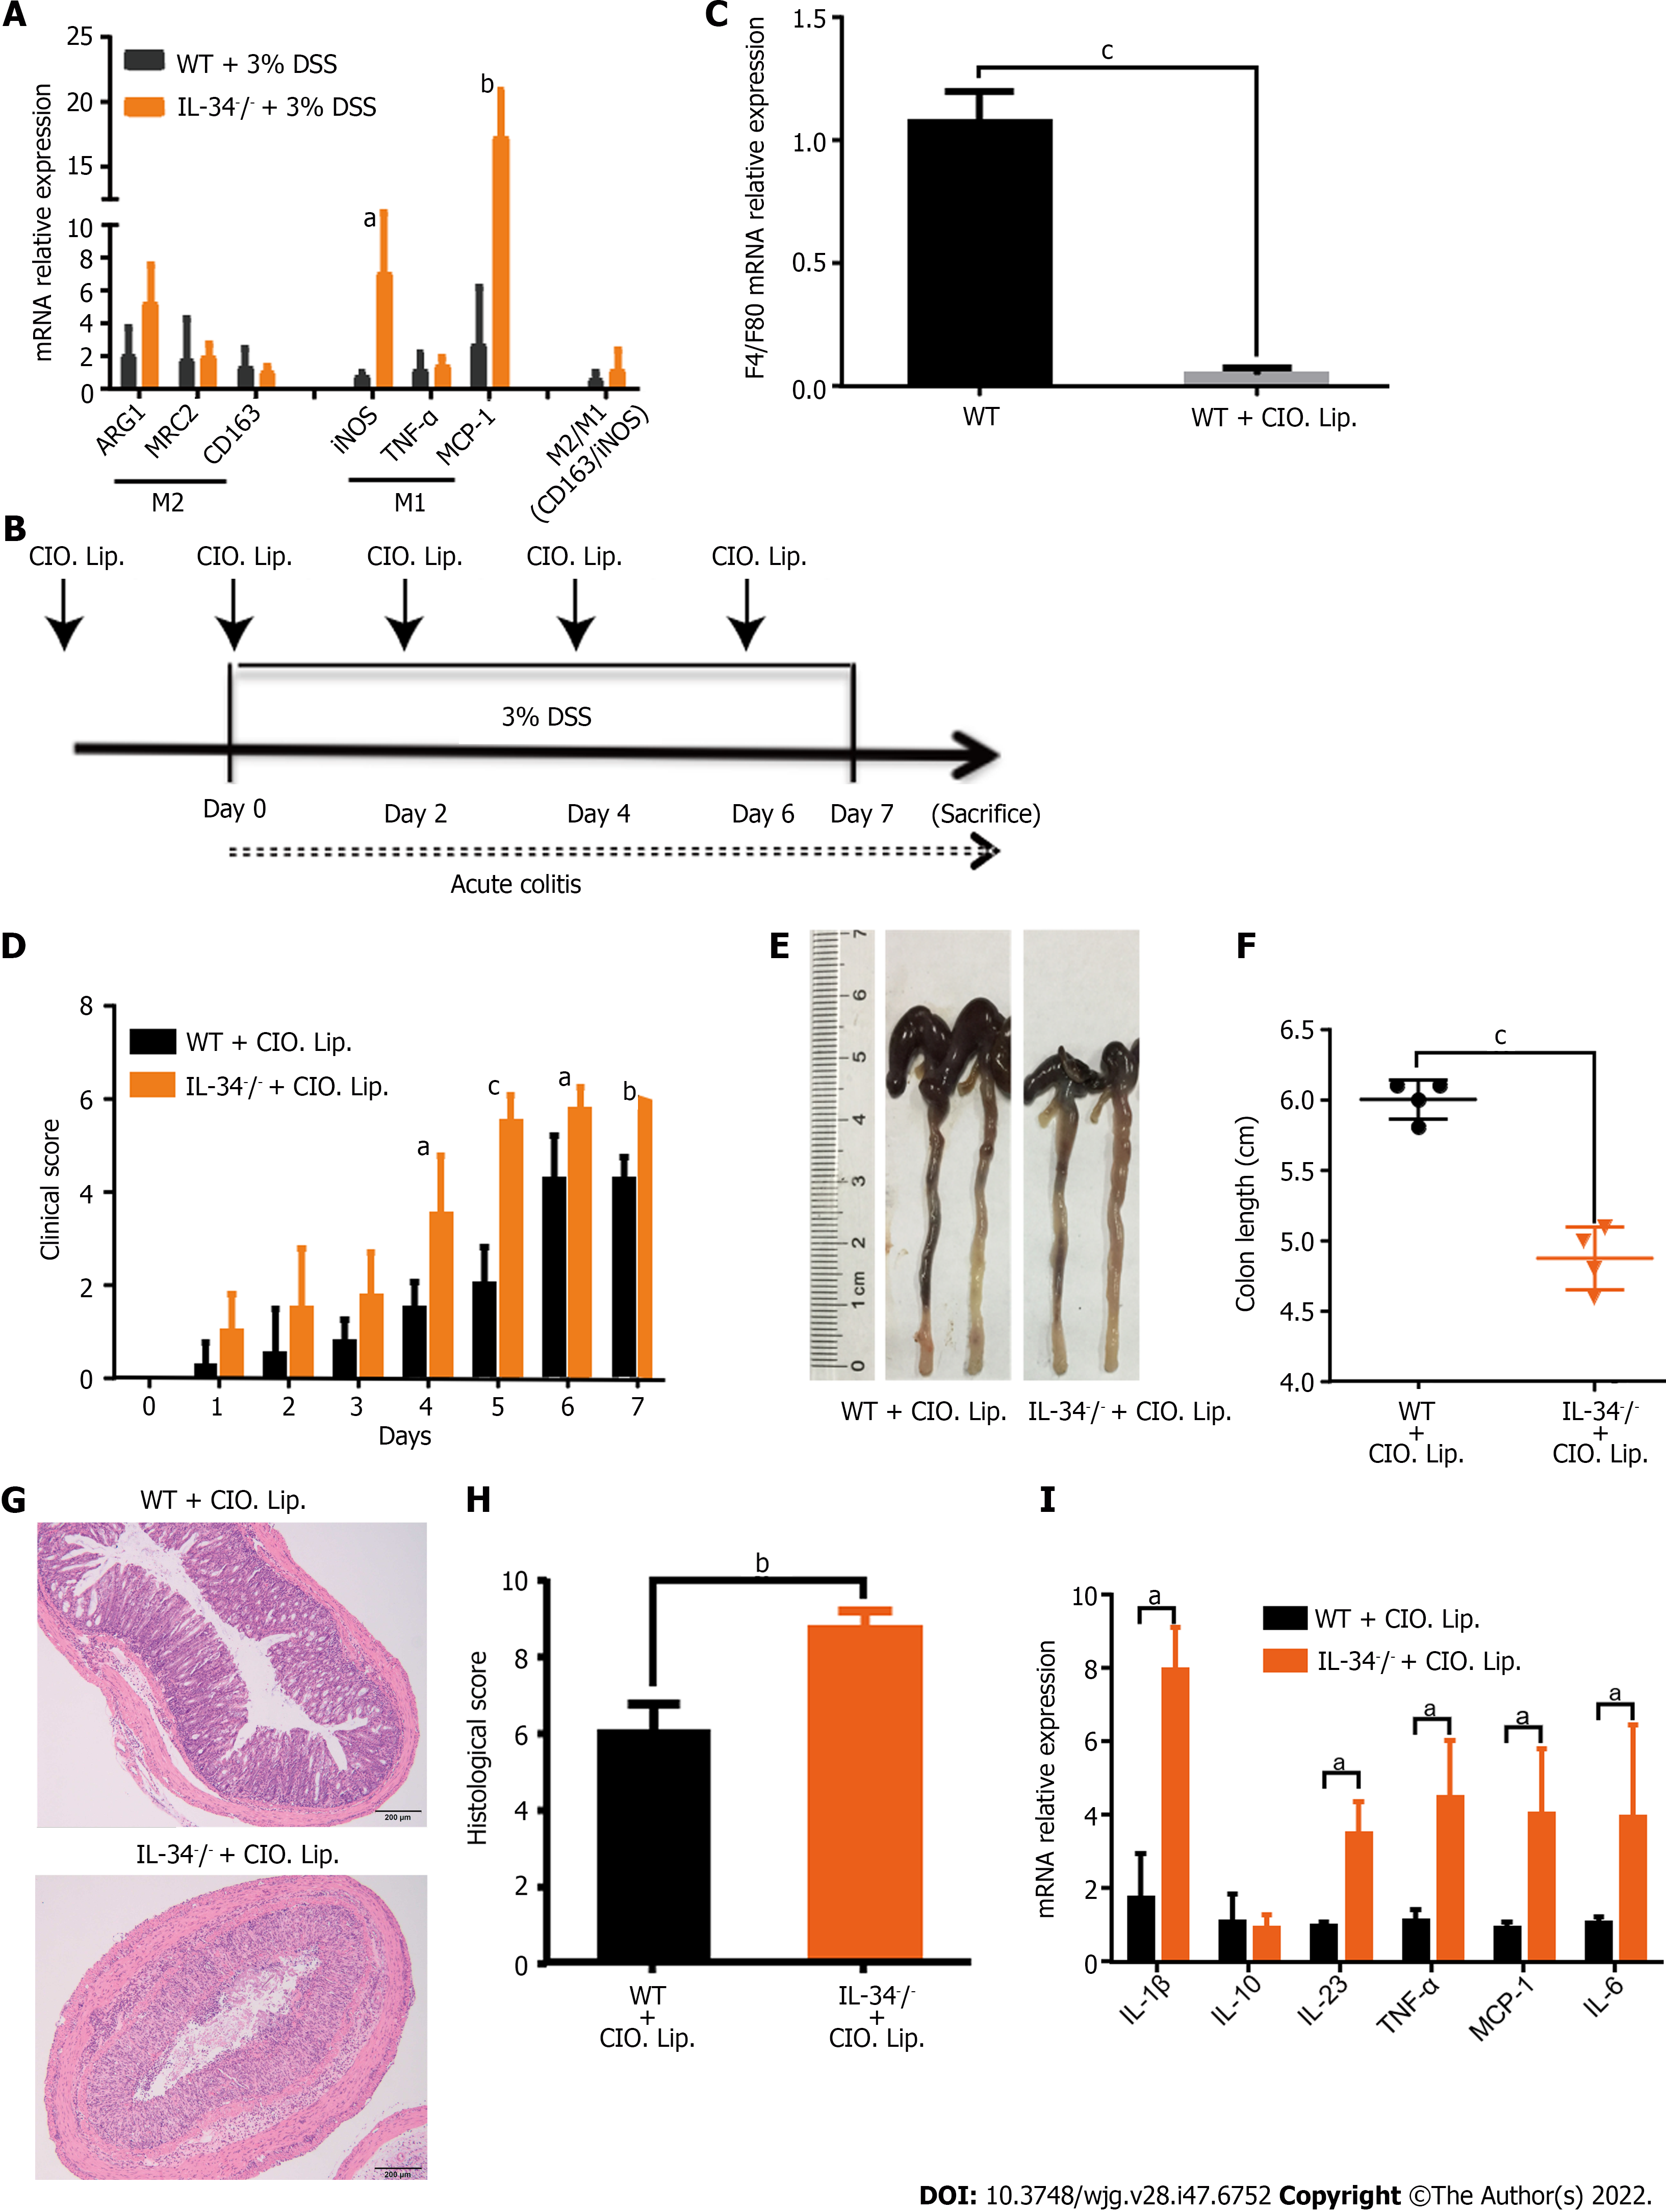
Figure 5 Protective effect of interleukin-34 against acute dextran-sodium-sulfate-induced colitis is not dependent on macrophages.
A: mRNA expression levels of M1 macrophage markers (iNOS, TNF-α and MCP-1) and M2 macrophage markers [ARG1, MRC2 (CD163)] in the colonic mucosa of IL-34-/- and WT mice treated with 3% DSS. M2/M1 ratio (CD163/iNOS) was calculated; B: Experimental design. To deplete macrophages, IL-34-/- and WT mice were treated with Clo-lips 2 d prior to 3% dextran sodium sulfate (DSS) administration and continuing once every 2 d until death (n = 4 per group); C: mRNA expression of macrophage cell marker (F4/80) was detected in colonic mucosa of WT mice treated with Clo-lips (n = 4 per group); D: Clinical score of IL-34-/- and WT mice treated with 3% DSS and Clo-lips (n = 4 per group); E and F: Colon length of IL-34-/- and WT mice treated with 3% DSS and Clo-lips (n = 4 per group); G and H: Representative microscopic pictures (G) and histological scores (H) of IL-34-/- and WT mice fed with 3% DSS and Clo-lips (n = 4 per group); I: mRNA expression of inflammatory cytokines was detected in IL-34-/- and WT mice treated with 3% DSS and Clo-lips (n = 4 per group). ARG1: Arginase; Clo-lip: Clodronate liposome; CSF1R: Colony-stimulating factor-1 receptor; DSS: Dextran sodium sulfate; IL-34: Interleukin-34; iNOS: Inducible nitric oxide synthase; MCP-1: Monocyte chemoattractant protein-1; MRC2: Mannose receptor C type 2; TNF-α: Tumor necrosis factor-α; WT: Wild-type. Scale bars = 200 μm. Data depict mean ± SD. aP < 0.05, bP < 0.01, cP < 0.005.
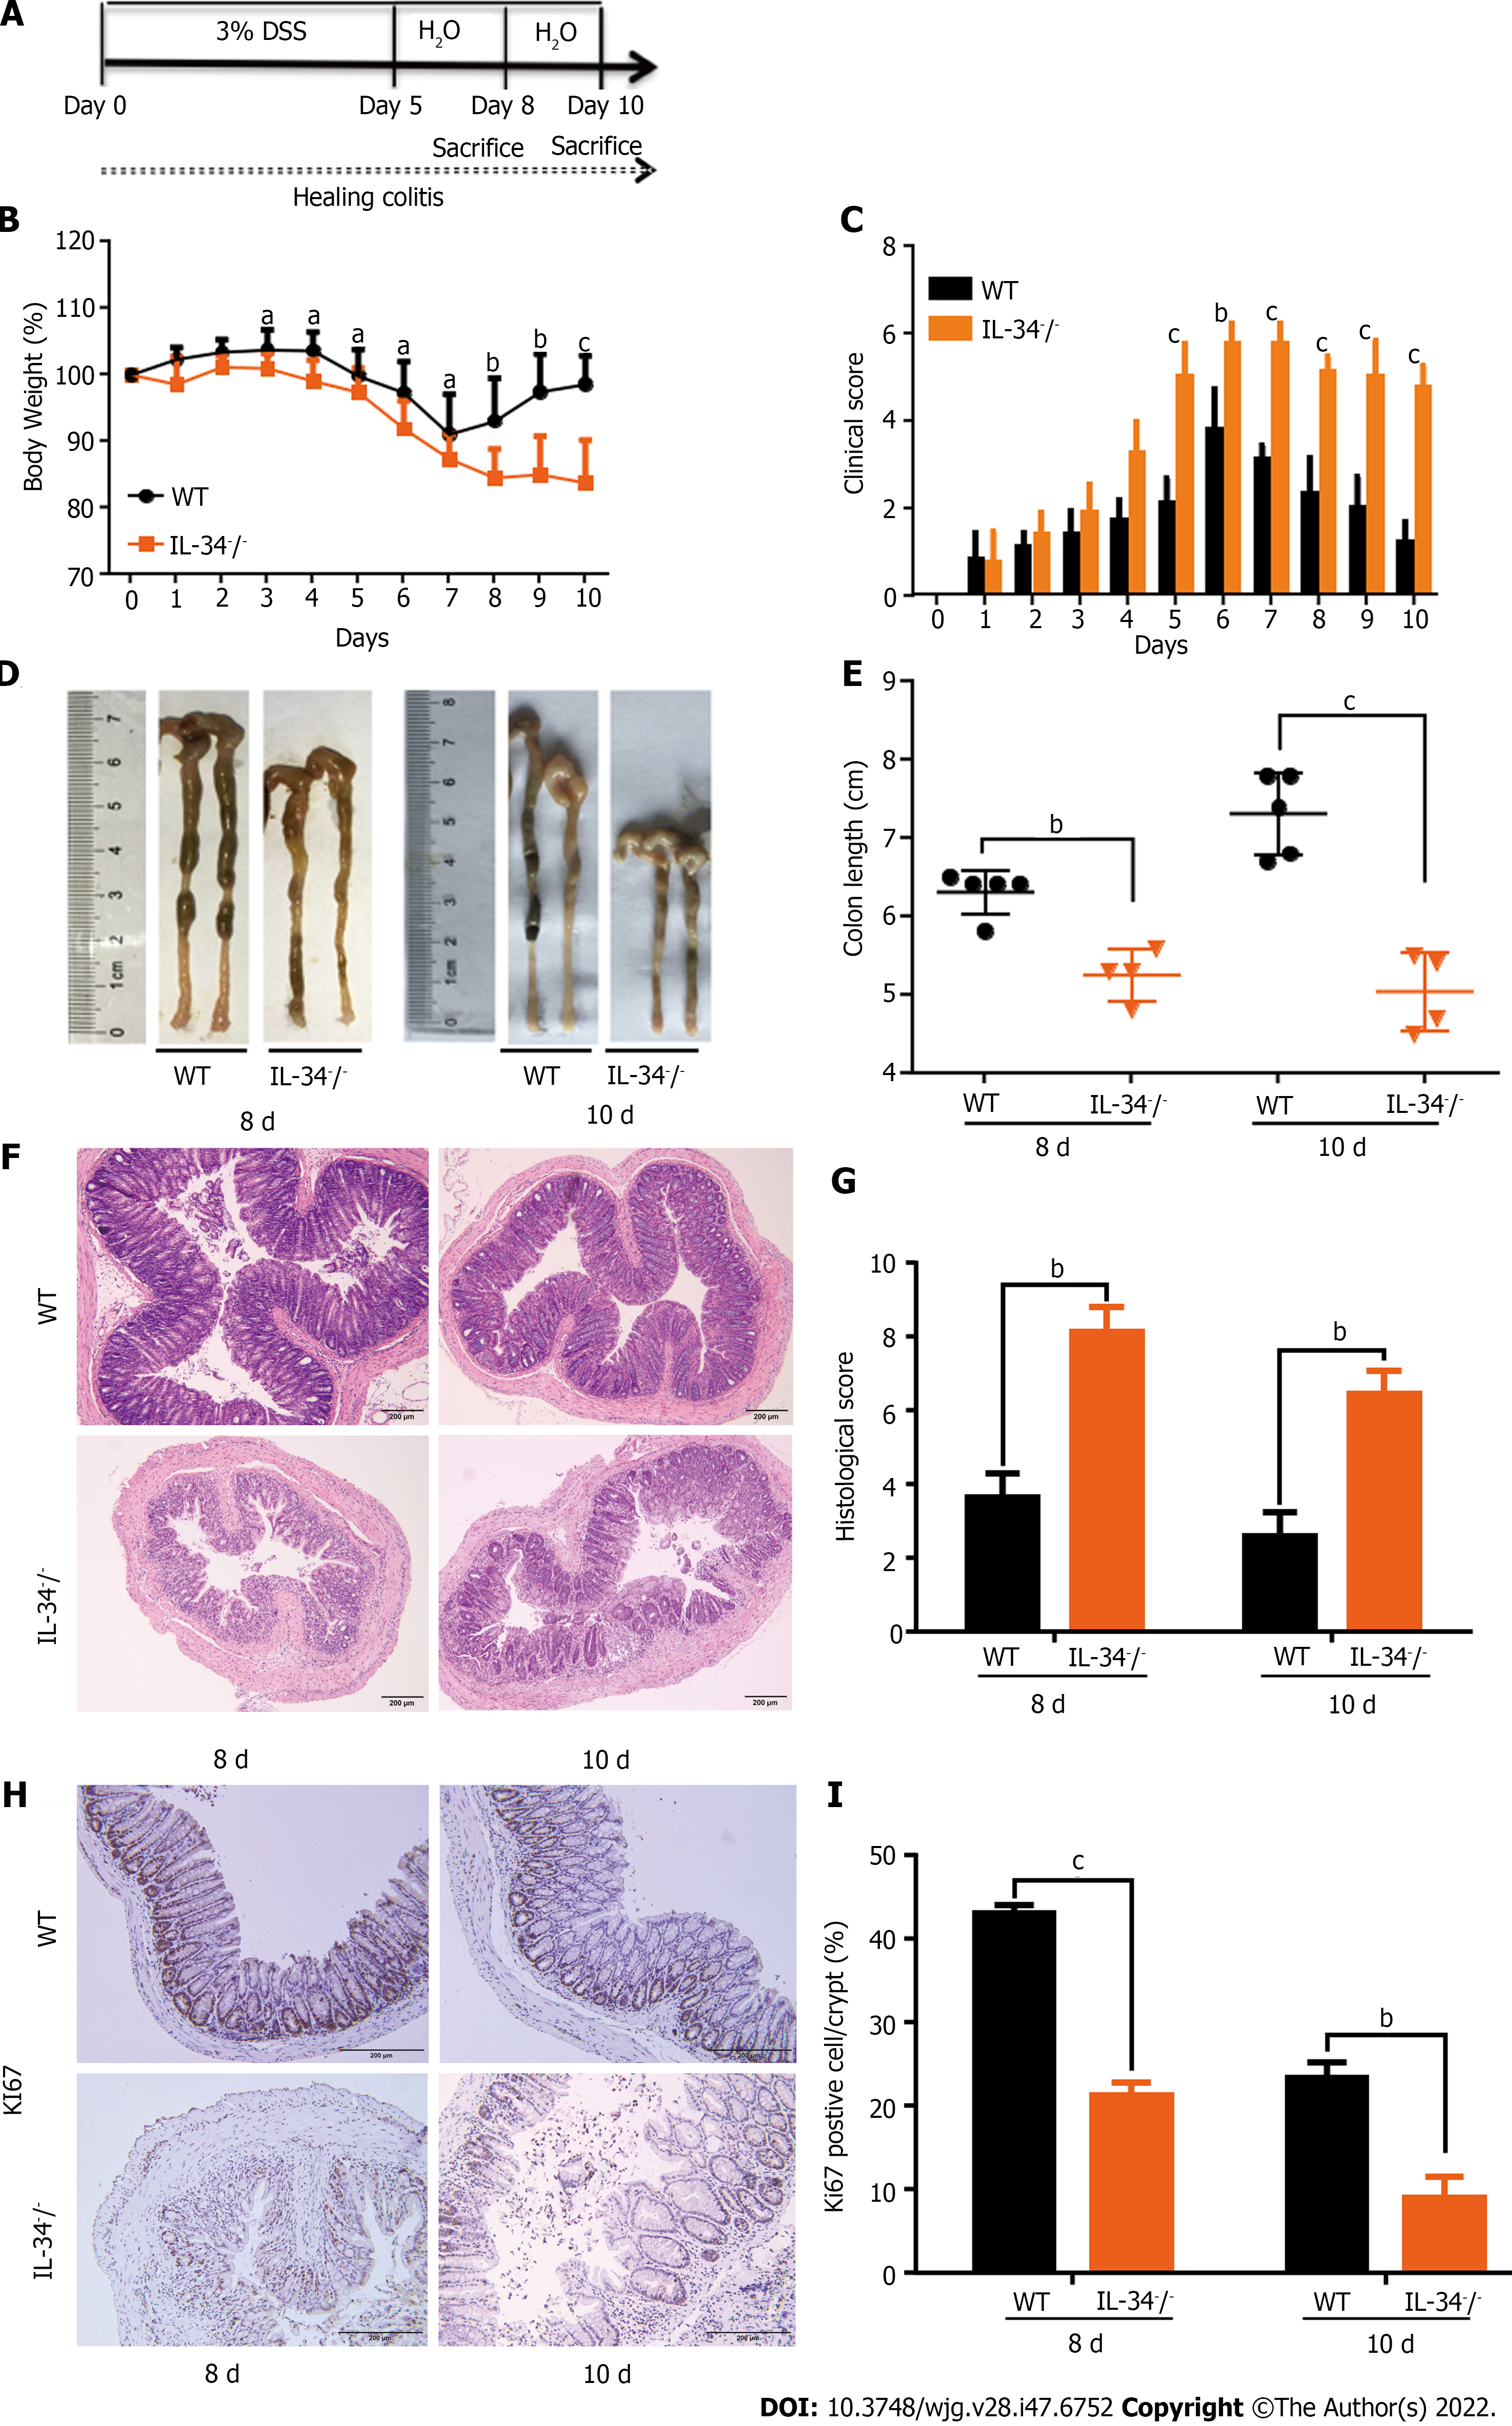
Figure 6 Interleukin-34 deficiency delays the mucosal healing in murine model induced by dextran sodium sulfate.
A: Establishing healing model chart. The Interleukin-34 (IL-34)-/- and WT mice were fed with 3% dextran sodium sulfate (DSS) for 5 d and switched to normal drinking water for the following 5 d. The mice in both groups were killed on day 8 or 10 (n = 4 or 5 per group); B and C: Body weight (B) and clinical score (C) were determined daily in IL-34-/- and WT mice until day 10 (n = 4 or 5 per group); D and E: The colon length was measured in IL-34-/- and WT mice on day 8 and 10, respectively (n = 4 or 5 per group); F and G: Representative microscopic pictures (F) and semiquantitative histological scores (G) of IL-34-/- and WT mice on day 8 and 10, respectively (n = 4 or 5 per group); H and I: Representative photomicrographs of Ki-67 immunohistochemical staining (H) and percentage of Ki-67-positive per crypt (I) in IL-34-/- and WT mice on day 8 and 10, respectively. DSS: Dextran sodium sulfate; IL-34: Interleukin-34; WT: Wild type. Scale bars = 200 μm. Data depict the mean ± SD. aP < 0.05, bP < 0.01, cP < 0.005.
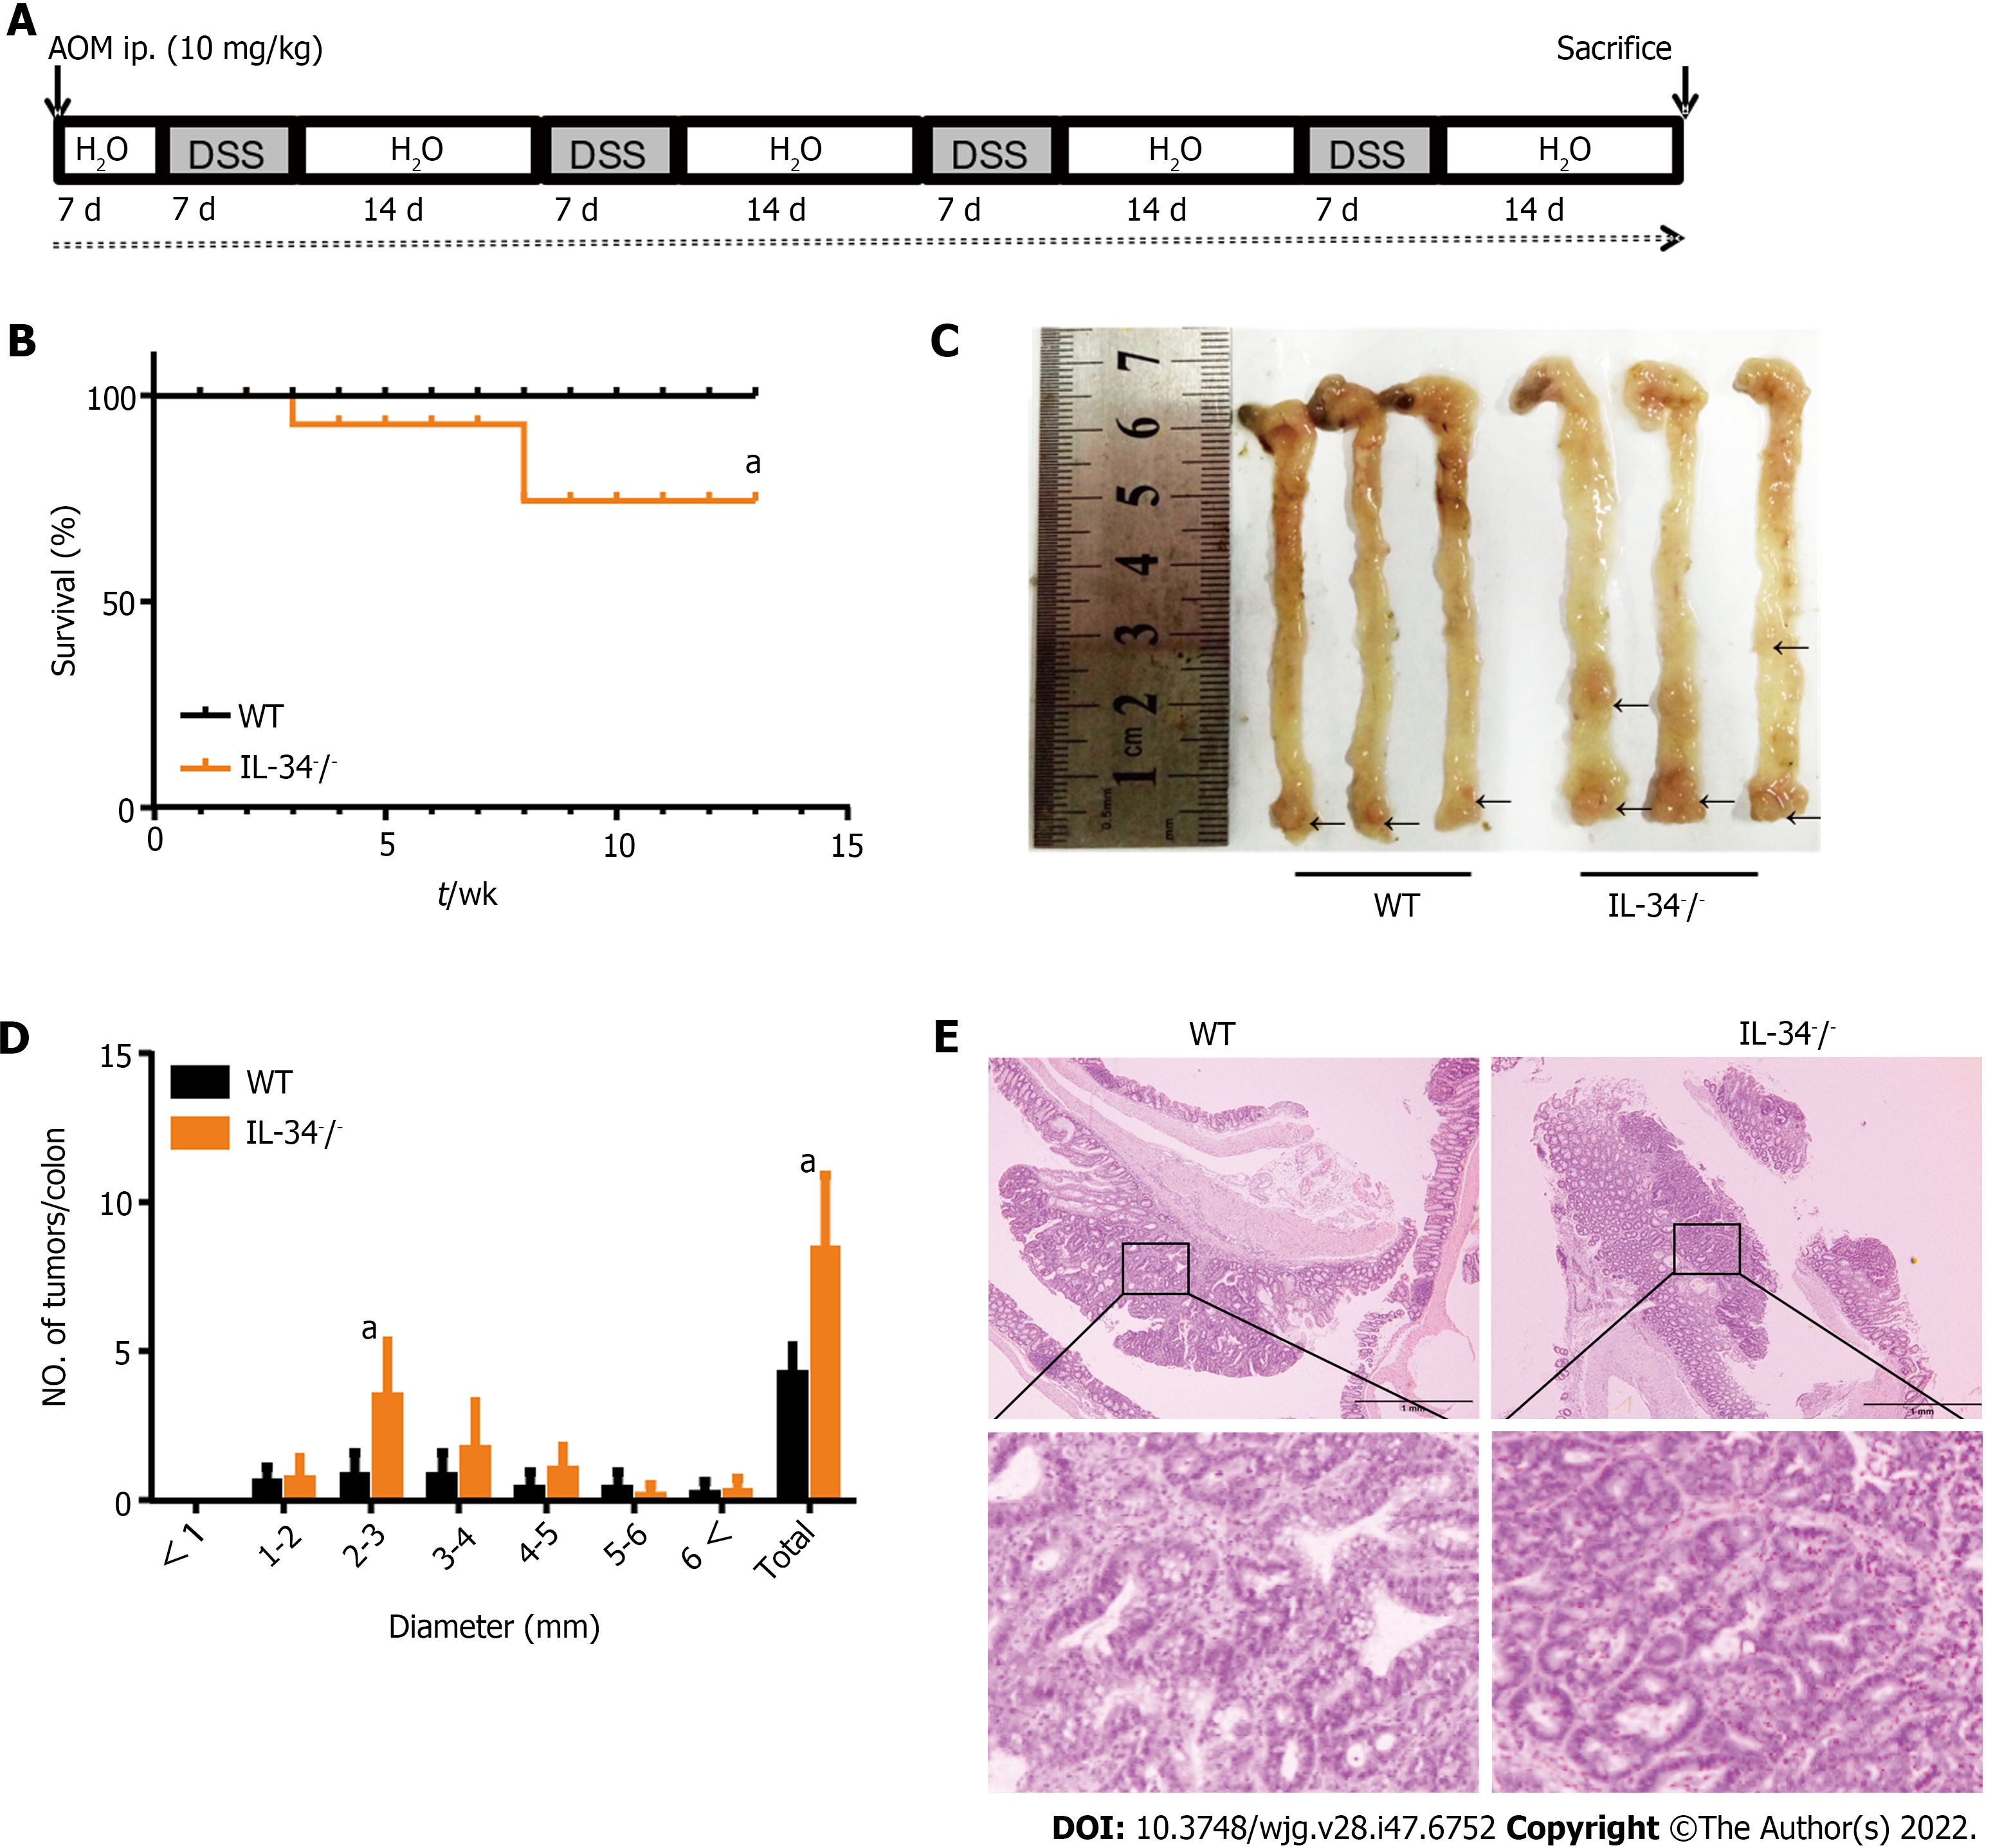
Figure 7 Interleukin-34 deficiency promotes azoxymethane /dextran-sodium-sulfate-induced colitis-associated tumorigenesis.
A: Experimental design was shown as diagram. WT and Interleukin-34 (IL-34)-/- mice were given a single injection of azoxymethane (AOM, 10 mg/kg). Seven days later, mice were treated with 1.25% dextran sodium sulfate (DSS) (w/v) in drinking water for seven consecutive days, and given fresh drinking water for 14 d. Seven days of DSS and 14 d of fresh water as a cycle, repeated four times; B: Kaplan-Meier survival curves were plotted in IL-34-/- and WT mice treated with AOM/DSS (n = 10 per group); C and D: Representative photo of colon (C) and tumor number in colon (D) in IL-34-/- and WT mice treated with AOM/DSS (n = 10 per group); E: Representative hematoxylin and eosin-stained colon sections in IL-34-/- and WT mice treated with AOM/DSS (n = 10 per group). AOM: Azoxymethane; DSS: Dextran sodium sulfate; WT: Wild type. Bars: 1 mm (top) and 100 μm (bottom). Data depict mean ± SD. aP < 0.05.
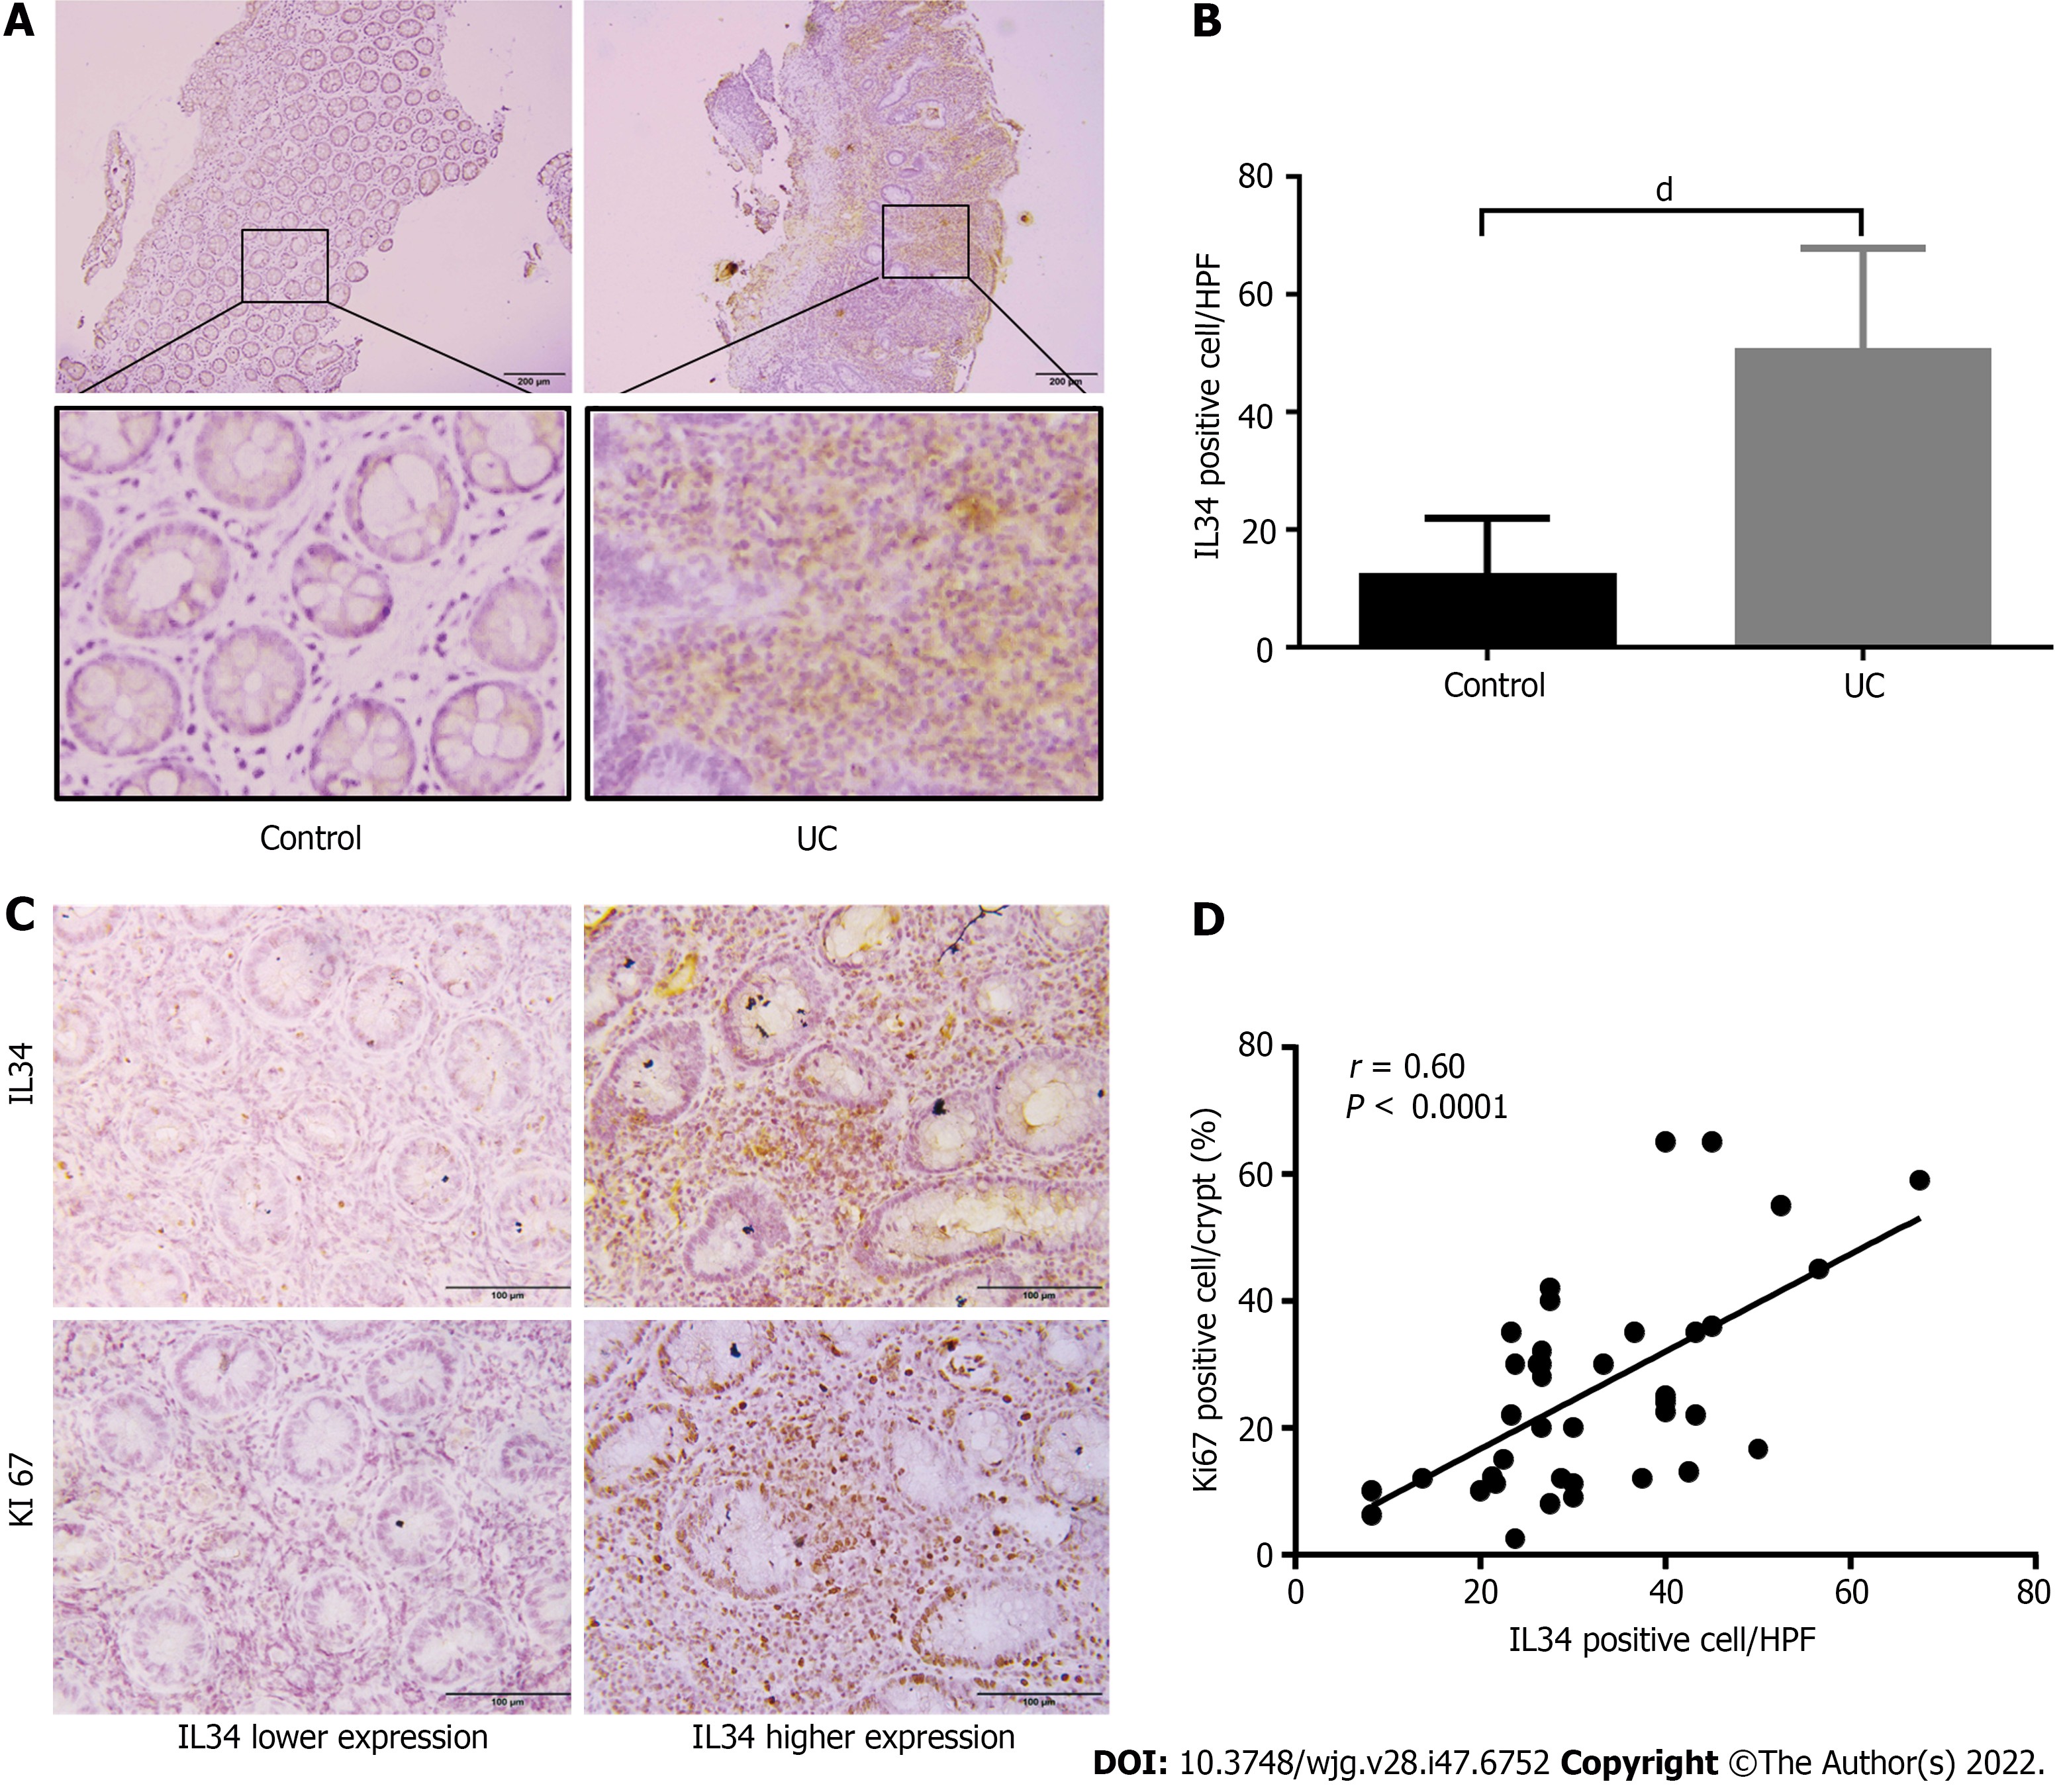
Figure 8 Interleukin-34 expression was elevated in inflamed mucosa and associated with colonic epithelium proliferation in active ulcerative colitis.
A: Representative microscopic pictures of interleukin-34 (IL-34) immunohistochemical staining in colonic biopsies of healthy controls or individuals with active ulcerative colitis (UC); B: Percentage of IL-34-positive cells per high-power field were quantified in colonic biopsies of healthy controls (n = 20) and active UC patients (n = 40); C: Representative photomicrographs of immunostaining of Ki67 in colonic biopsies of active UC patients in IL-34 Lower expression and higher expression groups; D: Correlation analysis of colonic IL-34 expression and Ki 67-positive cells in active UC patients. IL-34: Interleukin-34; UC: Ulcerative colitis. Scale bar indicates 100 μm or 200 μm. dP < 0.001.
- Citation: Liu ZX, Chen WJ, Wang Y, Chen BQ, Liu YC, Cheng TC, Luo LL, Chen L, Ju LL, Liu Y, Li M, Feng N, Shao JG, Bian ZL. Interleukin-34 deficiency aggravates development of colitis and colitis-associated cancer in mice. World J Gastroenterol 2022; 28(47): 6752-6768
- URL: https://www.wjgnet.com/1007-9327/full/v28/i47/6752.htm
- DOI: https://dx.doi.org/10.3748/wjg.v28.i47.6752


