Copyright
©The Author(s) 2022.
World J Gastroenterol. Dec 14, 2022; 28(46): 6573-6588
Published online Dec 14, 2022. doi: 10.3748/wjg.v28.i46.6573
Published online Dec 14, 2022. doi: 10.3748/wjg.v28.i46.6573
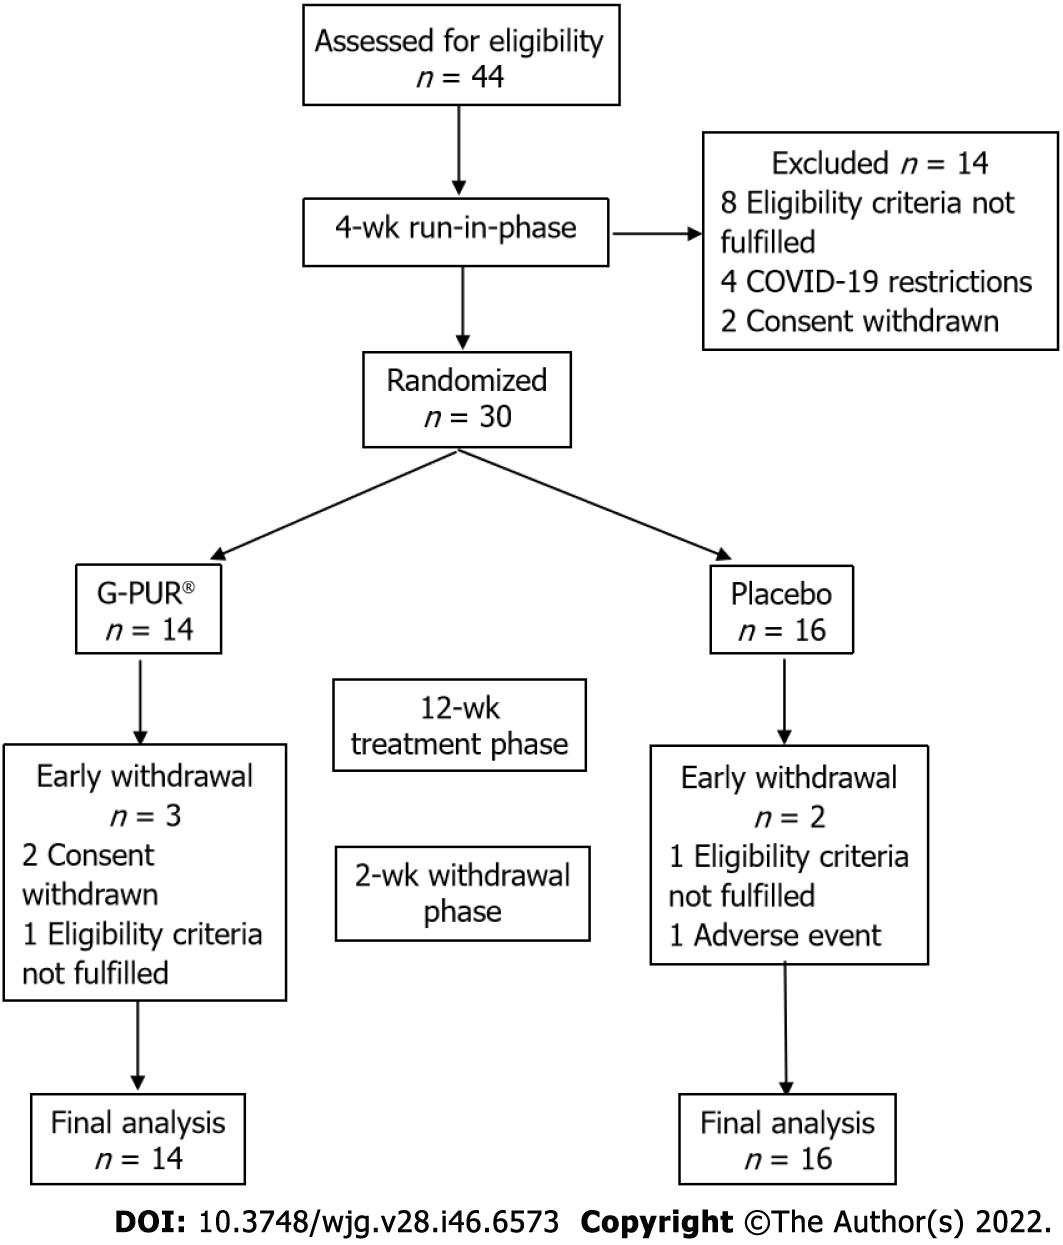
Figure 1 Patient flow diagram.
COVID-19: Coronavirus disease 2019.
Figure 2 Subject’s Global Assessment of Relief.
The proportion of patients (%) reporting ‘completely relieved’ or ‘considerably relieved’ by time point during the 12-wk treatment and 2-wk withdrawal period with G-PUR® (solid squares) or placebo (open circles). “n” represents the number of patients with available data at the respective time point, while patients with missing data were considered as non-responders in the intention-to-treat-analysis.
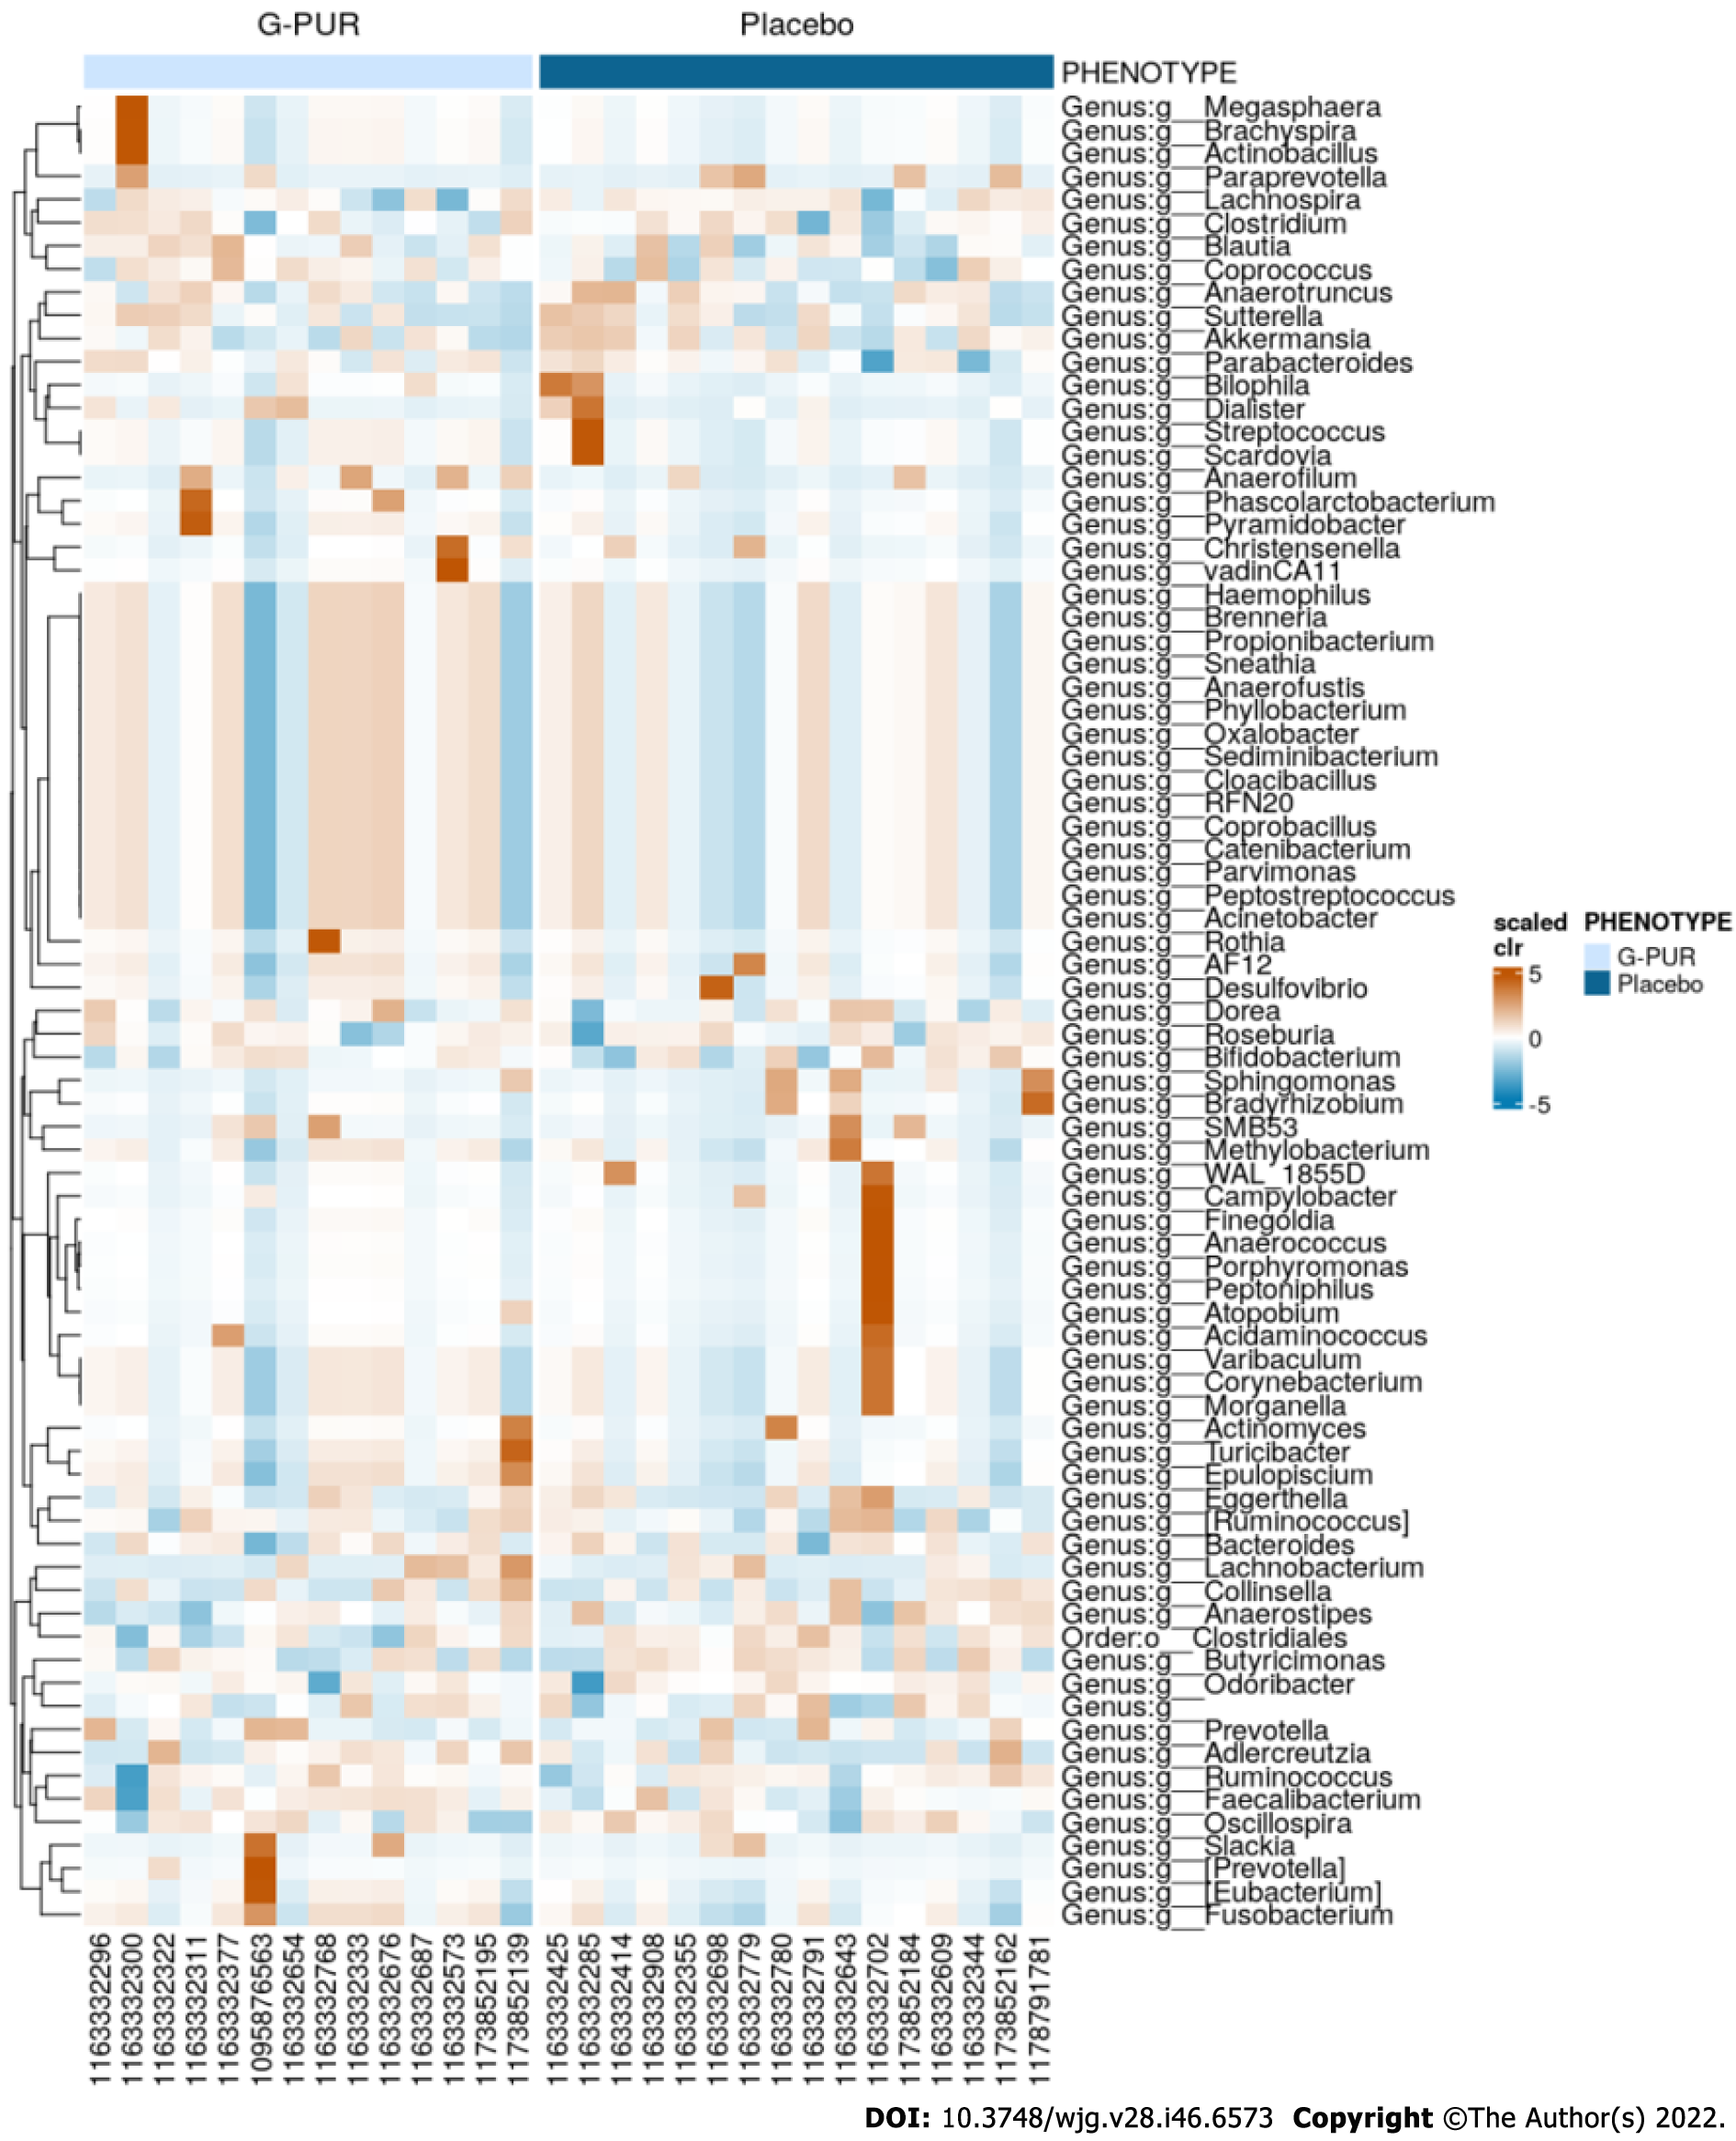
Figure 3 Microbiome heatmap.
Overall visualization of the change in the gut microbiome genera in comparison to baseline by treatment group. Microbiome studies in stool across multiple calculation methods showed an increase in diversity in the G-PUR® group but not in the placebo group.
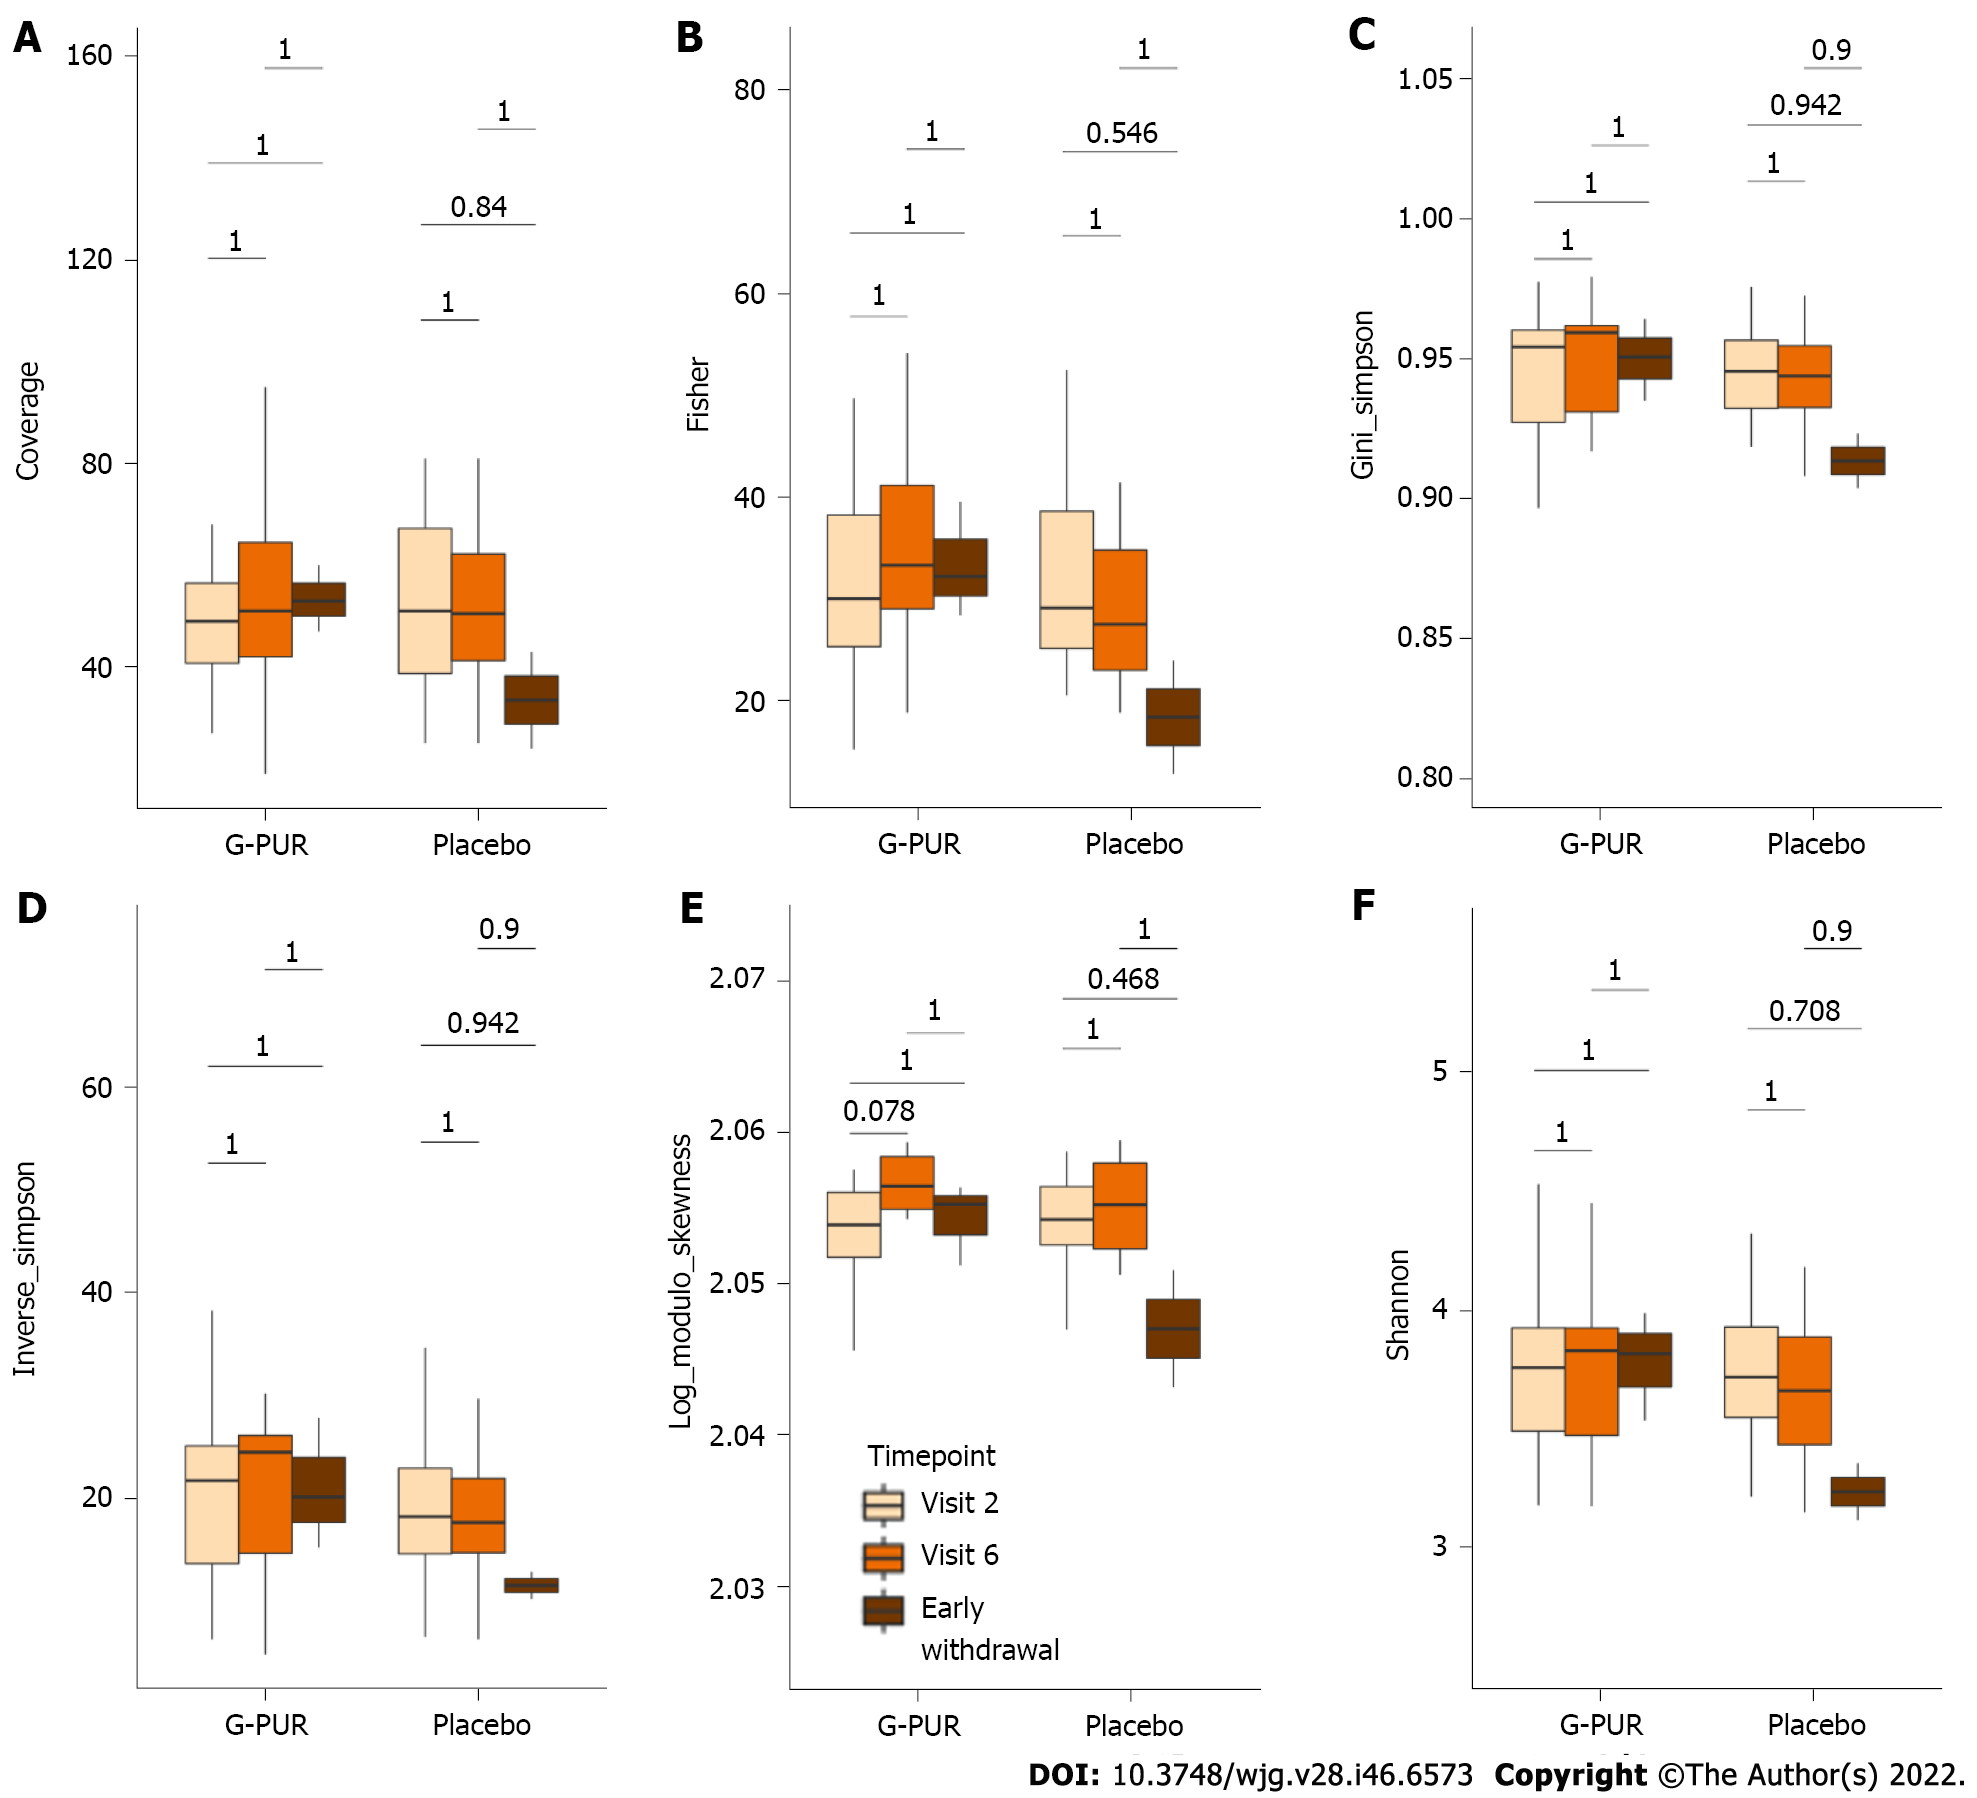
Figure 4 Alpha diversity indices in phenotypes between time point by treatment group.
A: Coverage; B: Fisher; C: Gini_simpson; D: Inverse_simpson; E: Log_modulo_skewness; F: Shannon.
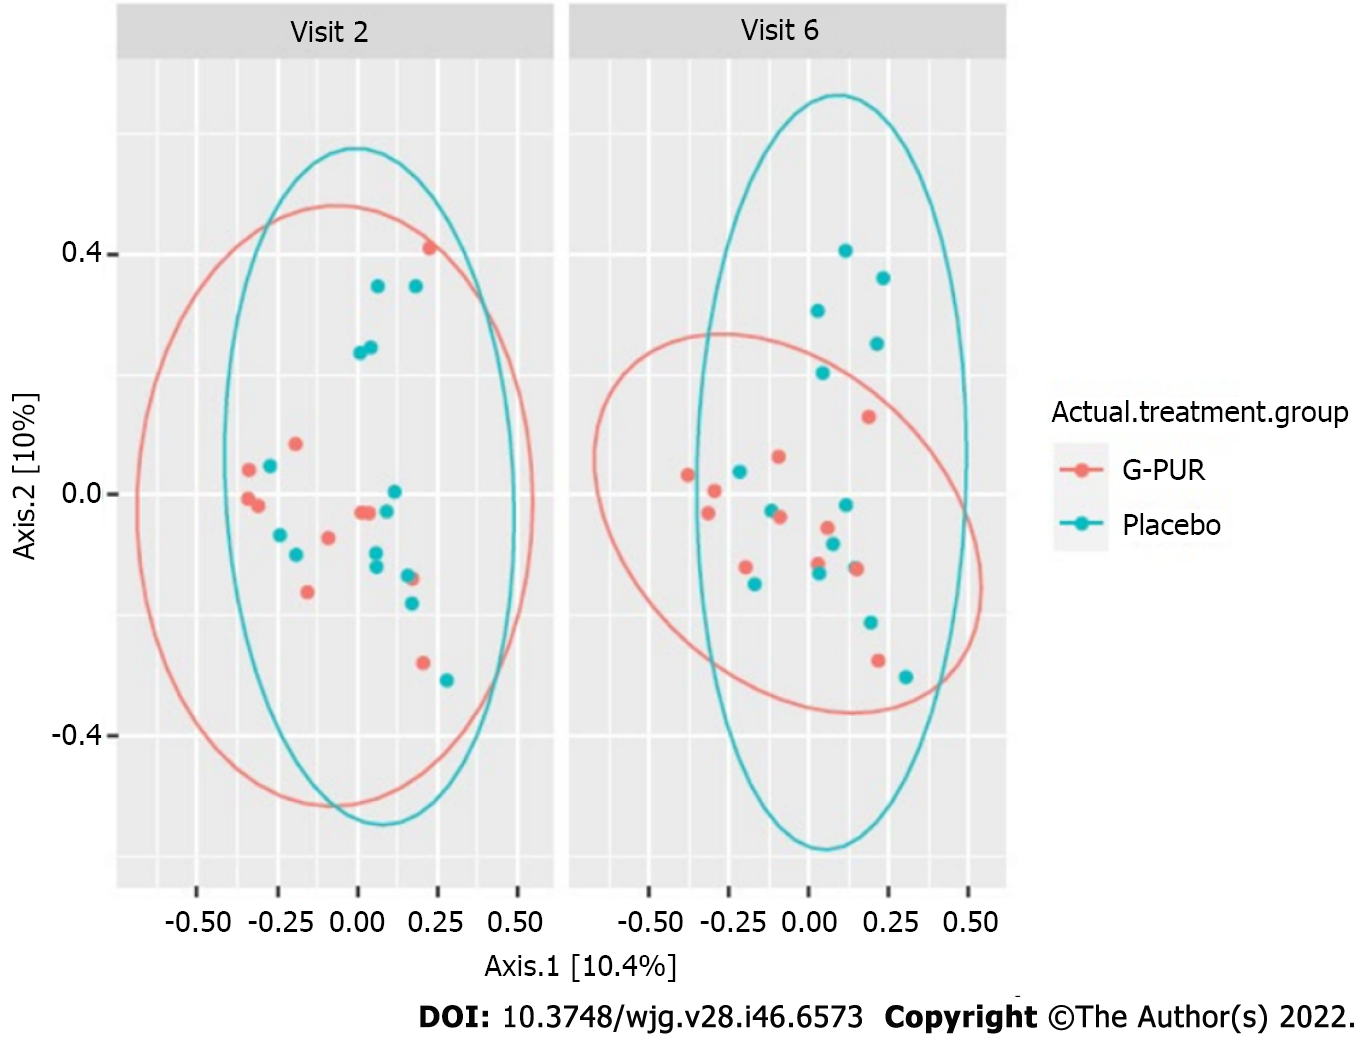
Figure 5 Beta diversity of the gut microbiome by treatment group and visit (longitudinal analysis, statistical methods LefSe and Maaslin).
- Citation: Anderle K, Wolzt M, Moser G, Keip B, Peter J, Meisslitzer C, Gouya G, Freissmuth M, Tschegg C. Safety and efficacy of purified clinoptilolite-tuff treatment in patients with irritable bowel syndrome with diarrhea: Randomized controlled trial. World J Gastroenterol 2022; 28(46): 6573-6588
- URL: https://www.wjgnet.com/1007-9327/full/v28/i46/6573.htm
- DOI: https://dx.doi.org/10.3748/wjg.v28.i46.6573


