Copyright
©The Author(s) 2022.
World J Gastroenterol. Dec 14, 2022; 28(46): 6551-6563
Published online Dec 14, 2022. doi: 10.3748/wjg.v28.i46.6551
Published online Dec 14, 2022. doi: 10.3748/wjg.v28.i46.6551
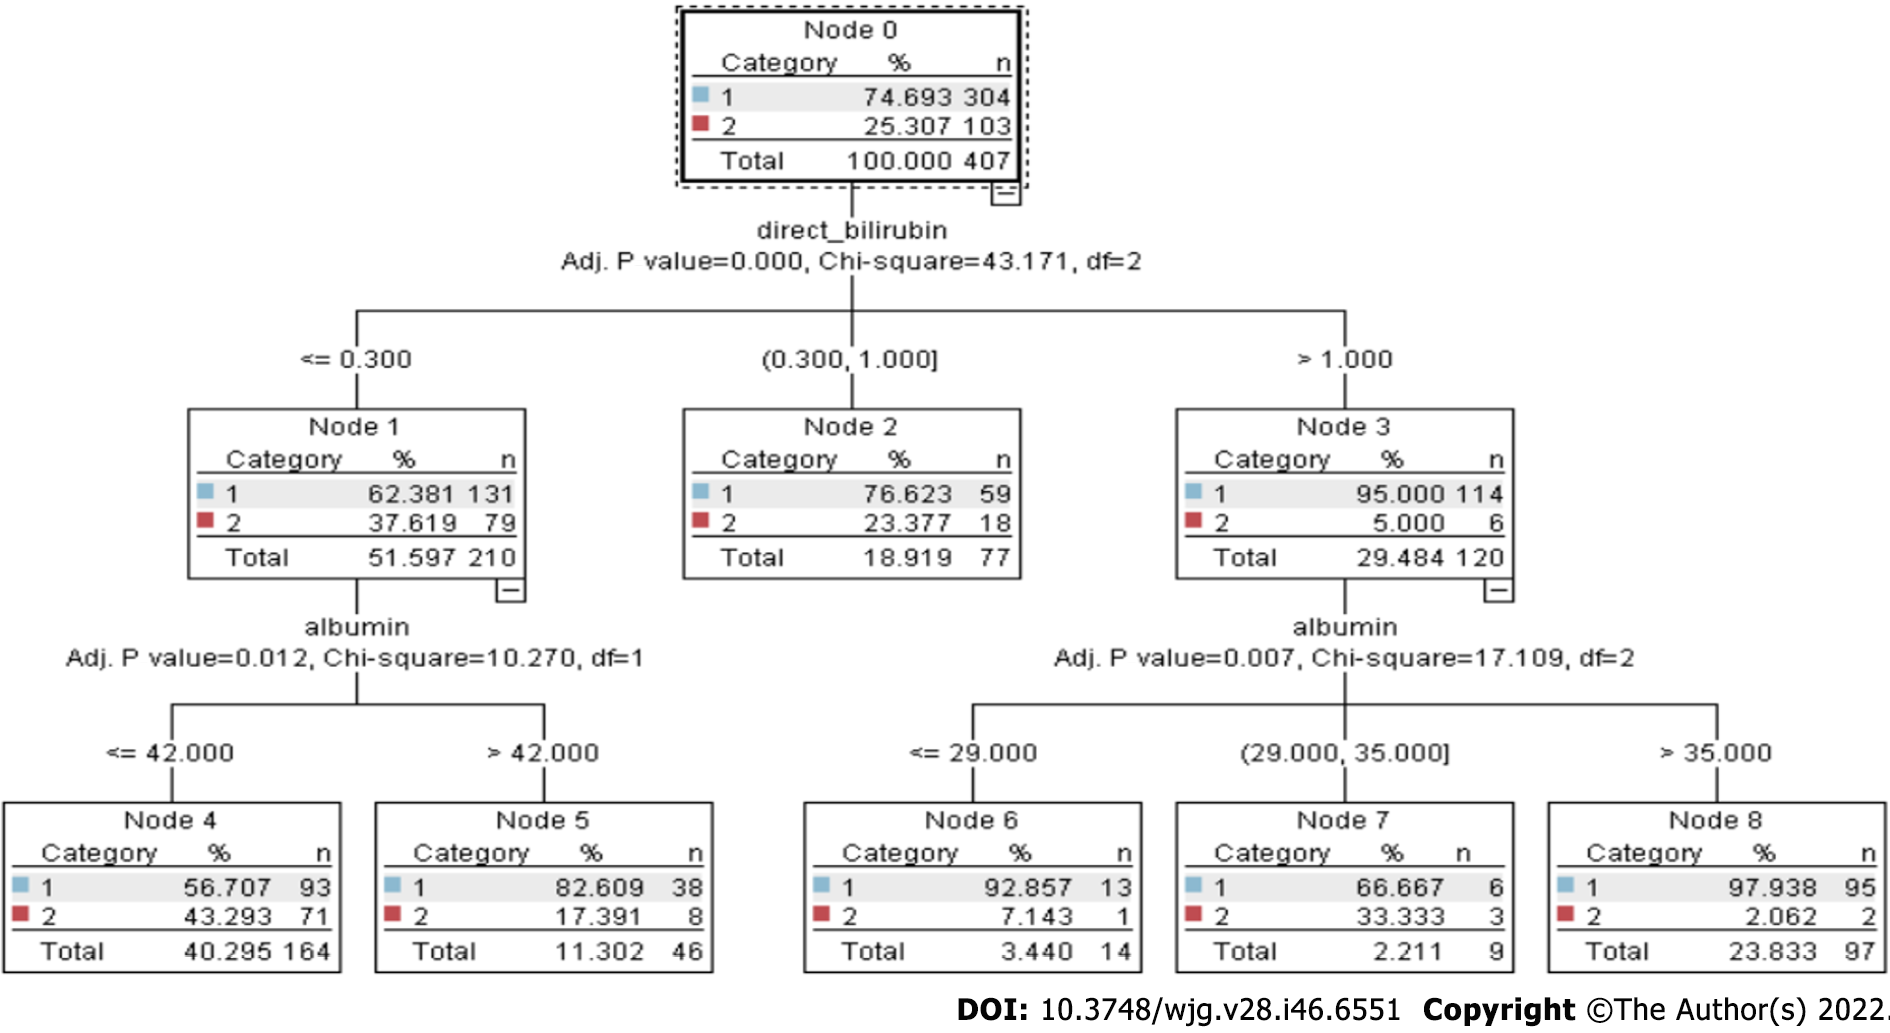
Figure 1 Chi-square automated interaction detection tree.
Chi-square automated interaction detection tree consists of multiple decision nodes (node 0 to node 8). The branch of the decision tree is levelled by three parameters (adjusted P value, χ2, and df). These parameters play a very important role in decision making.
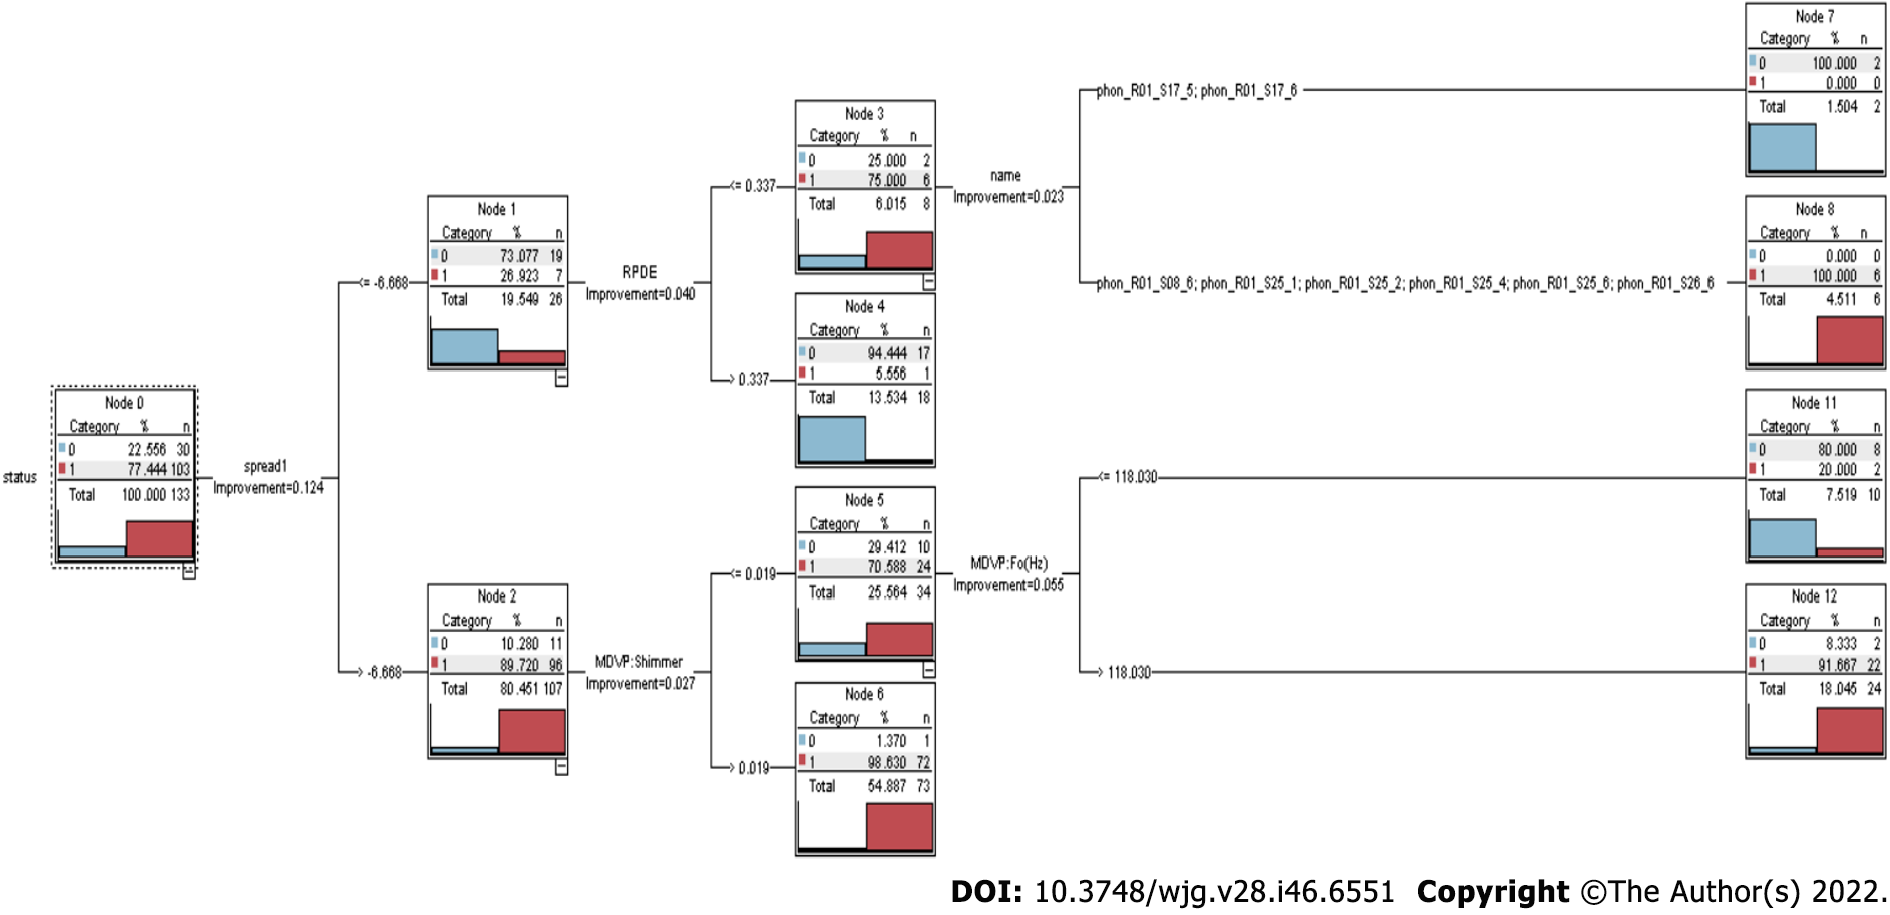
Figure 2 Classification and regression tree.
Classification and regression tree consists of multiple decision nodes (node 0 to node 12). The classification and regression tree approach can quickly uncover crucial associations that might otherwise go unnoticed when utilizing other analytical methods.
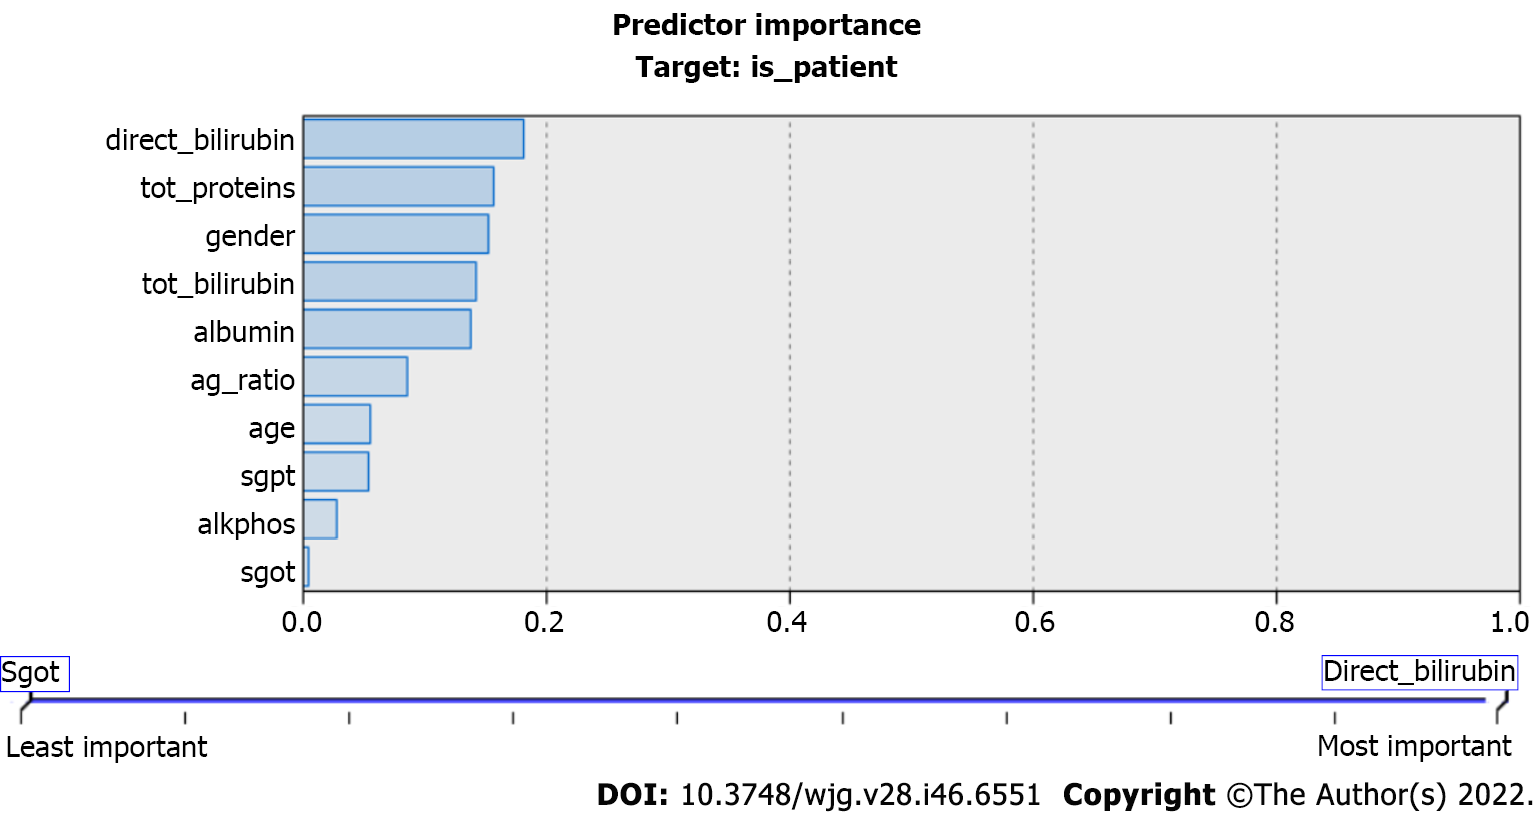
Figure 3 Predictor importance in classification and regression trees.
The values of the predicators used in the classification and regression tree model. These predictors play important roles in liver disease prediction. tot_proteins: Total protein; tot_bilirubin: Total bilirubin; ag_ratio: Ratio of compound albumin to globulin; alkphos: Alkaline phosphatase; sgpt: Serum glutamic pyruvic transaminase; sgot: Serum glutamic-oxaloacetic transaminase.
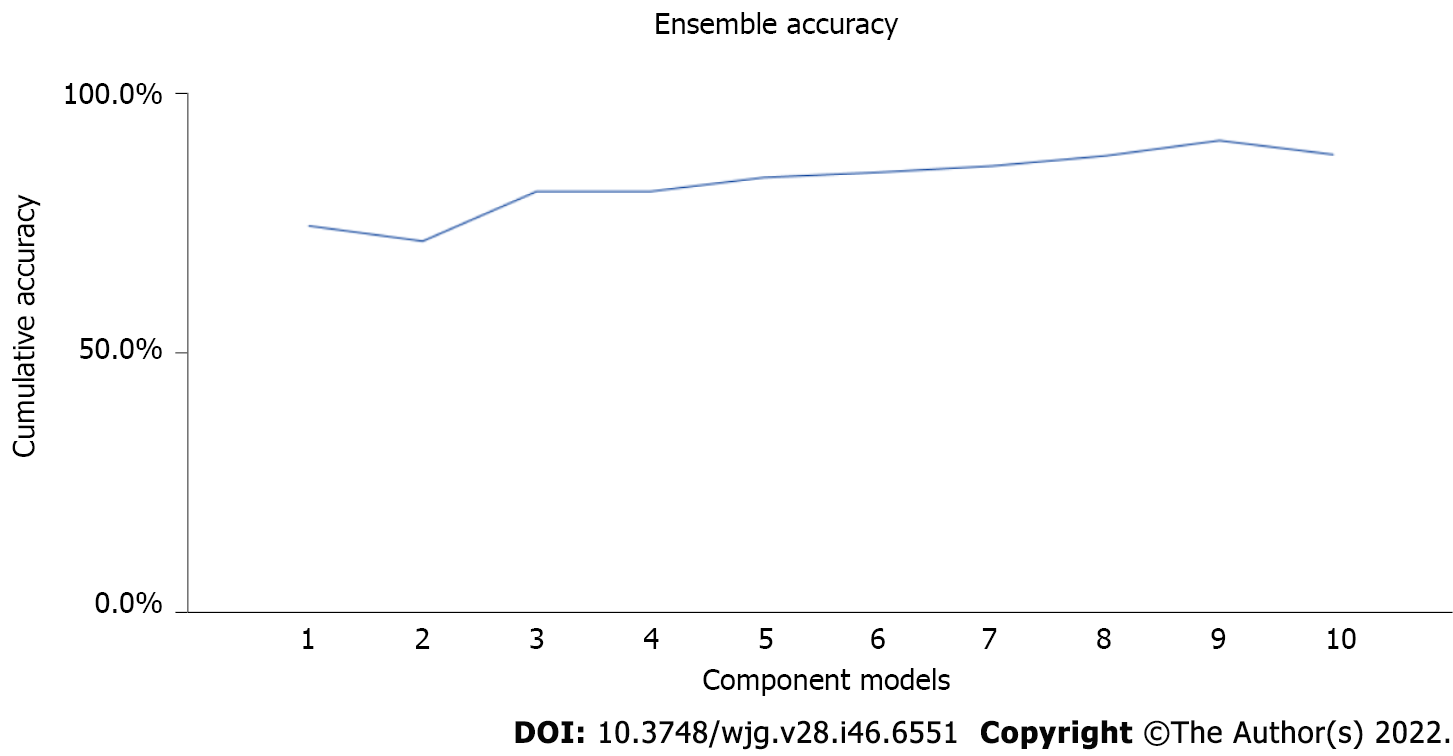
Figure 4 Ensemble accuracy.
It visually depicts ensemble accuracy that is improved gradually with each iteration. The ensemble approach increases the accuracy level of the decision tree models.
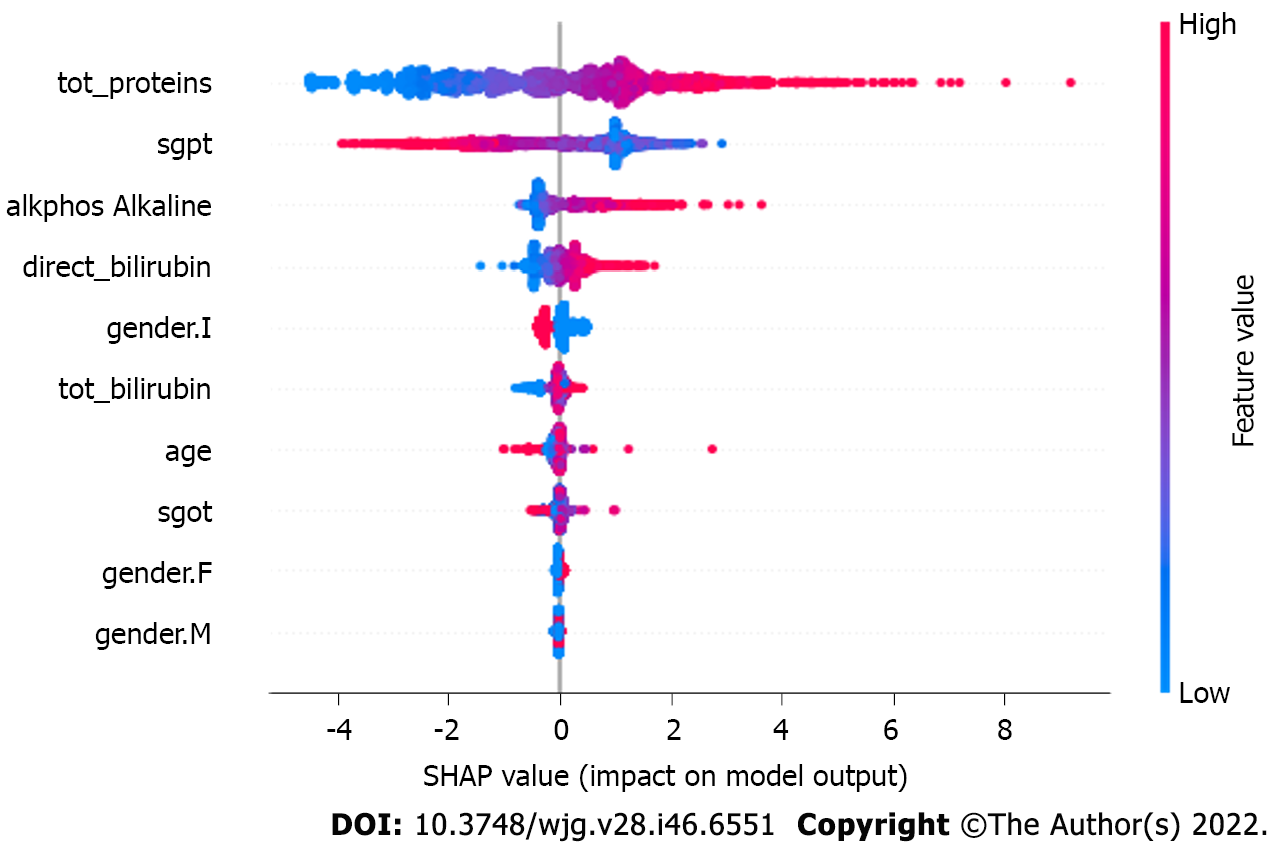
Figure 5 Predicator impact on model output.
The figure depicts the impact of the SHapley Additive exPlanations value on the eXtreme Gradient Boosting model. As the number of observations available is limited, the subsample space was set to ‘1’ to consider all the datapoints during each iteration. tot_proteins: Total protein; tot_bilirubin: Total bilirubin; alkphos: Alkaline phosphatase; sgpt: Serum glutamic pyruvic transaminase; sgot: Serum glutamic-oxaloacetic transaminase; F: Female; M: Male.
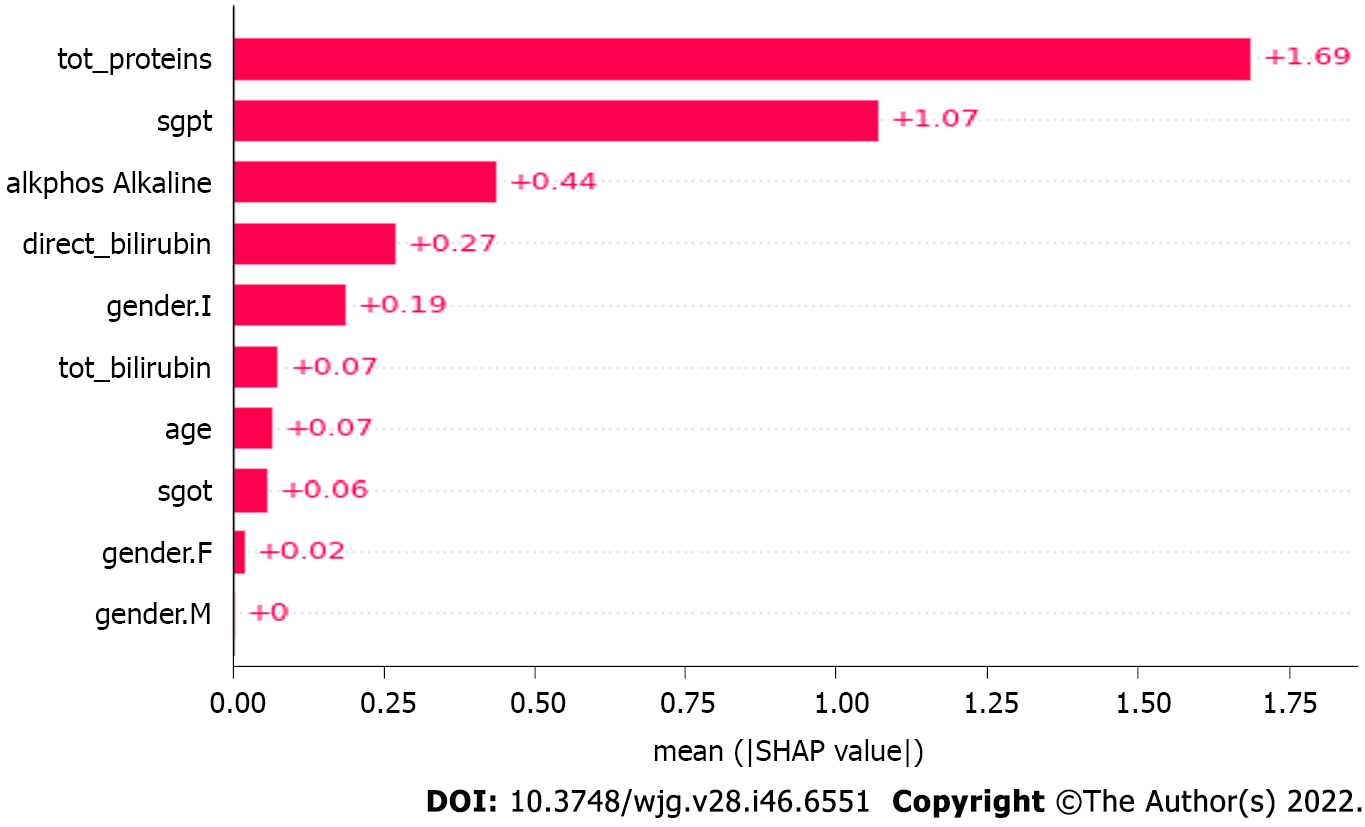
Figure 6 Mean SHapley Additive exPlanations value.
The mean of the SHapley Additive exPlanations values in the eXtreme Gradient Boosting model. The ‘eta’ parameter value is set to default ‘0.3’ to keep the weights stable after each iteration, whereas the gamma value to specify the loss reduction required for the split up is ‘0.’ tot_proteins: Total protein; tot_bilirubin: Total bilirubin; alkphos: Alkaline phosphatase; sgpt: Serum glutamic pyruvic transaminase; sgot: Serum glutamic-oxaloacetic transaminase; F: Female; M: Male.
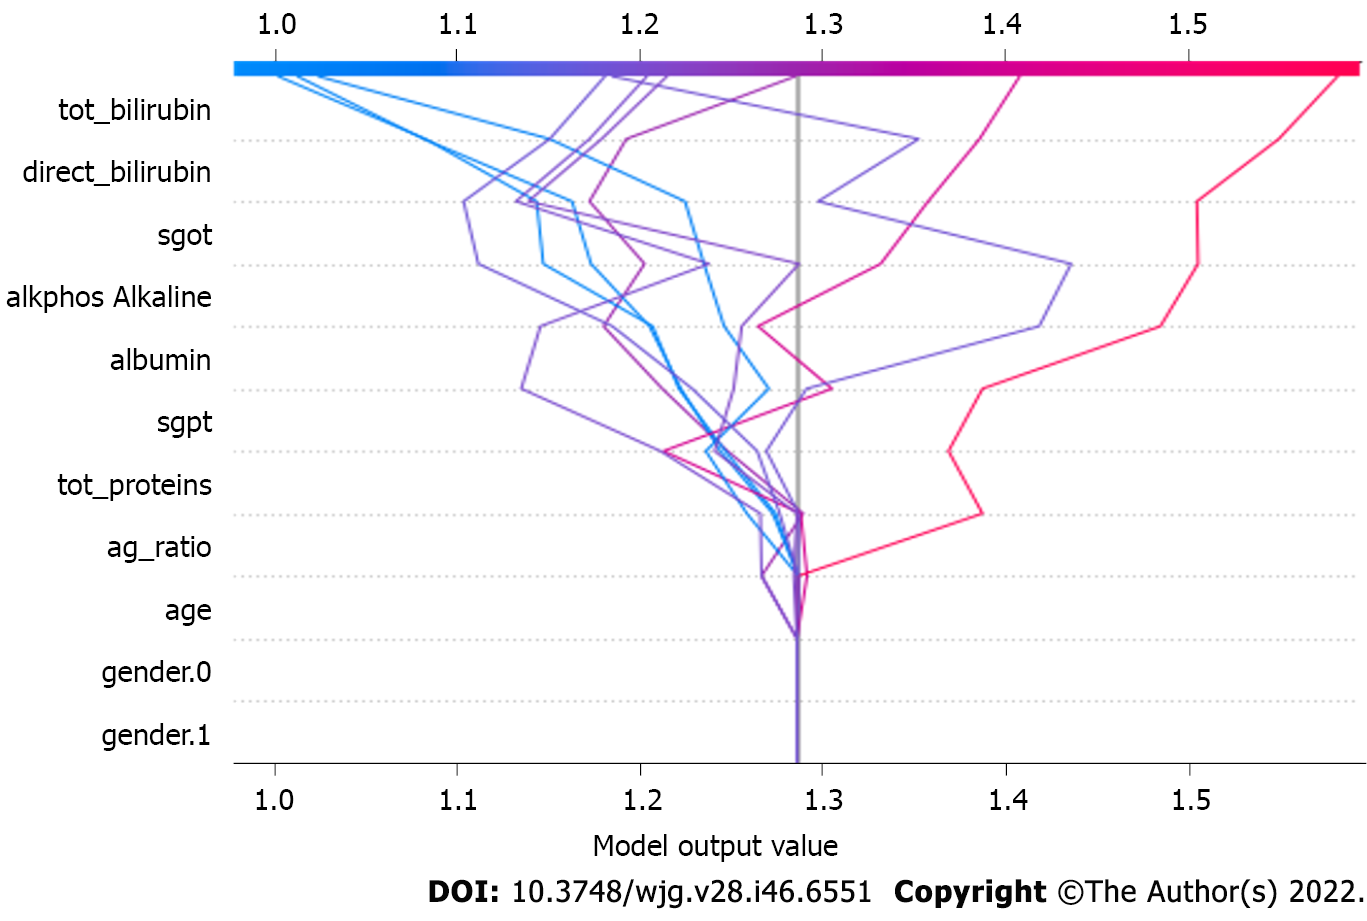
Figure 7 Model output value.
The model output value in the eXtreme Gradient Boosting model. These parameters make a direct impact on the output generated by the eXtreme Gradient Boosting model. tot_proteins: Total protein; tot_bilirubin: Total bilirubin; ag_ratio: Ratio of compound albumin to globulin; alkphos: Alkaline phosphatase; sgpt: Serum glutamic pyruvic transaminase; sgot: Serum glutamic-oxaloacetic transaminase.
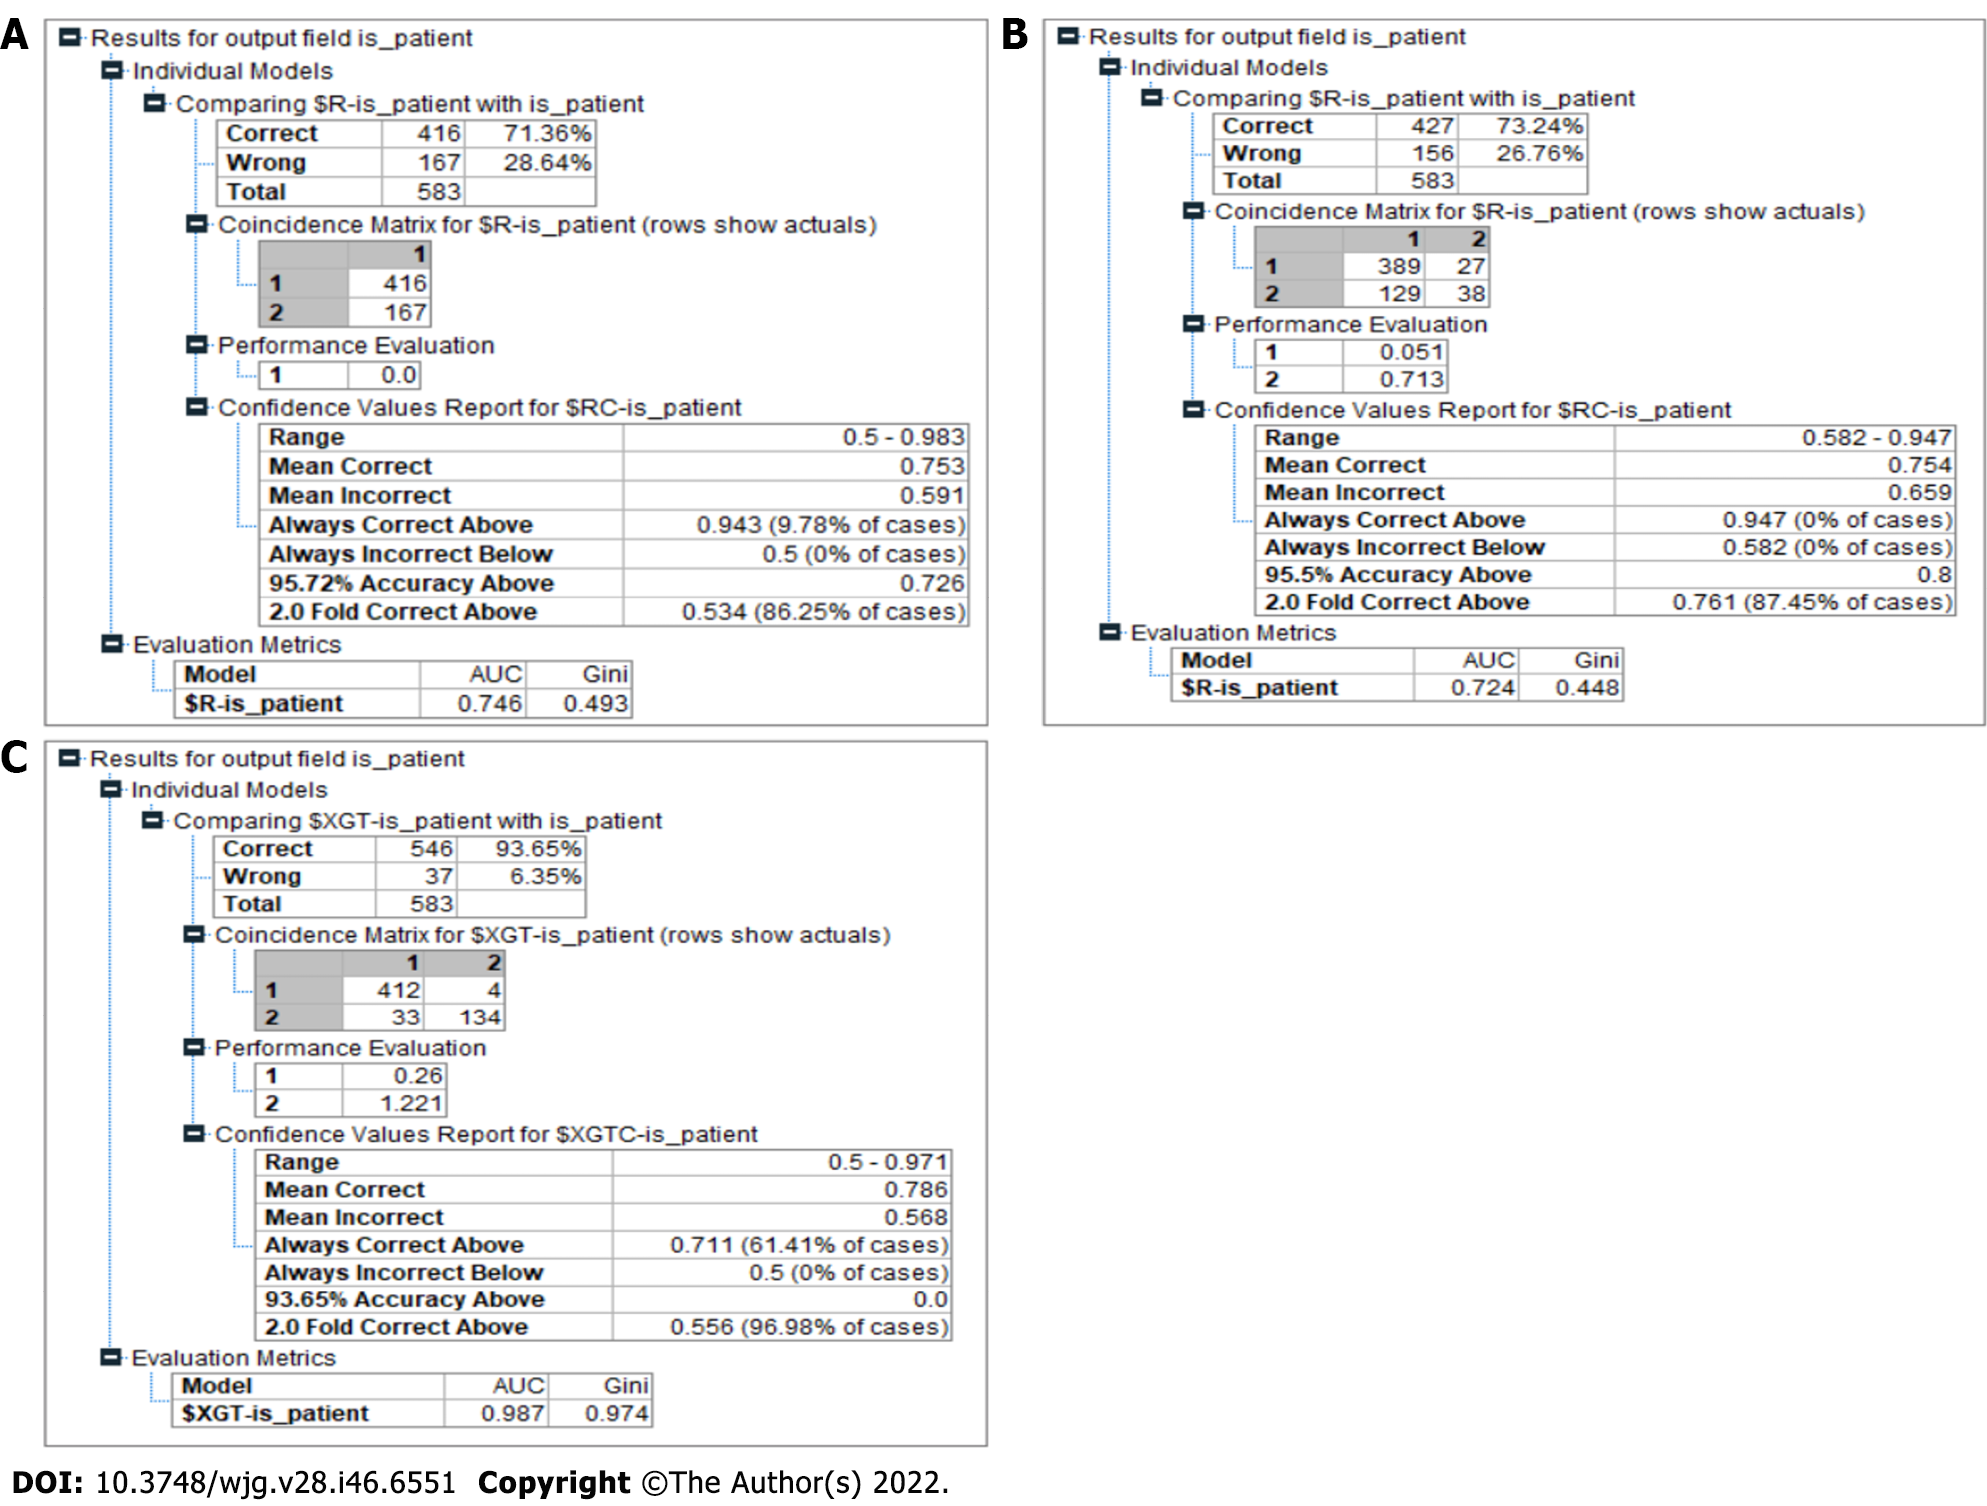
Figure 8 Model results.
A: Chi-square automated interaction detection (CHAID) results. The CHAID model had 71.36% accuracy in predicting liver disease. The area under the curve (AUC) and Gini values of this model were 0.746 and 0.493, respectively; B: Classification and regression tree results. The result for the classification and regression tree model showed a better accuracy at predicting the liver disease compared to the CHAID model at 73.24%. The AUC and Gini values of this model were 0.724 and 0.4448, respectively; C: Proposed model results. The model produced an accuracy of 93.65% in predicting liver disease, outperforming the other models significantly. It also recorded a Gini index of 0.97, categorizing it as a highly efficient model in making the distinction between a patient who has liver disease and a patient who is healthy in the given context.
- Citation: Dalal S, Onyema EM, Malik A. Hybrid XGBoost model with hyperparameter tuning for prediction of liver disease with better accuracy. World J Gastroenterol 2022; 28(46): 6551-6563
- URL: https://www.wjgnet.com/1007-9327/full/v28/i46/6551.htm
- DOI: https://dx.doi.org/10.3748/wjg.v28.i46.6551


