Copyright
©The Author(s) 2022.
World J Gastroenterol. Dec 14, 2022; 28(46): 6522-6536
Published online Dec 14, 2022. doi: 10.3748/wjg.v28.i46.6522
Published online Dec 14, 2022. doi: 10.3748/wjg.v28.i46.6522
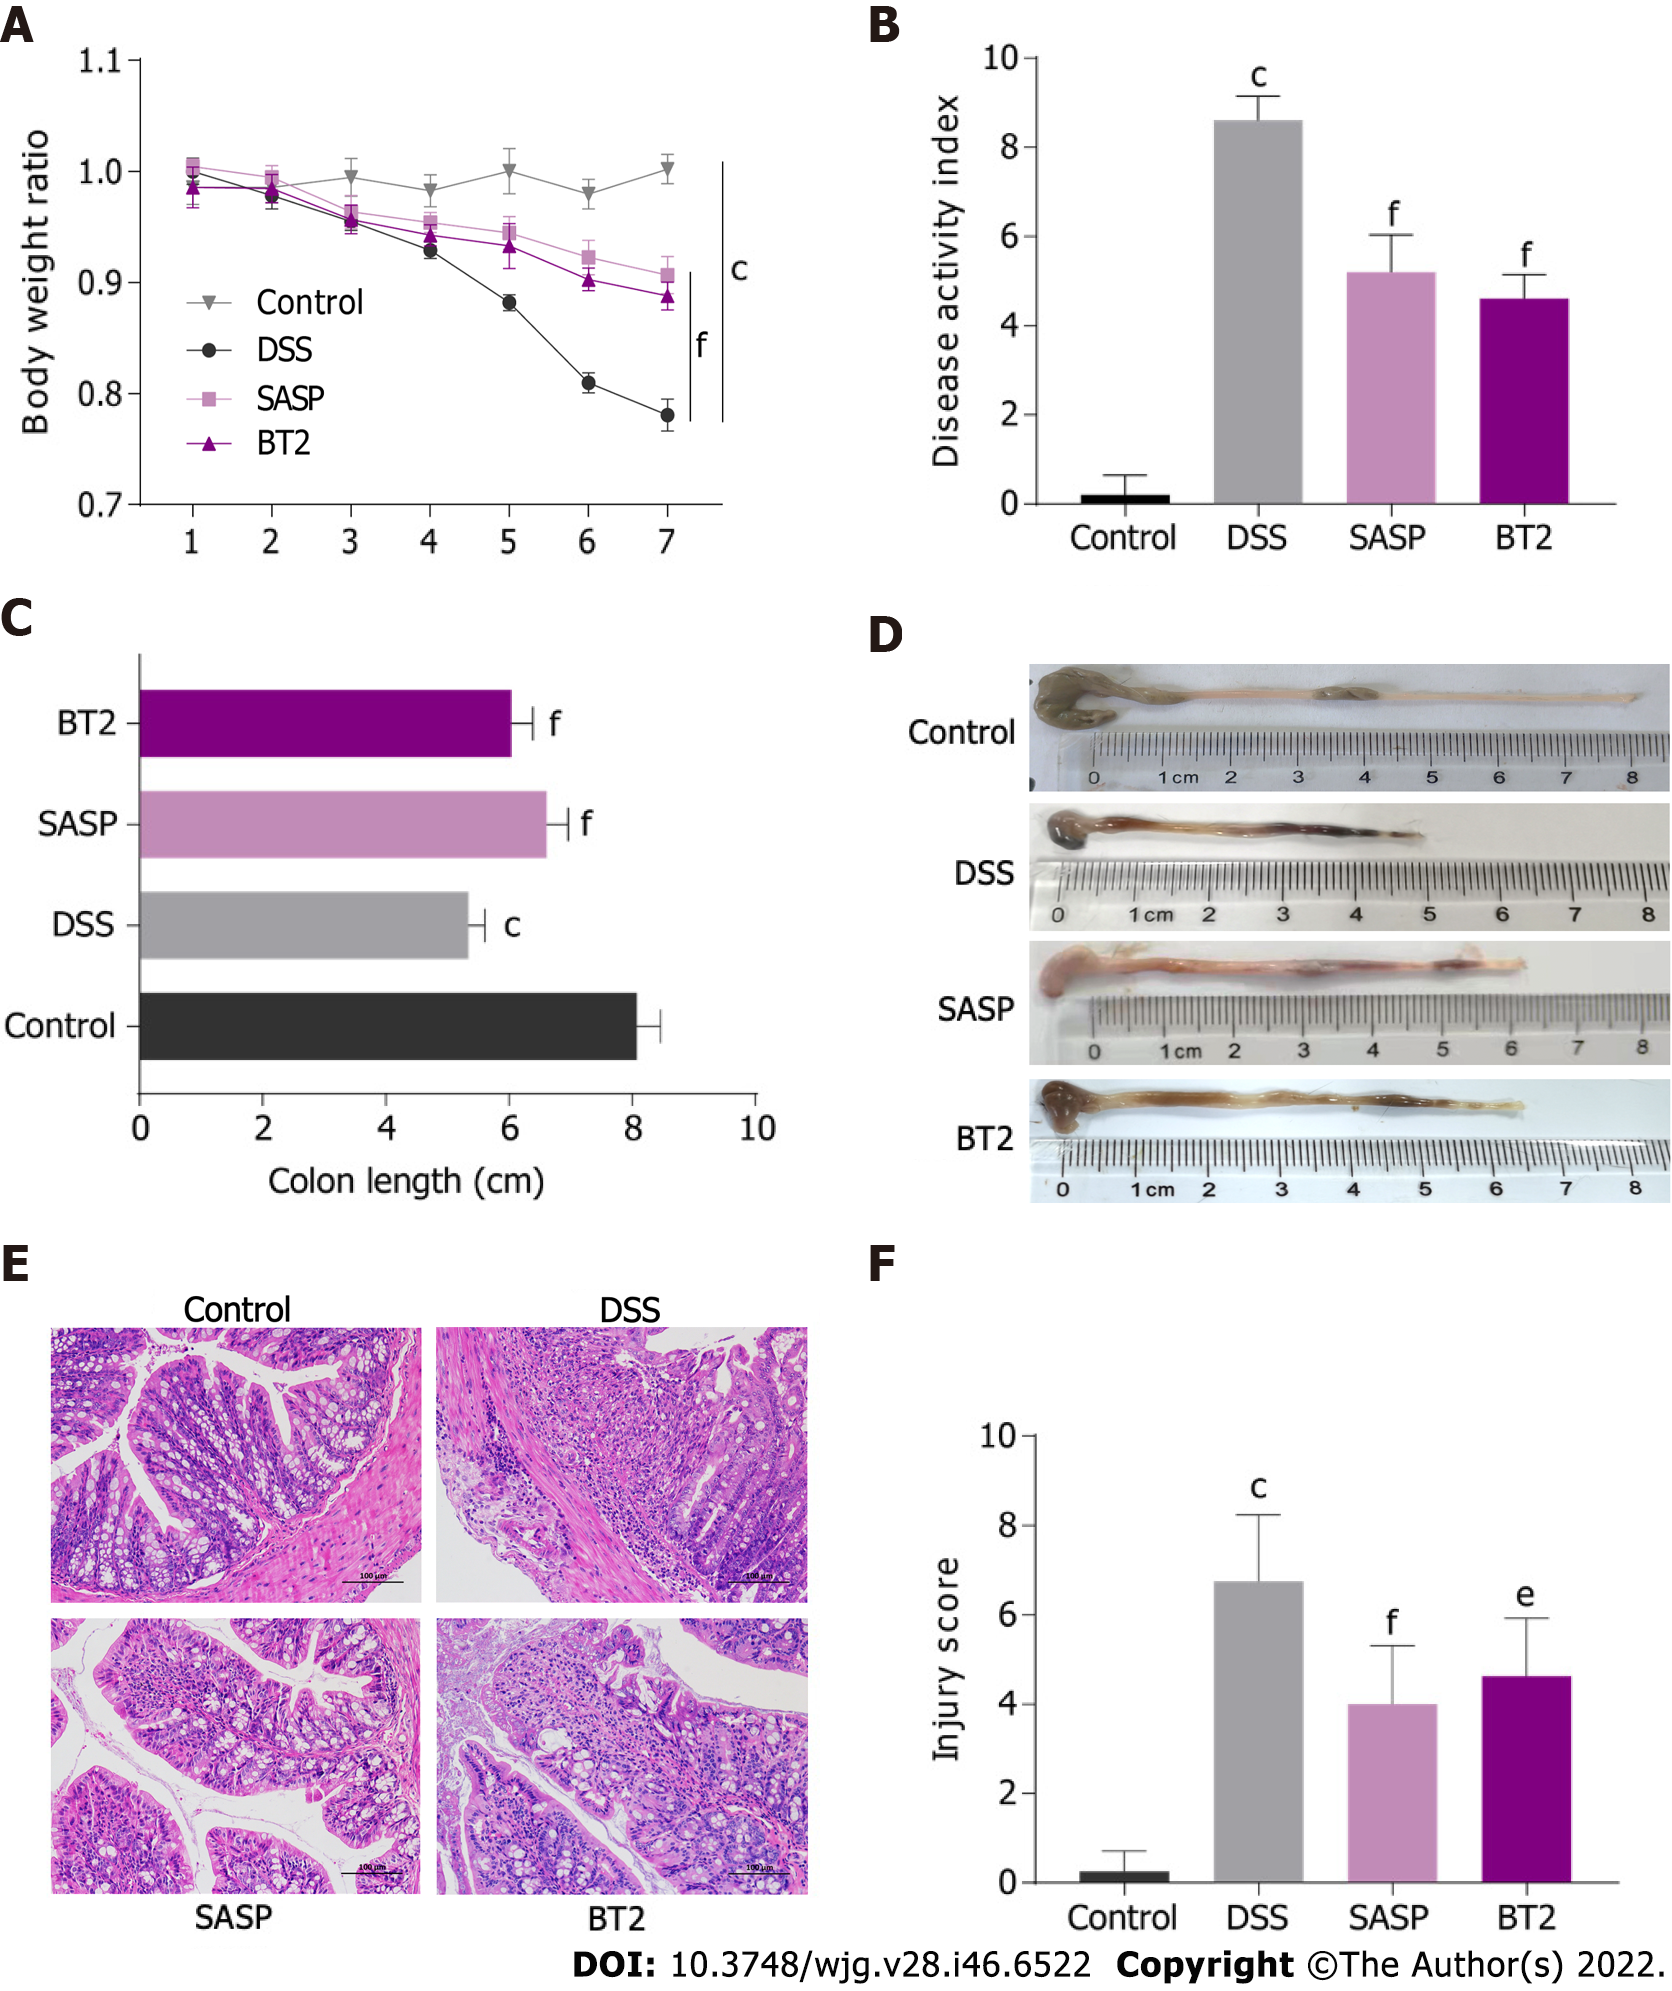
Figure 1 3,6-dichlorobenzo[b]thiophene-2-carboxylic acid improved colon inflammation in dextran sodium sulfate-treated mice.
A: Changes in the body weight of mice; B: Disease activity index of each group of mice on day 8 (n = 5); C: The colon length of each group of mice was measured; D: Macroscopic observation of colons; E: Representative hematoxylin and eosin staining images of colon sections (200 × magnification); F: Injury scores. eP < 0.01 and
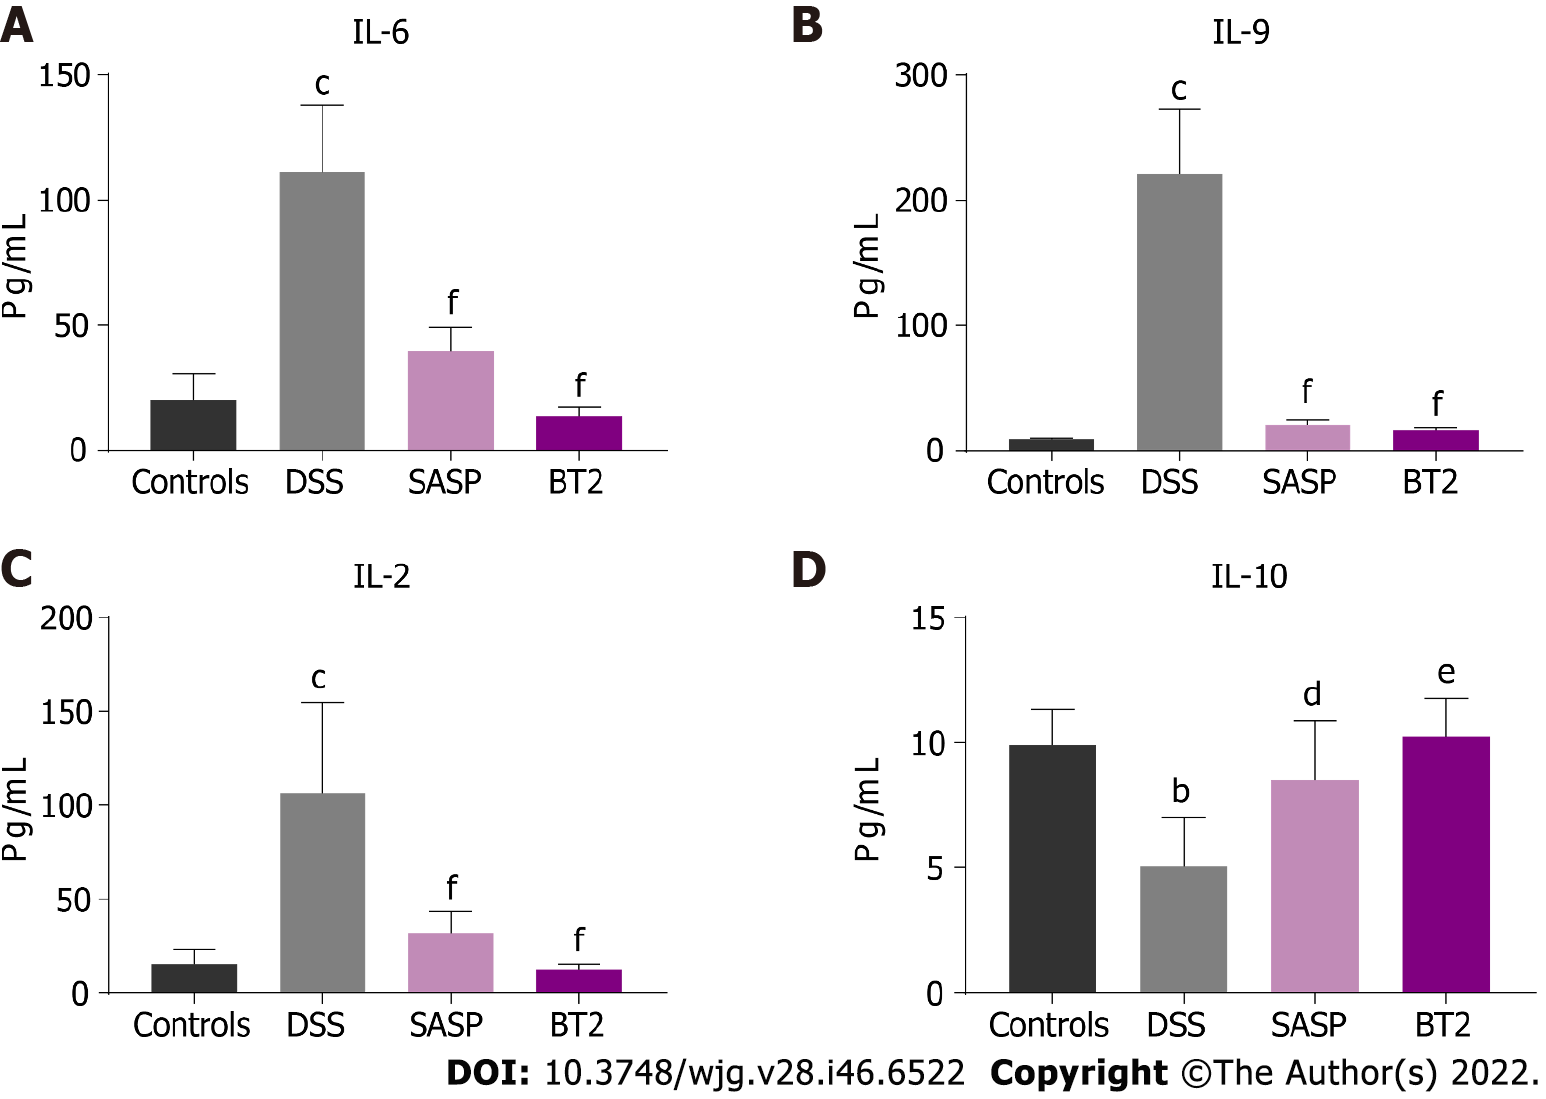
Figure 2 3,6-dichlorobenzo[b]thiophene-2-carboxylic acid reduced the inflammatory cytokine levels in serum.
The contents of interleukin (IL)-6, IL-9, IL-2 and IL-10 in serum were detected by flow cytometry. A: IL-6; B: IL-9; C: IL-2; D: IL-10. dP < 0.05, eP < 0.01, and fP < 0.001 vs the dextran sodium sulfate group; bP < 0.01 and cP < 0.001 vs the control group. The data are shown as the mean ± SD (n = 4). DSS: Dextran sodium sulfate; SASP: Salazosulfapyridine; BT2: 3,6-dichlorobenzo[b]thiophene-2-carboxylic acid.
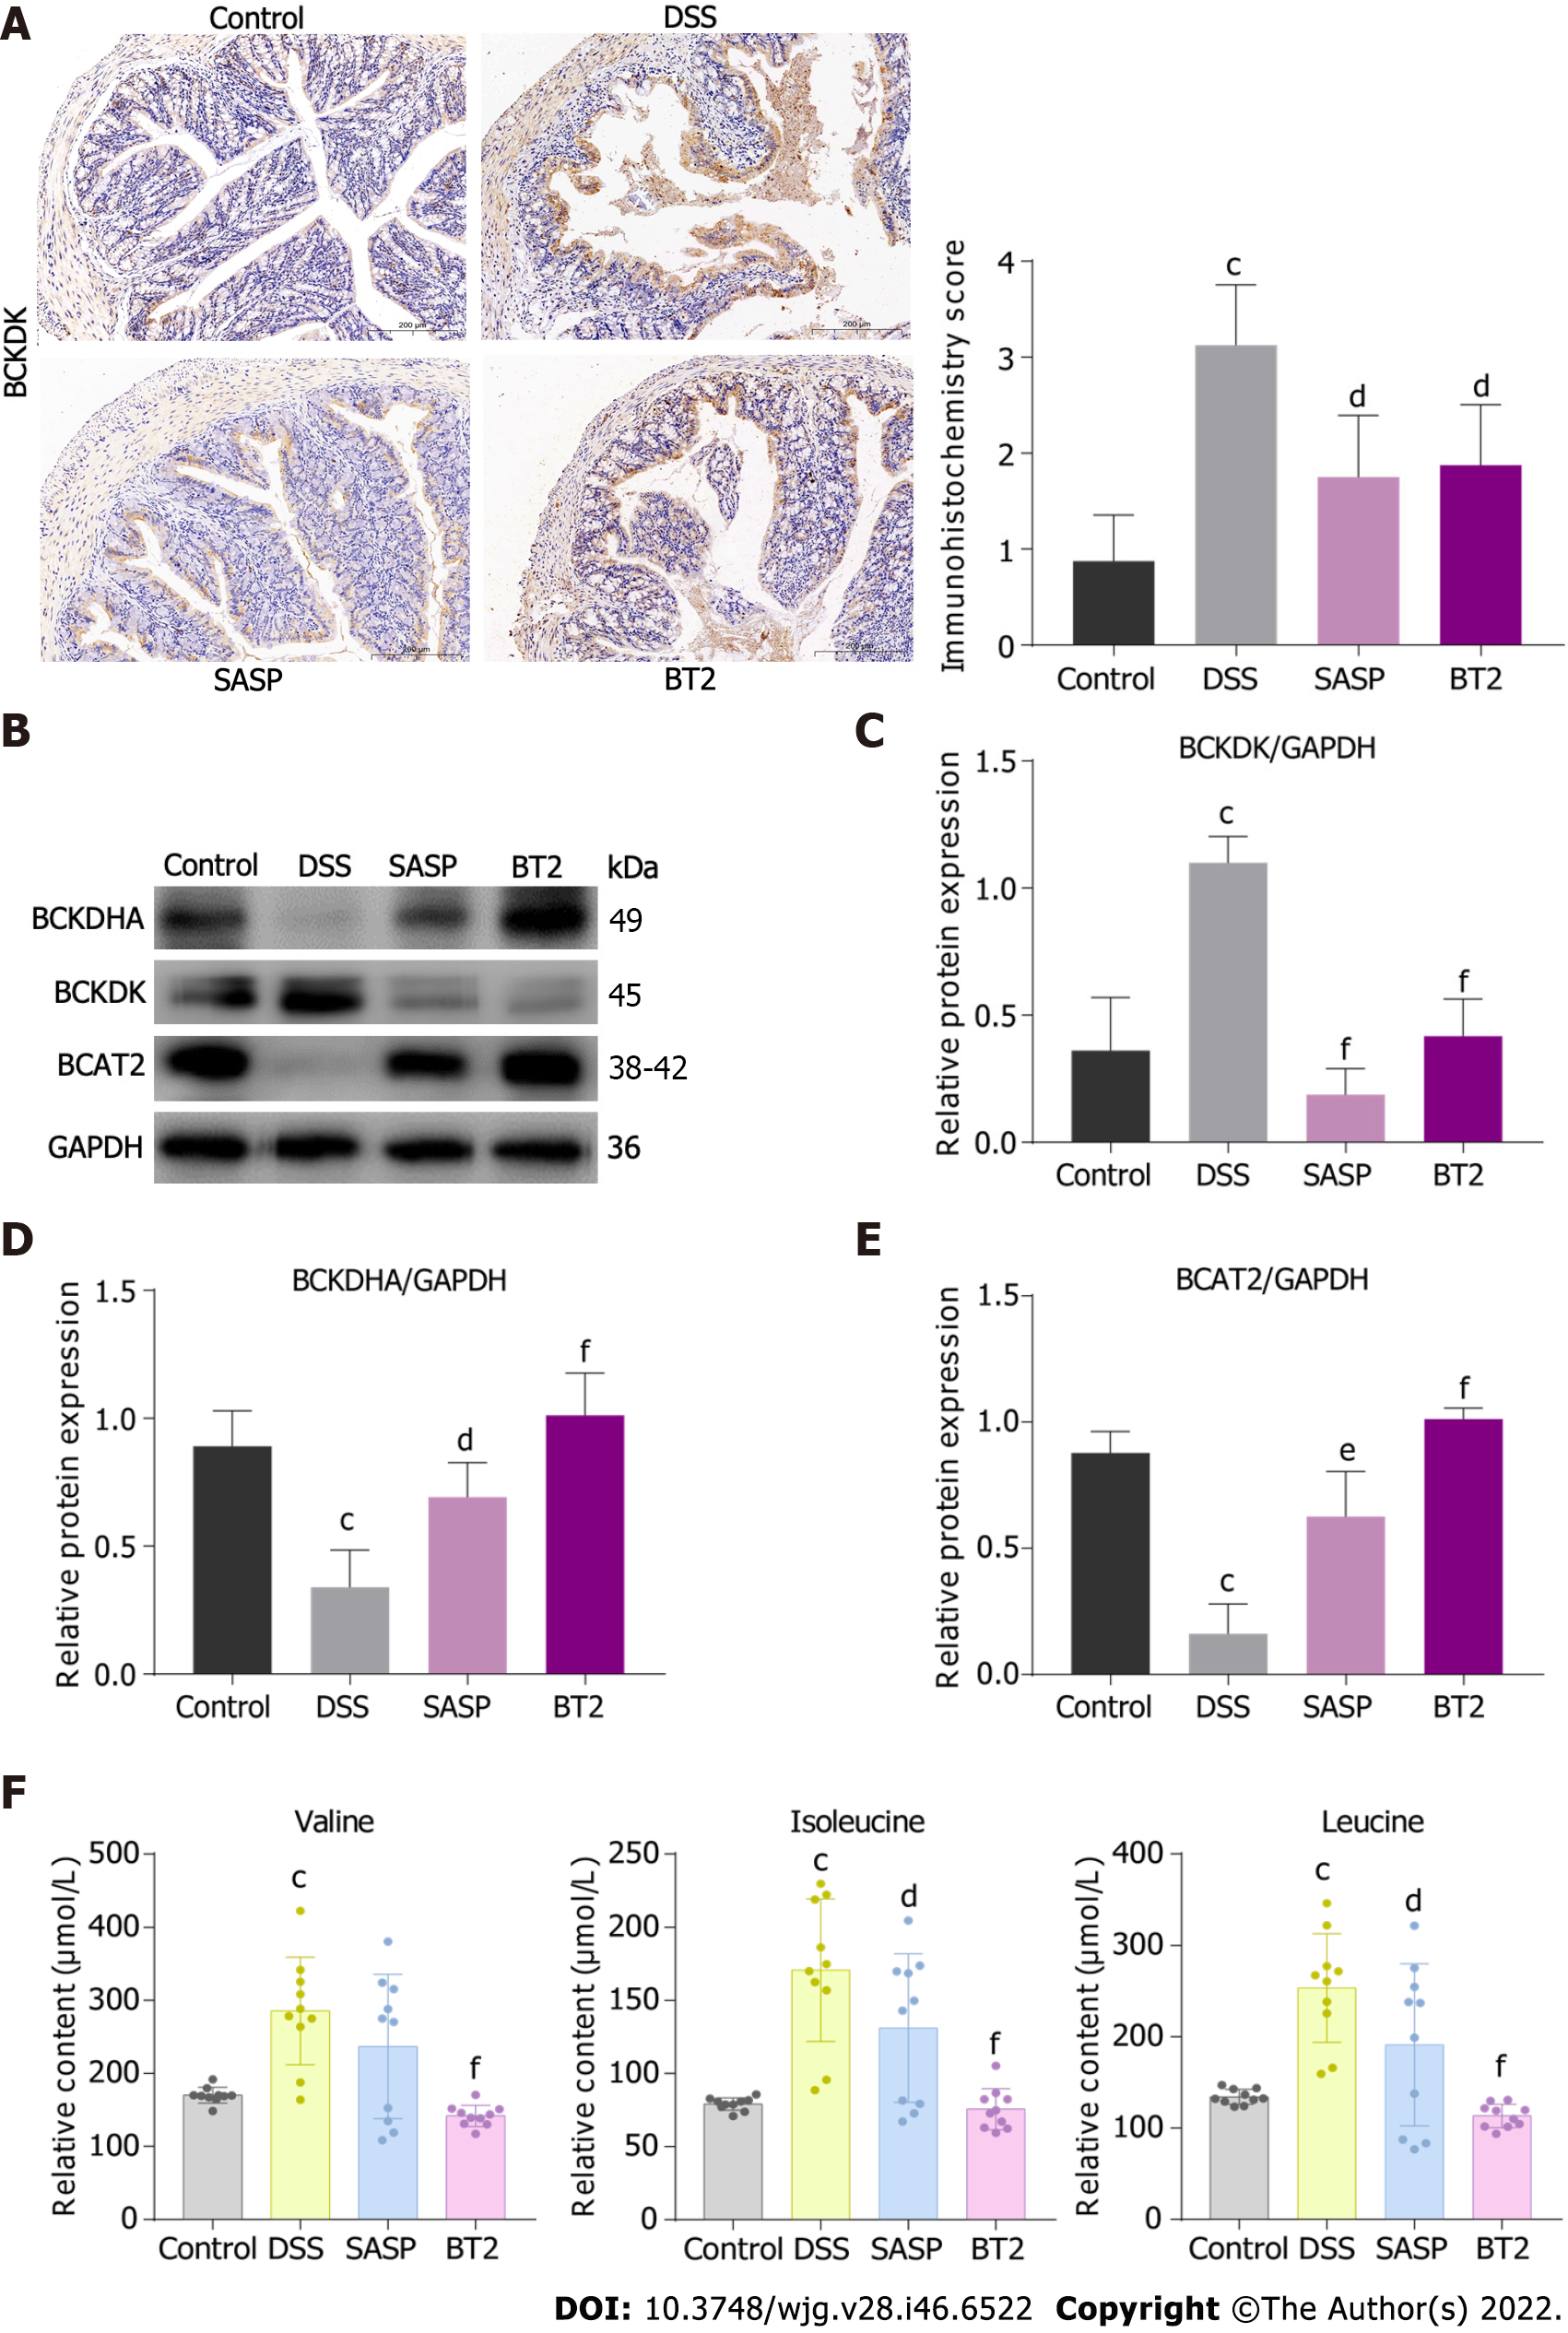
Figure 3 3,6-dichlorobenzo[b]thiophene-2-carboxylic acid improved branched-chain amino acid catabolism in dextran sodium sulfate-induced colitis mice.
A: The expression of branched-chain α-keto acid dehydrogenase kinase in colon sections was detected by immunohistochemical assays (n = 4, 200 × magnification); B-E: Western blot images and quantitative data of branched-chain amino acid (BCAA) catabolic enzymes in colon tissues (n = 3-4); F: The contents of BCAAs, including valine, leucine and isoleucine, in mouse serum were determined by liquid chromatography-tandem mass spectrometry (n = 10). dP < 0.05, eP < 0.01, and fP < 0.001 vs the dextran sodium sulfate group; cP < 0.001 vs the control group. The data are shown as the mean ± SD. BCKDK: Branched-chain α-keto acid dehydrogenase kinase; DSS: Dextran sodium sulfate; SASP: Salazosulfapyridine; BT2: 3,6-dichlorobenzo[b]thiophene-2-carboxylic acid.
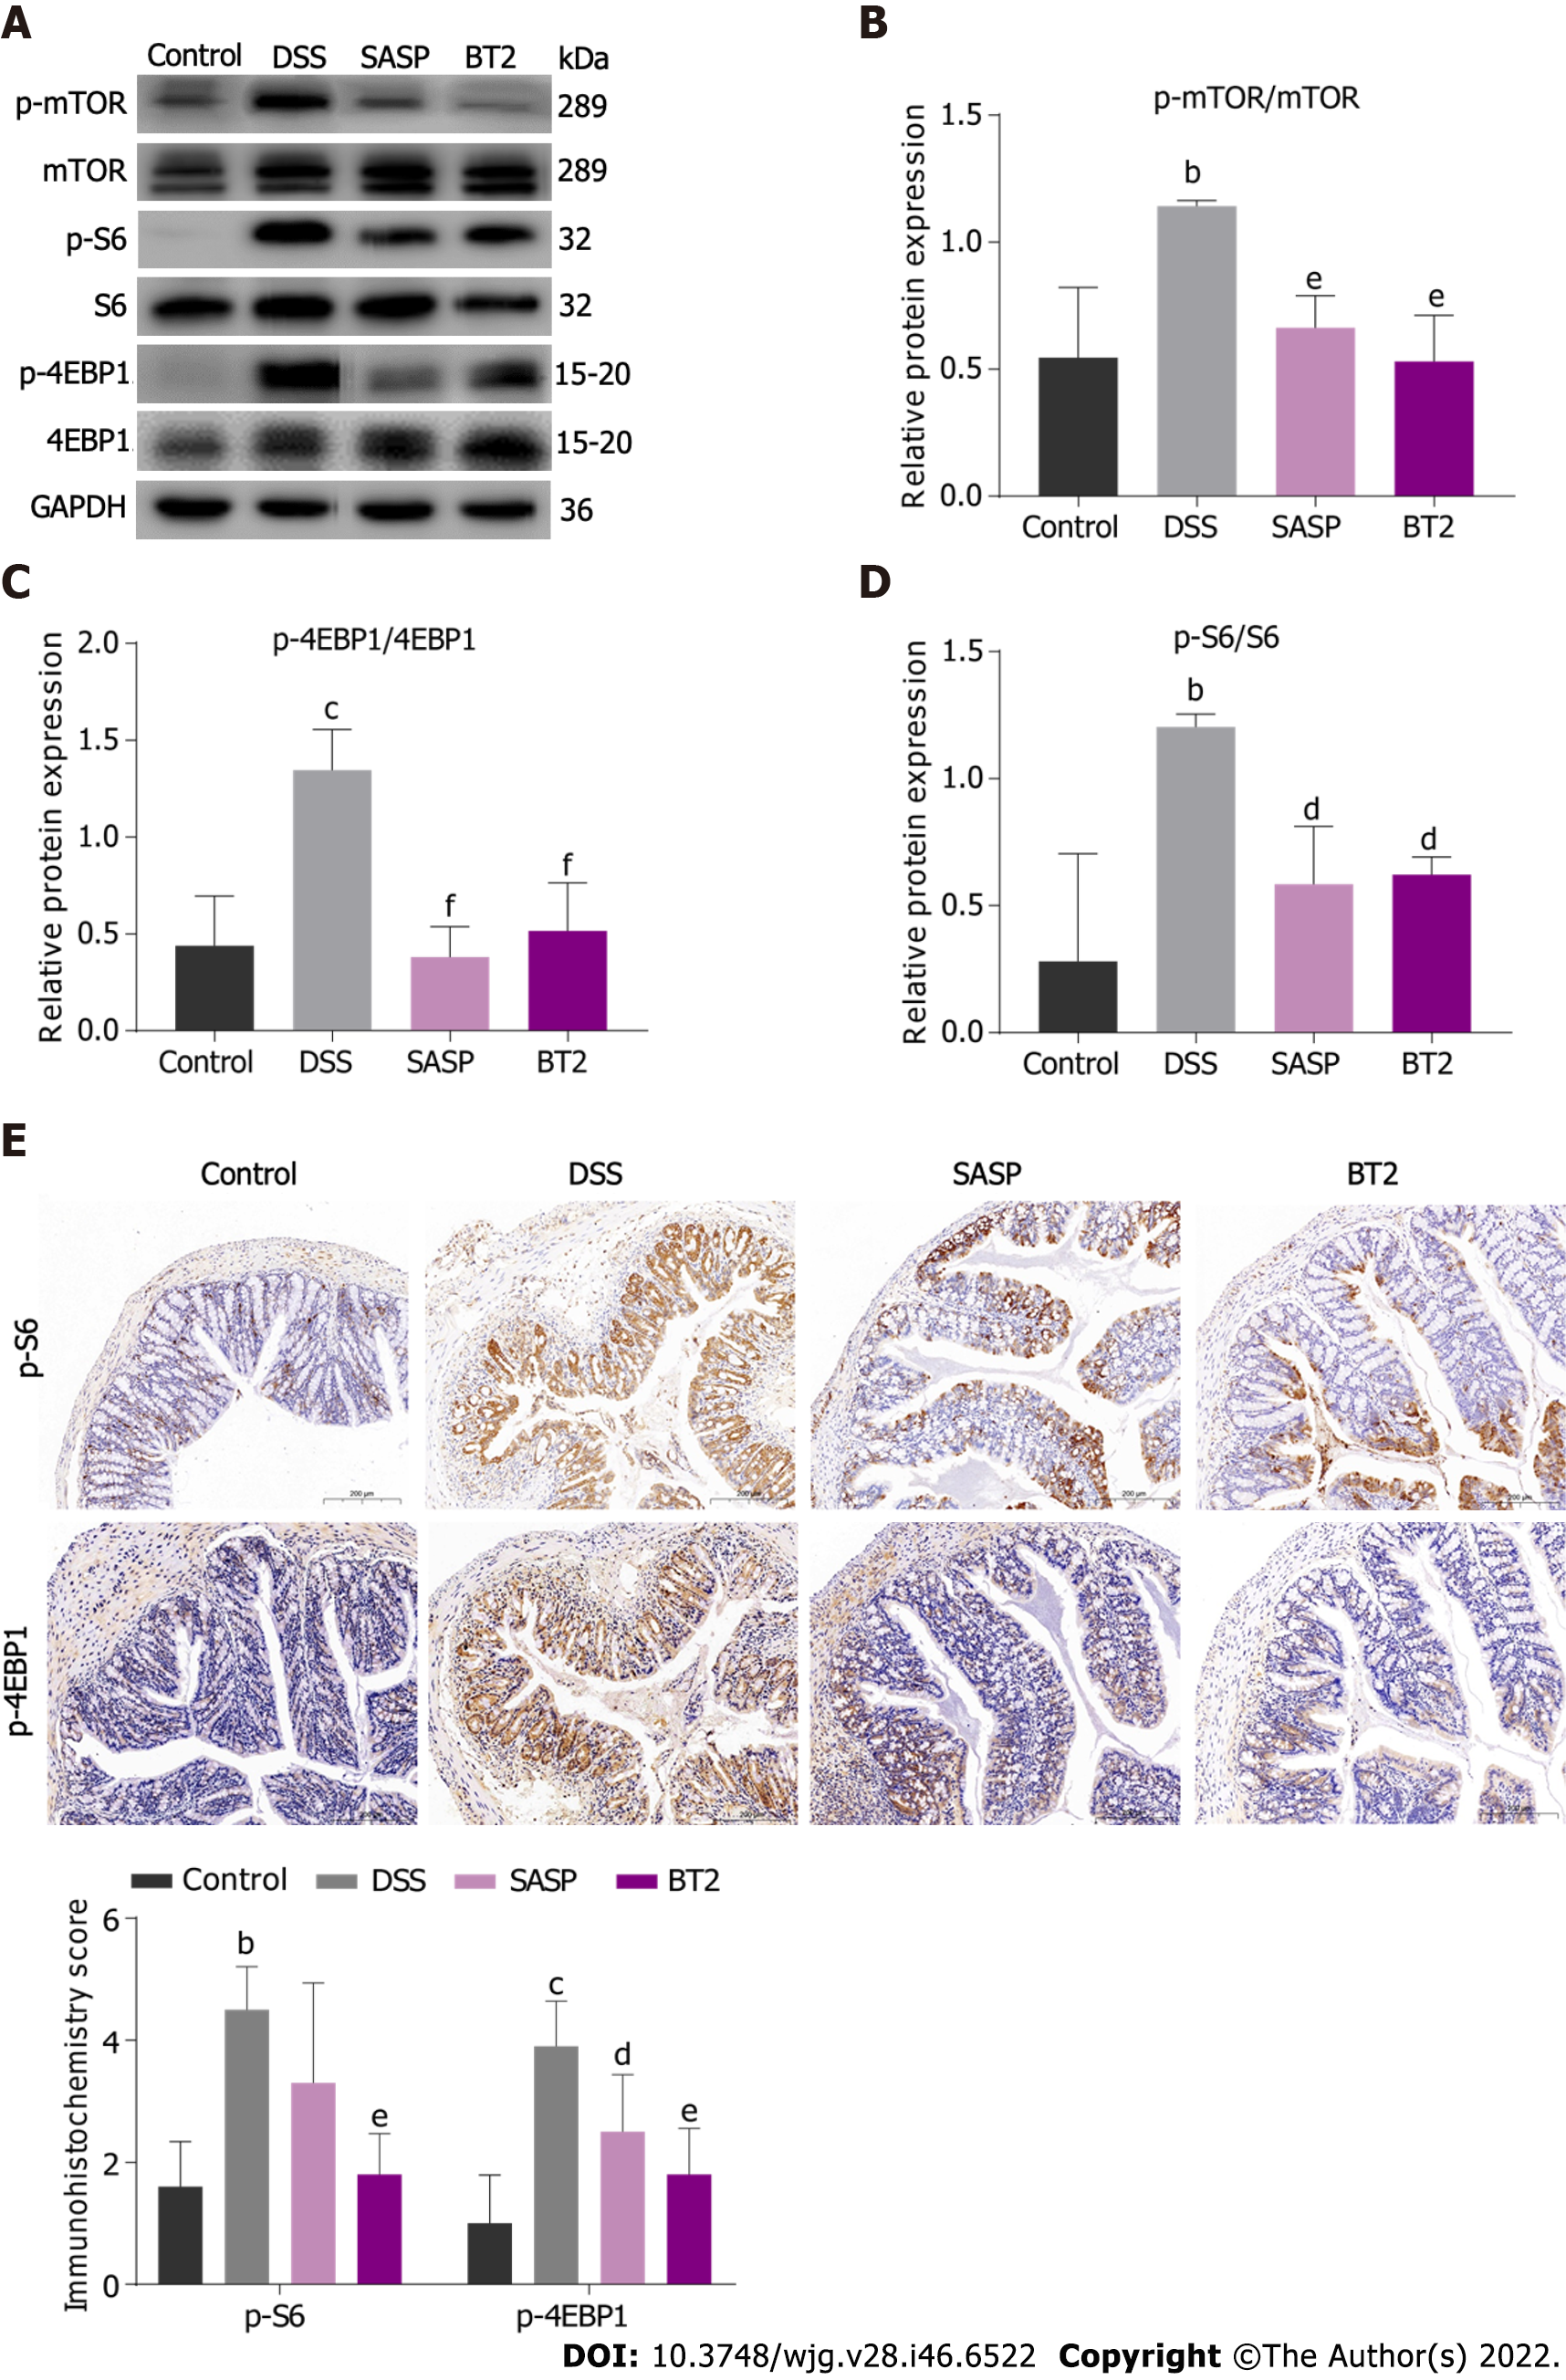
Figure 4 3,6-dichlorobenzo[b]thiophene-2-carboxylic acid suppressed the activity of the mammalian target of rapamycin complex 1 activation.
A-D: The total and phosphorylated proteins of S6, eukaryotic translation initiation factor 4E binding protein 1 (4EBP1) and mammalian target of rapamycin were measured by Western blot analysis; E: Immunohistochemical analysis of the expression of phosphorylated S6 and phosphorylated 4EBP1 in colon tissues (200 × magnification). dP < 0.05, eP < 0.01, and fP < 0.001 vs the dextran sodium sulfate group; bP < 0.01 and cP < 0.001 vs the control group. The data are shown as the mean ± SD (n = 3-5). mTOR: Mammalian target of rapamycin; S6: Ribosomal protein S6; 4EBP1: Eukaryotic translation initiation factor 4E binding protein 1; DSS: Dextran sodium sulfate; SASP: Salazosulfapyridine; BT2: 3,6-dichlorobenzo[b]thiophene-2-carboxylic acid.
Figure 5 3,6-dichlorobenzo[b]thiophene-2-carboxylic acid reduced cyclooxygenase-2 expression.
A and B: The level of cyclooxygenase-2 (COX-2) in colon tissues was detected by Western blotting; C: The mRNA level of COX-2 in colon tissues was detected by real-time polymerase chain reaction. fP < 0.001 vs the dextran sodium sulfate group; cP < 0.001 vs the control group. The data are shown as the mean ± SD (n = 4). COX-2: Cyclooxygenase-2; DSS: Dextran sodium sulfate; SASP: Salazosulfapyridine; BT2: 3,6-dichlorobenzo[b]thiophene-2-carboxylic acid.
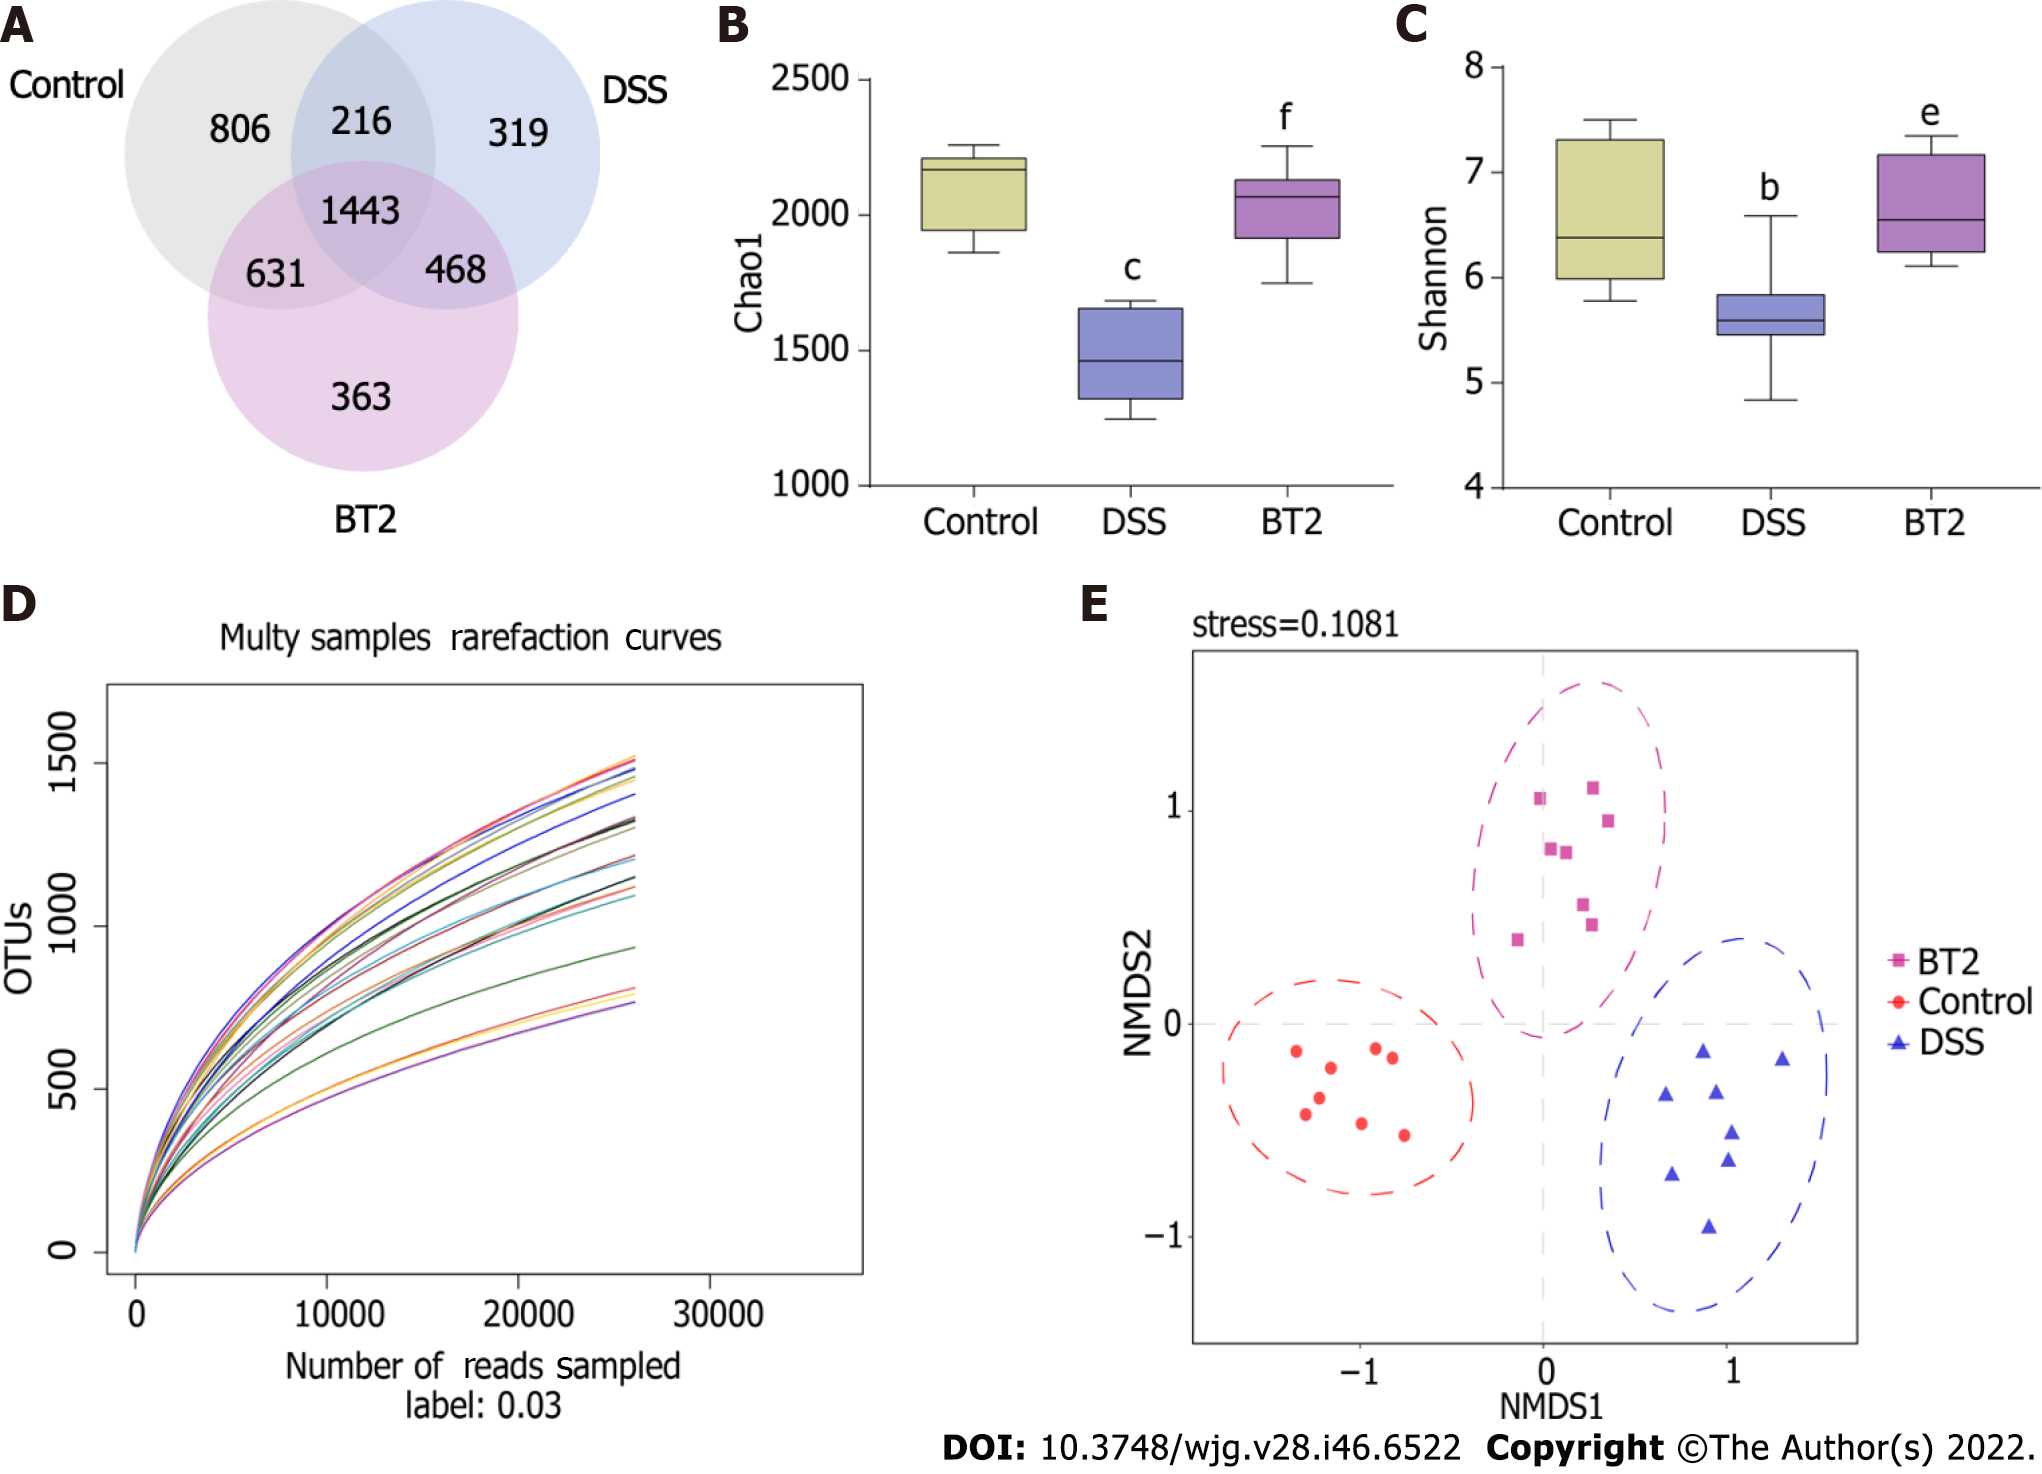
Figure 6 Effects of 3,6-dichlorobenzo[b]thiophene-2-carboxylic acid treatment on the overall structure of gut microbiota.
A: The Venn diagram depicts the overlap of operational taxonomic units in each group; B: Chao1 index from fecal samples; C: Shannon index from fecal samples; D: The dilution curve indicates the rationality of the amount of sequencing data; E: Nonmetric multidimensional scaling analysis plot of fecal microbiota of each group. eP < 0.01 and
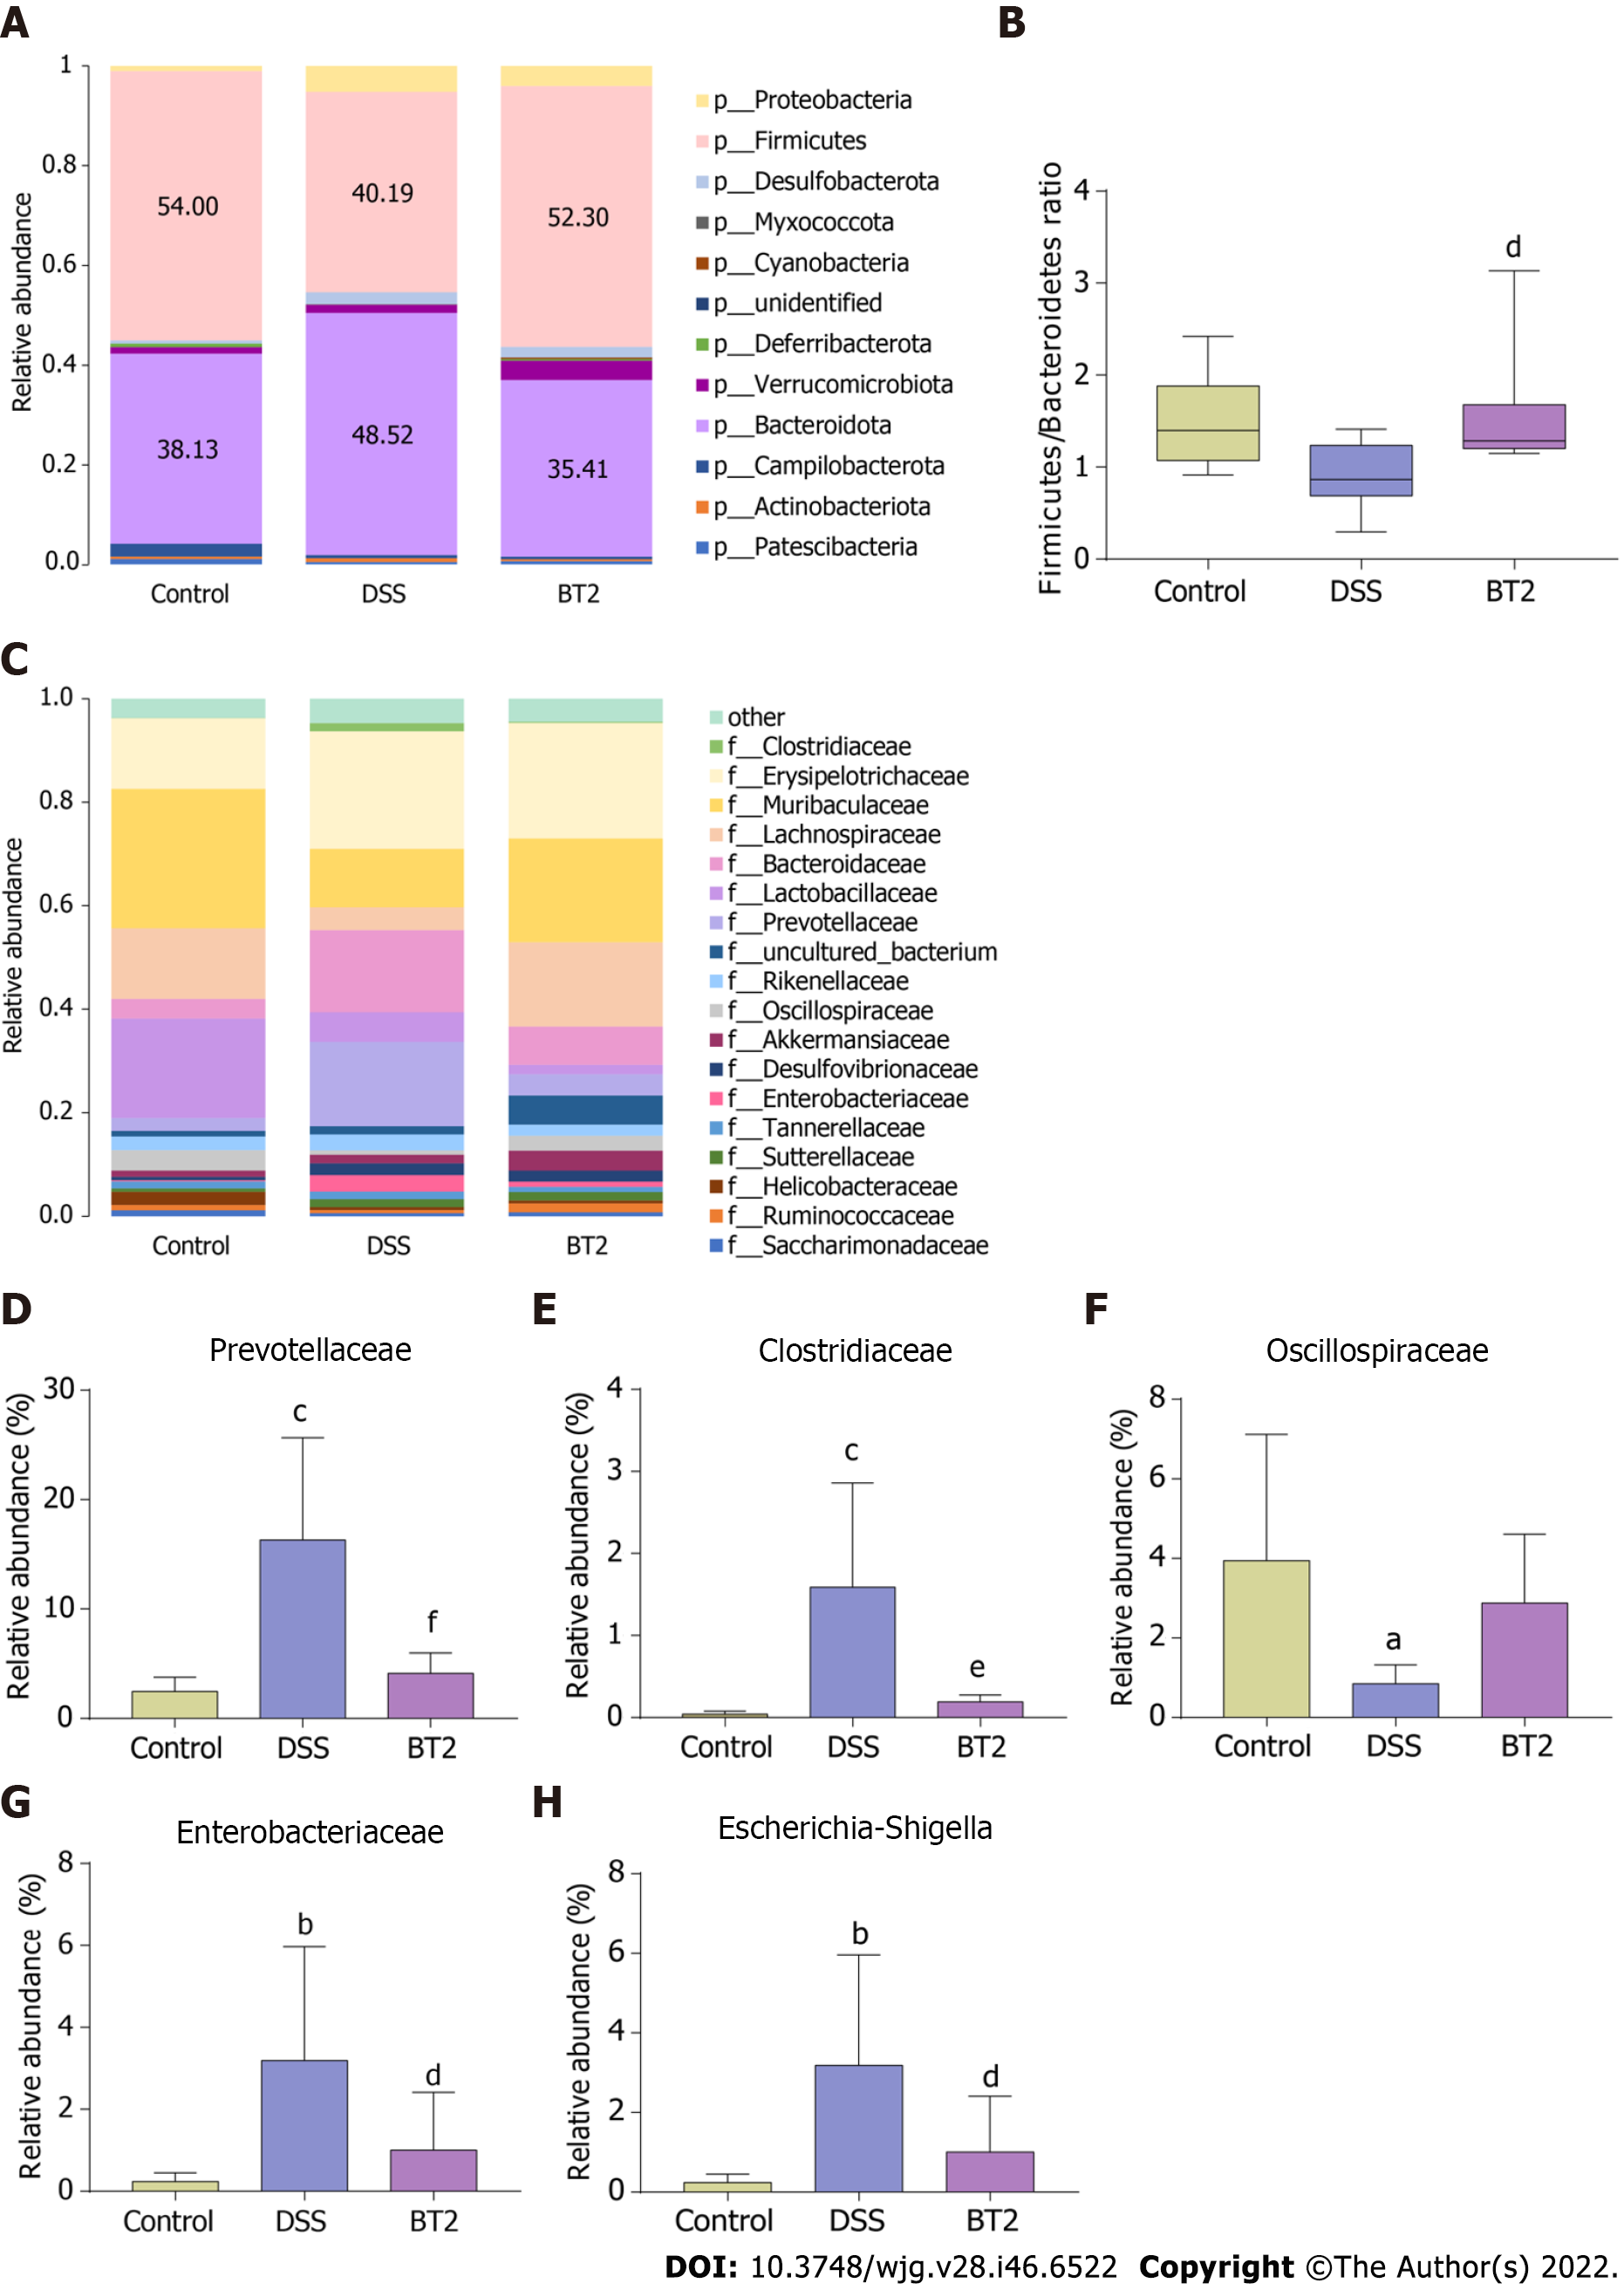
Figure 7 Effects of 3,6-dichlorobenzo[b]thiophene-2-carboxylic acid treatment on the species composition.
A: Taxonomic analysis at the phylum level; B: BT2 treatment alters the Firmicutes/Bacteroidetes value in each group; C: Taxonomic analysis at the family level; D: Abundance of Prevotellaceae; E: Abundance of Clostridiaceae; F: Abundance of Oscillospiraceae; G: Abundance of Enterobacteriaceae; H: Abundance of Escherichia-Shigella. dP < 0.05, eP < 0.01, and fP < 0.001 vs the DSS group; aP < 0.05, bP < 0.01, and cP < 0.001 vs the control group. The data are shown as the mean ± SD (n = 8). DSS: Dextran sodium sulfate; BT2: 3,6-dichlorobenzo[b]thiophene-2-carboxylic acid.
- Citation: He QZ, Wei P, Zhang JZ, Liu TT, Shi KQ, Liu HH, Zhang JW, Liu SJ. 3,6-dichlorobenzo[b]thiophene-2-carboxylic acid alleviates ulcerative colitis by suppressing mammalian target of rapamycin complex 1 activation and regulating intestinal microbiota. World J Gastroenterol 2022; 28(46): 6522-6536
- URL: https://www.wjgnet.com/1007-9327/full/v28/i46/6522.htm
- DOI: https://dx.doi.org/10.3748/wjg.v28.i46.6522


