Copyright
©The Author(s) 2022.
World J Gastroenterol. Dec 14, 2022; 28(46): 6512-6521
Published online Dec 14, 2022. doi: 10.3748/wjg.v28.i46.6512
Published online Dec 14, 2022. doi: 10.3748/wjg.v28.i46.6512
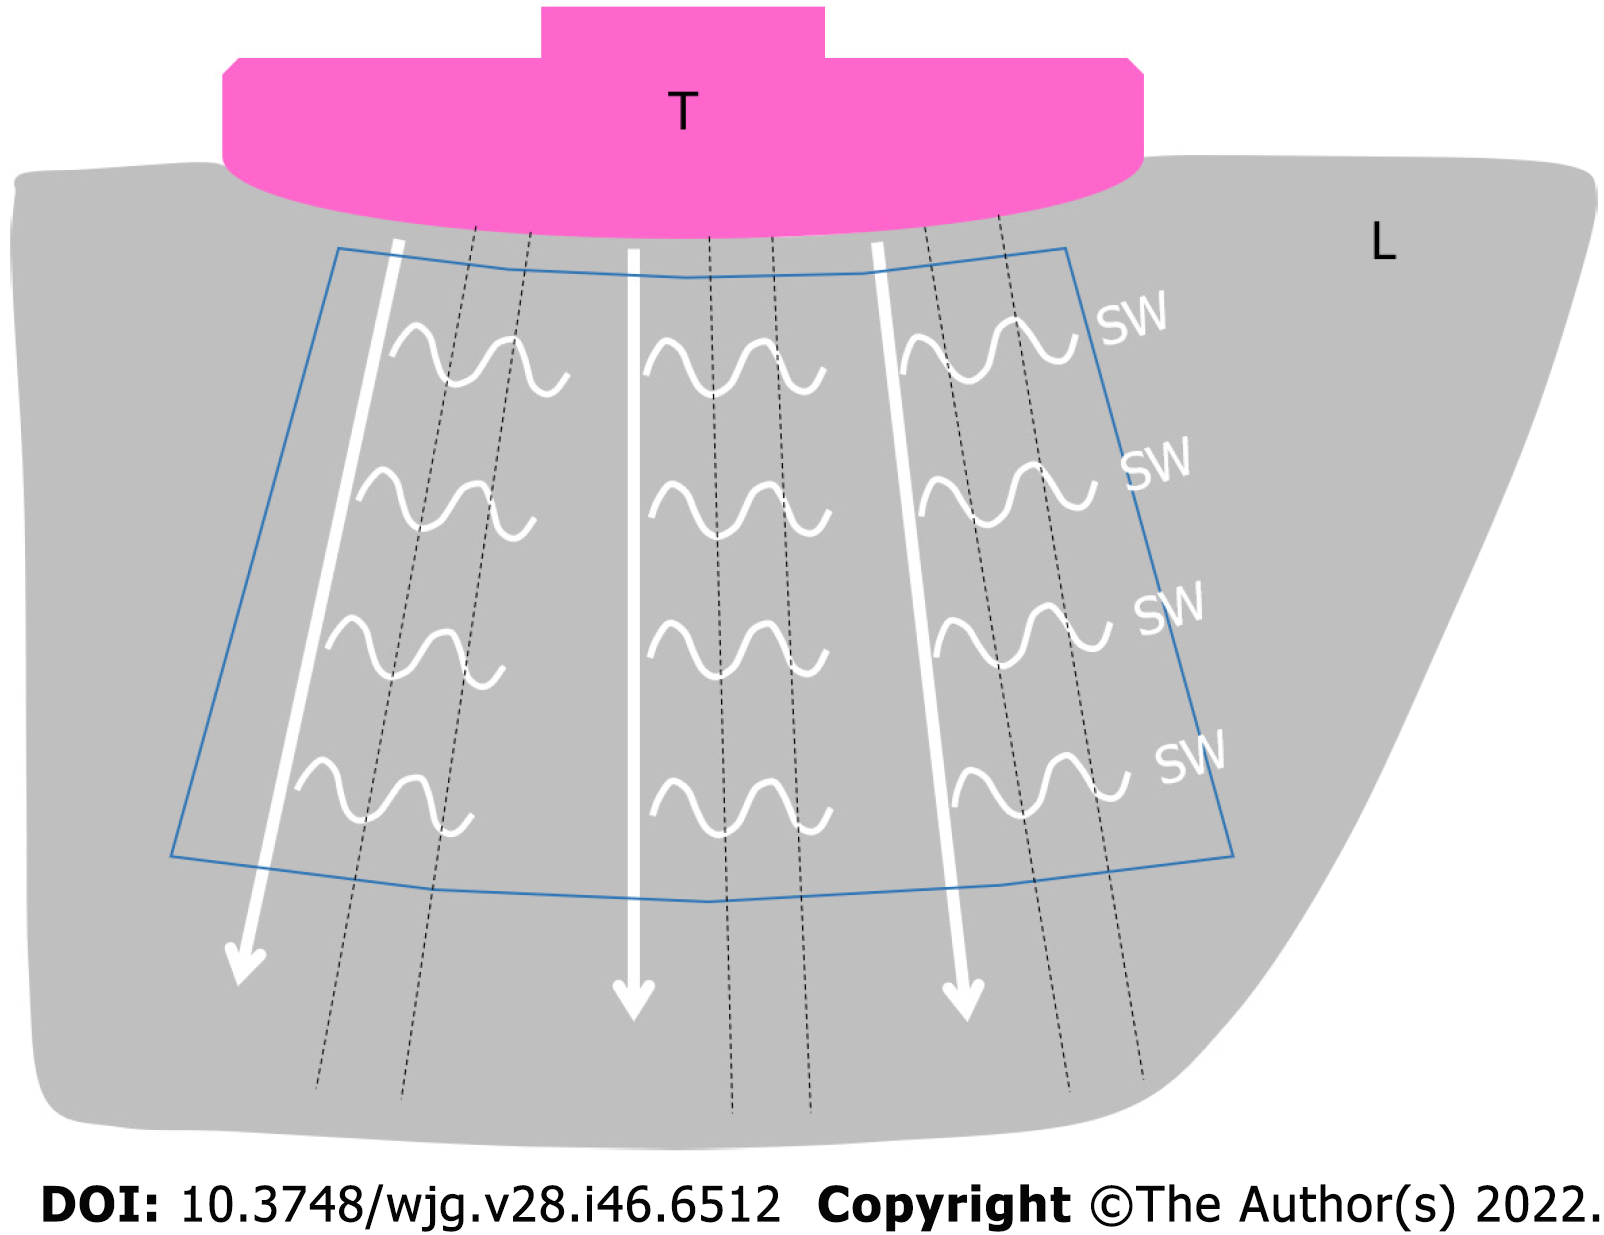
Figure 1 Schematic illustration of two-dimensional shear wave elastography (commonly referred to as two-dimensional shear wave elastography) in a healthy subject.
Multiple push-pulses (white arrow lines) radiate from the transducer to create shear waves (small wavy lines). The shear wave movements are tracked by the regular interval tracking conventional ultrasound pulses (black dotted lines). T: Transducer; L: Liver; SW: Shear wave. White arrow line: Push-pulse; Black dotted line: Tracking pulse; Blue line enclosure: Region of interest.
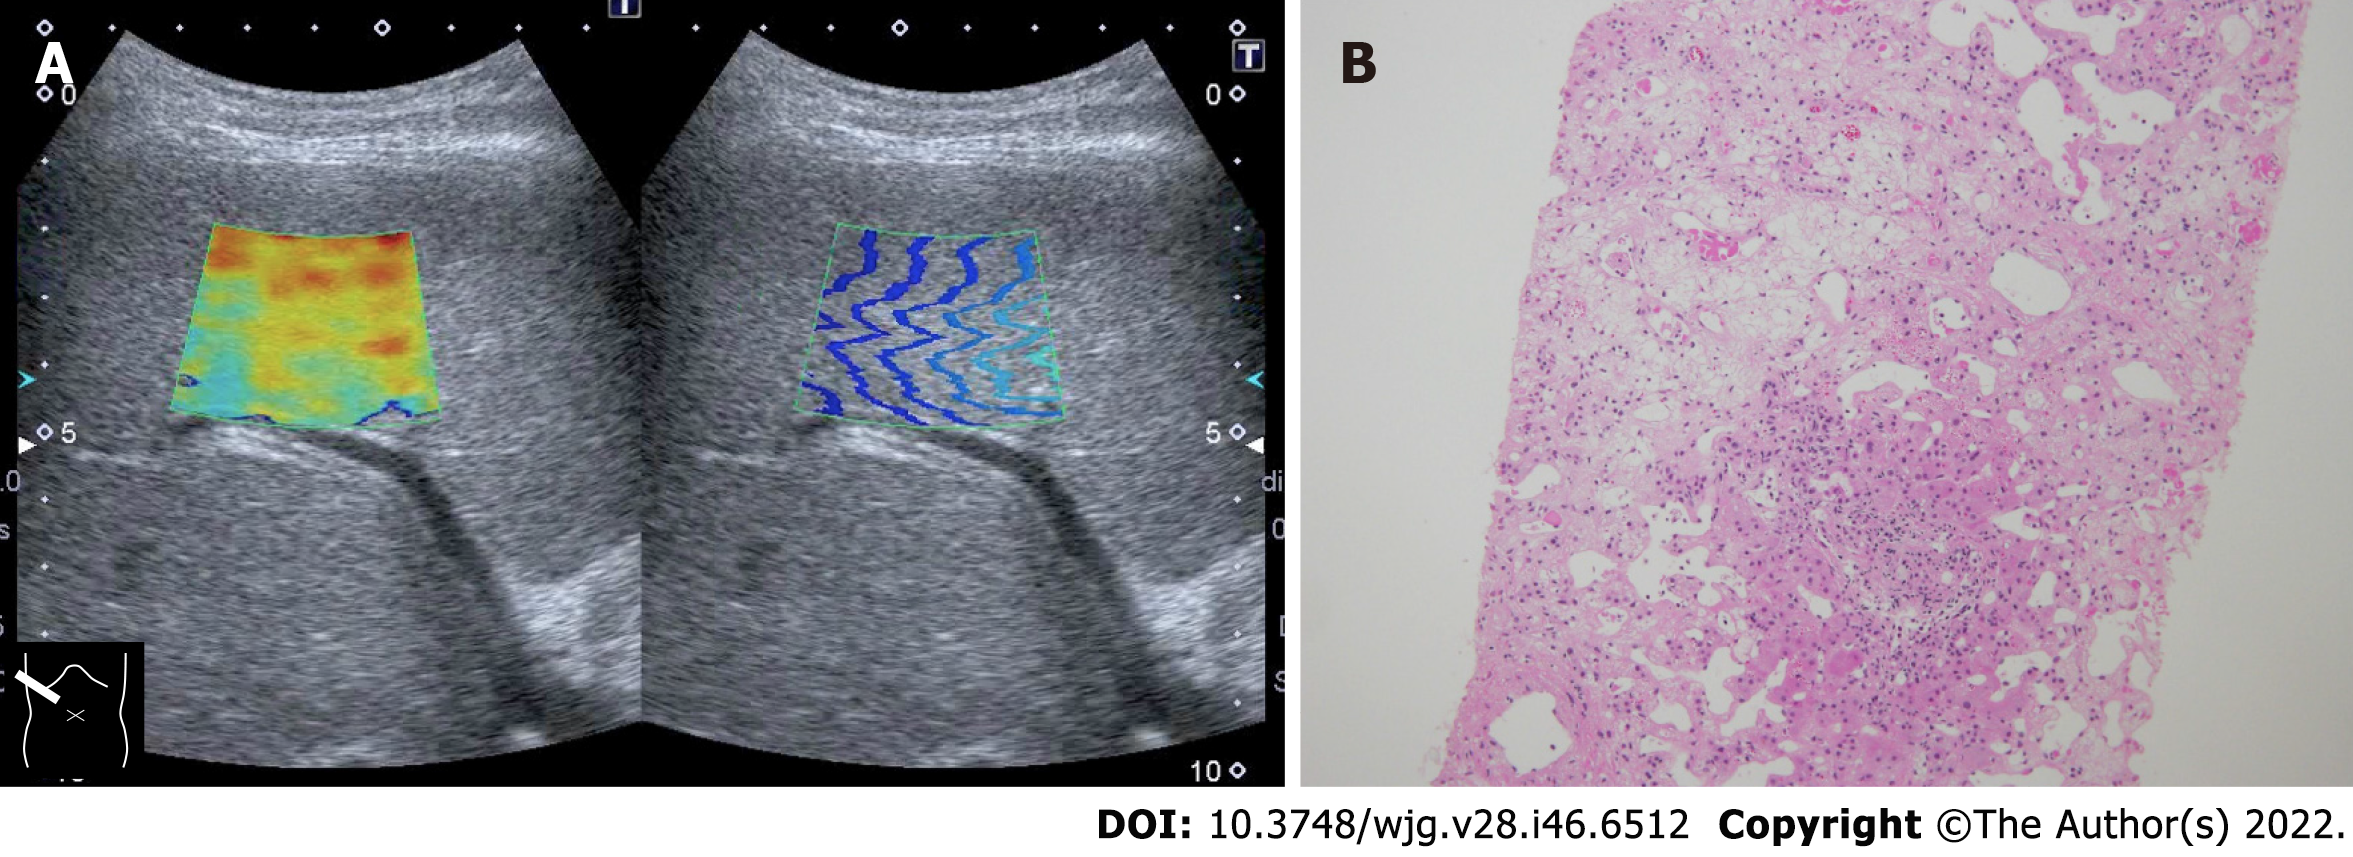
Figure 2 Representative case of massive hepatic necrosis.
A: Shear wave propagation velocity was 3.01 m/s (27.2 kPa); B: Biopsy specimen showed that hepatocytes in the central venous zone were completely lost due to necrosis and were replaced by reticular fibers. Hepatocytes remained in the portal vein area, which was one-half to one-third of the total, indicating sub extensive hepatic necrosis. Hematoxylin-eosin staining histologic finding (× 20).
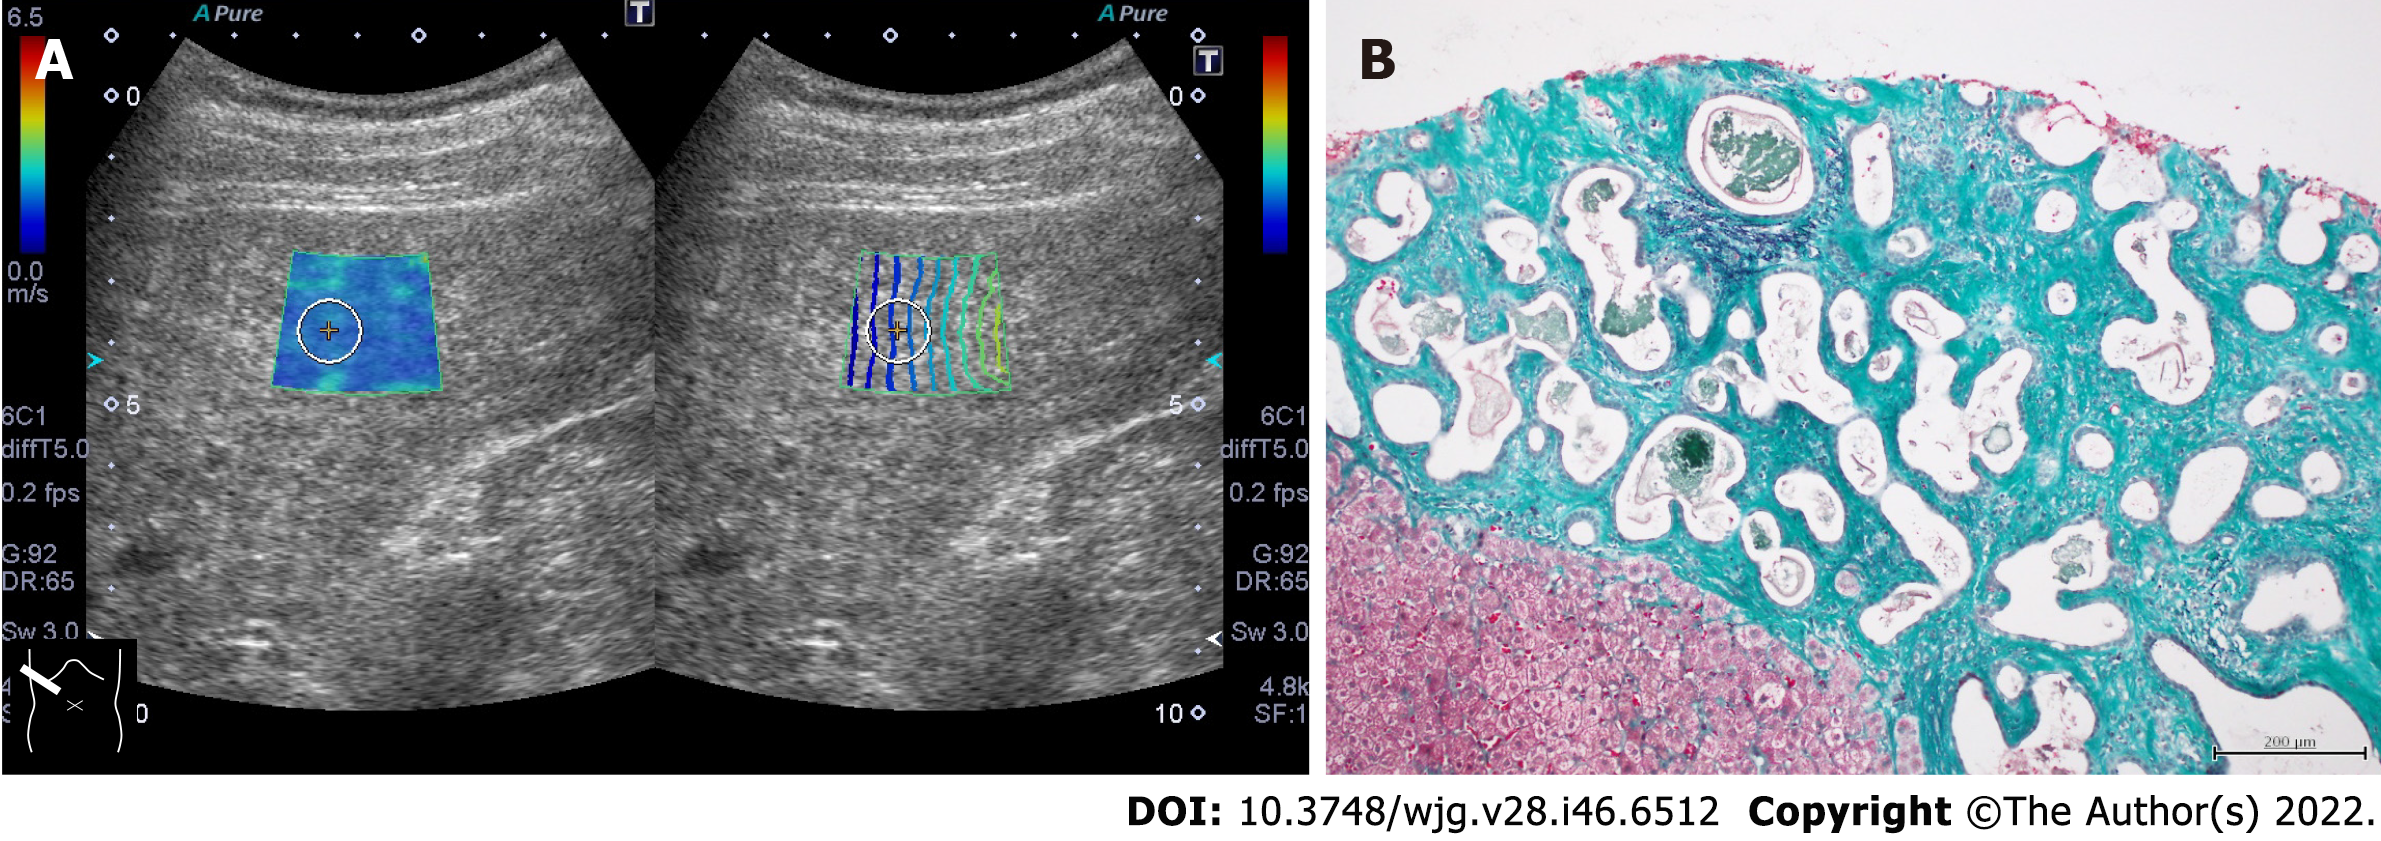
Figure 3 Representative case of von Meyenburg complex.
A: The liver showed a coarse parenchymal texture on ultrasound, and its shear wave propagation velocity was 1.86 m/s (10.3 kPa); B: Ultrasound-guided liver biopsy revealed bile duct proliferation with irregularly dilated small nuclei at the margins and fibrous stroma around the ducts. The fibrous stroma stained green on elastic Masson staining and was confirmed to be vitreous, confirming the diagnosis of von Meyenburg complex (ElasticaMasson staining, × 20).
Figure 4 Representative case of hereditary hemorrhagic telangiectasia.
A: The liver included many vascular shunts, and intrahepatic vessels were dilatated; B: The hepatic shear wave propagation velocity was 1.88 m/s (10.6 kPa).
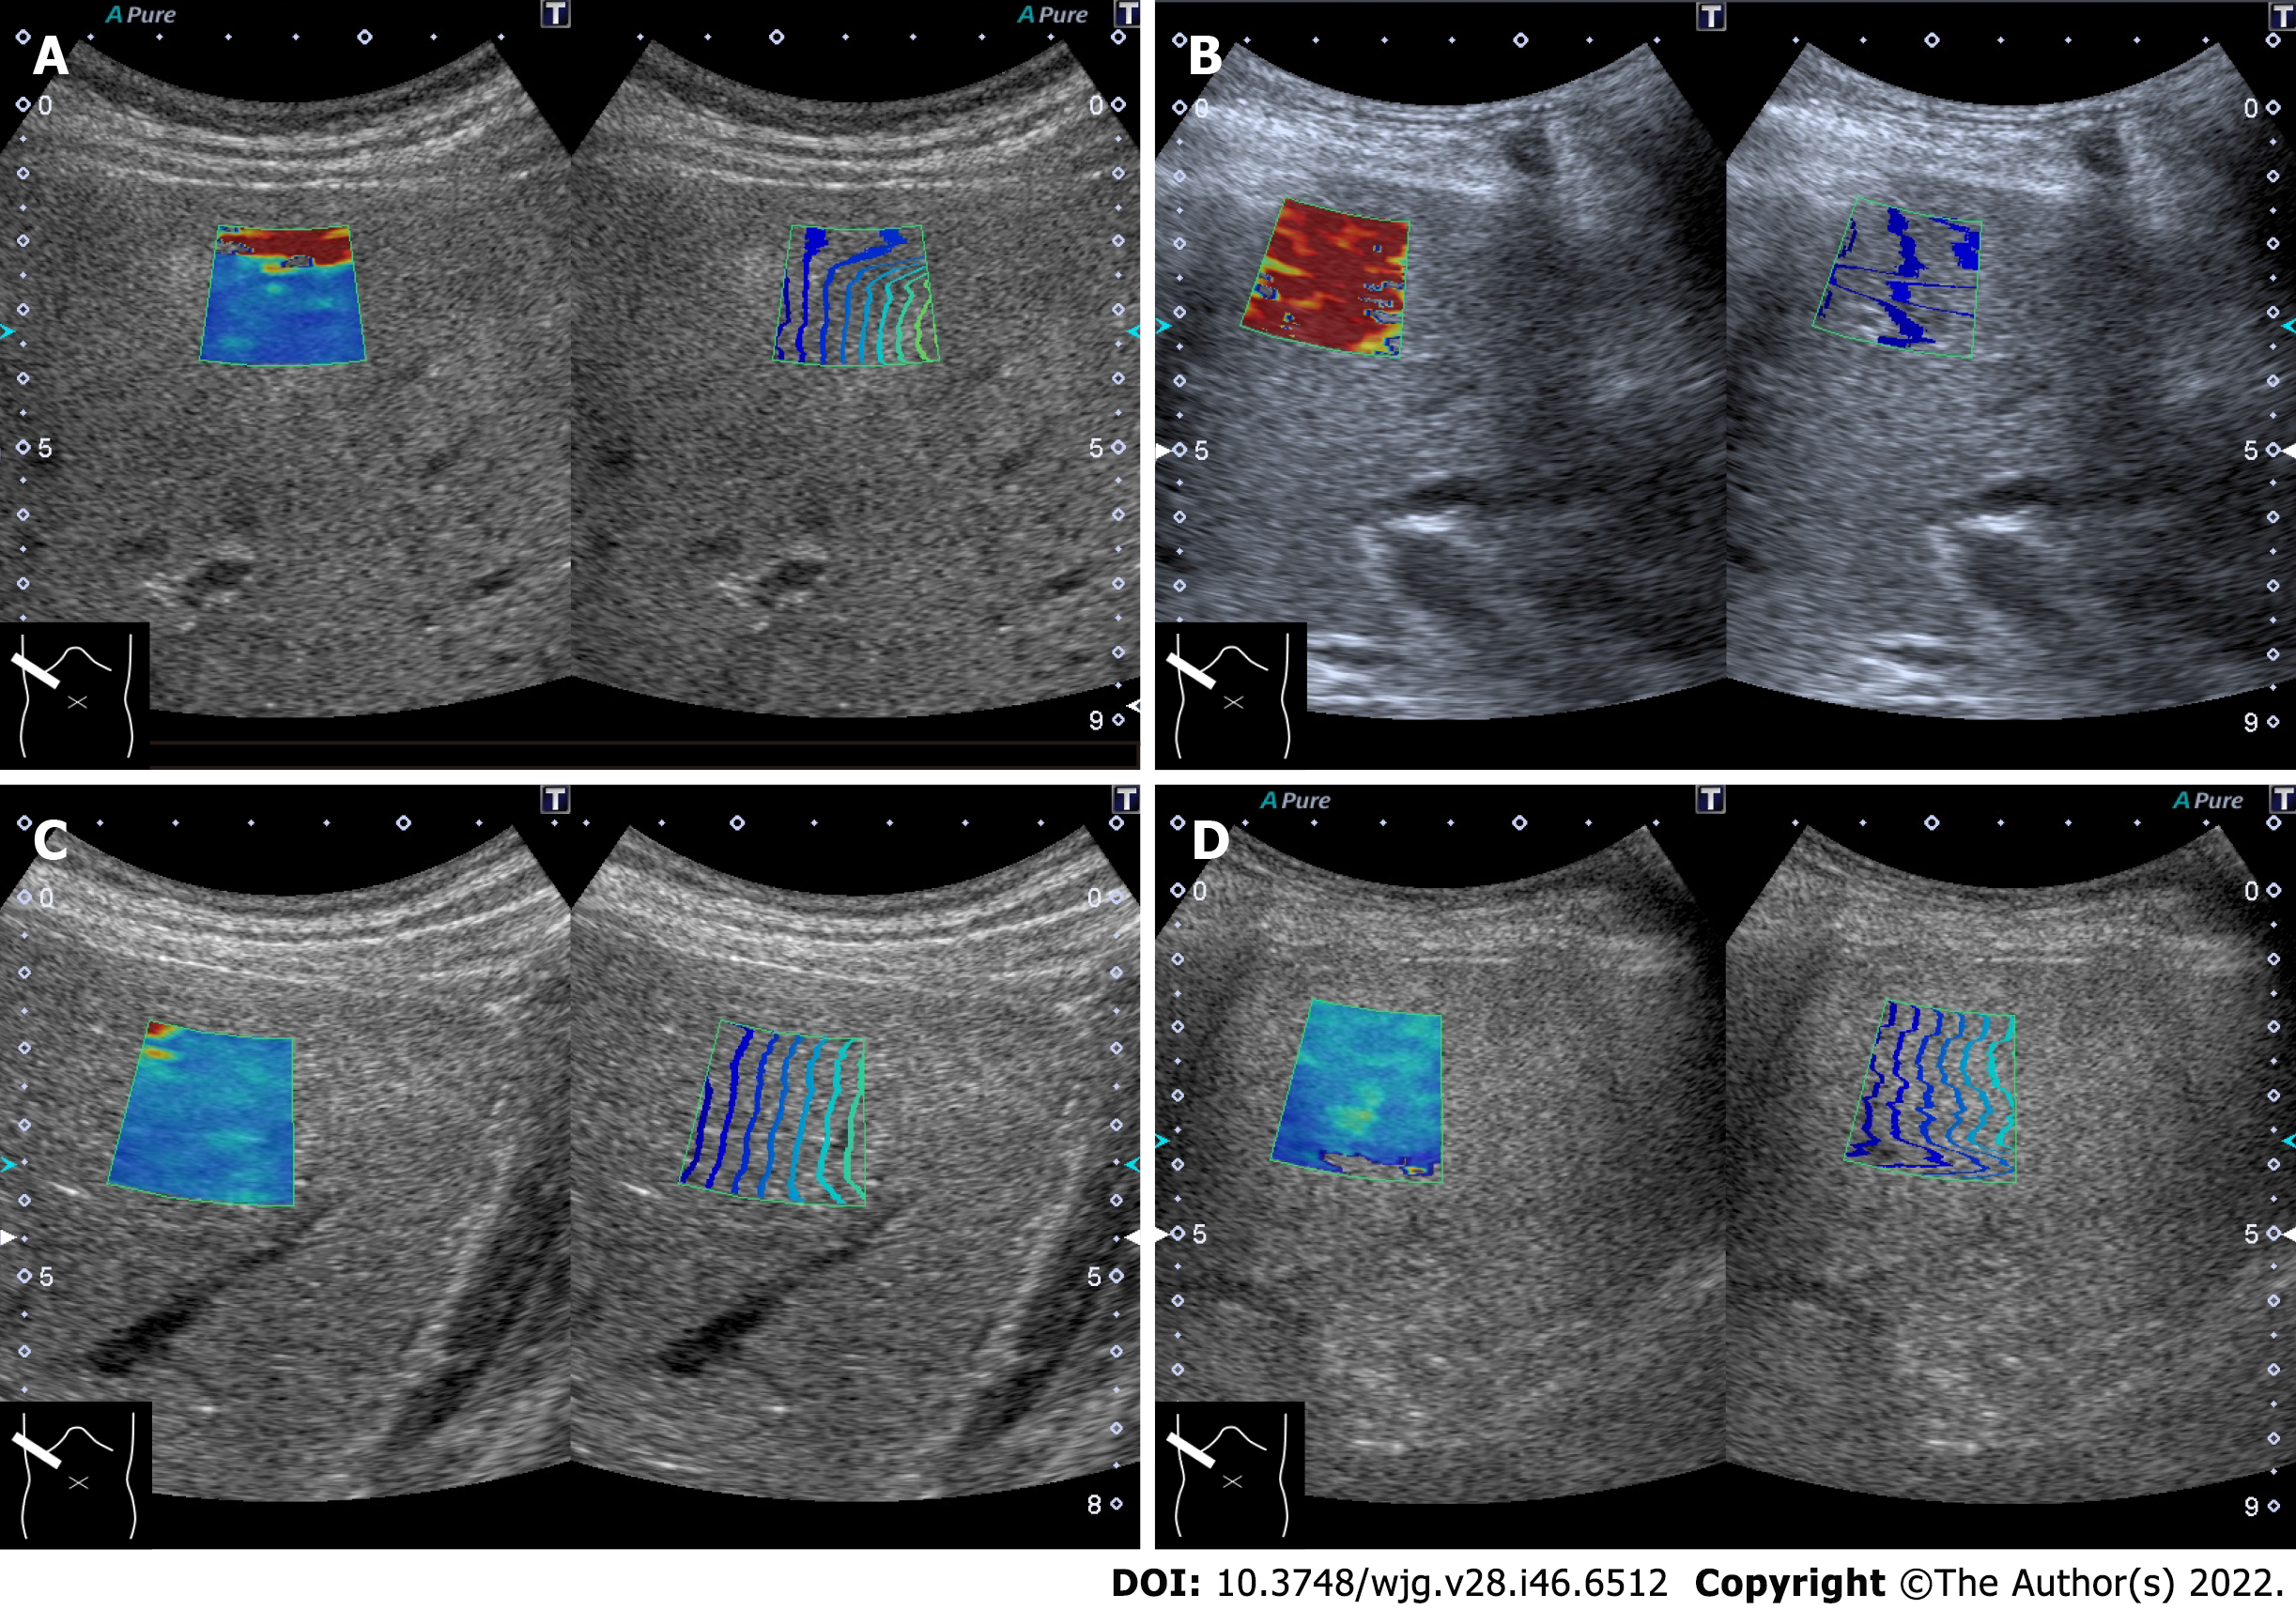
Figure 5 Artifactual pseudo-increase of shear wave propagation velocity.
A: Reverberation of push-pulse; B: Motion artifact; C: Excessive probe compression (1.86 m/s, 10.3 kPa); D: Shear wave elastography image of fatty liver (2.10 m/s, 13.2 kPa).
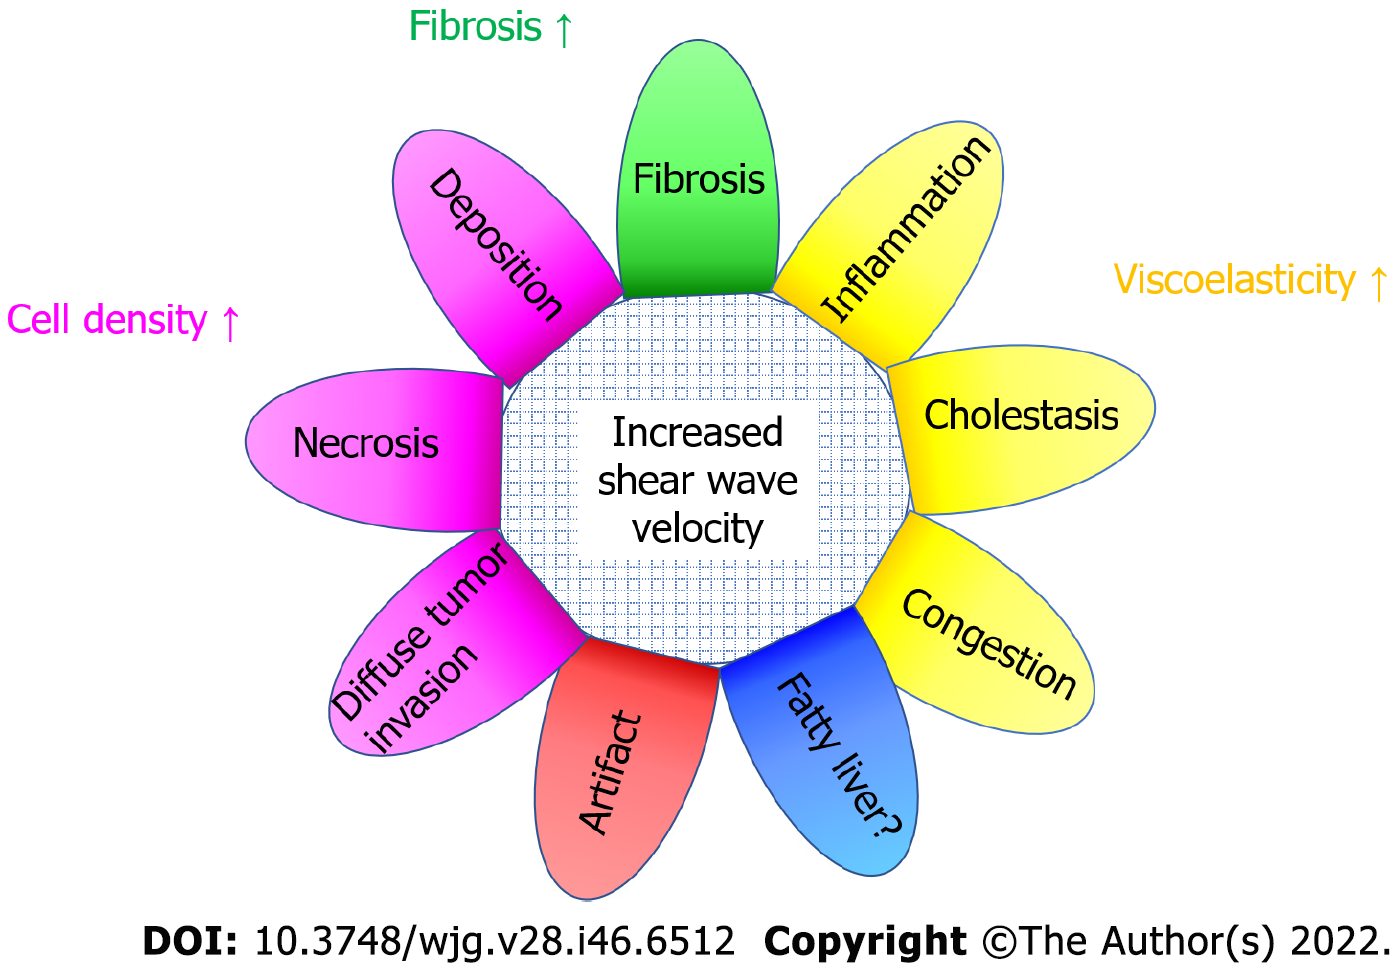
Figure 6 Summary of confounding factors that increase shear wave propagation velocity.
- Citation: Naganuma H, Ishida H. Factors other than fibrosis that increase measured shear wave velocity. World J Gastroenterol 2022; 28(46): 6512-6521
- URL: https://www.wjgnet.com/1007-9327/full/v28/i46/6512.htm
- DOI: https://dx.doi.org/10.3748/wjg.v28.i46.6512


