Copyright
©The Author(s) 2022.
World J Gastroenterol. Nov 21, 2022; 28(43): 6131-6156
Published online Nov 21, 2022. doi: 10.3748/wjg.v28.i43.6131
Published online Nov 21, 2022. doi: 10.3748/wjg.v28.i43.6131
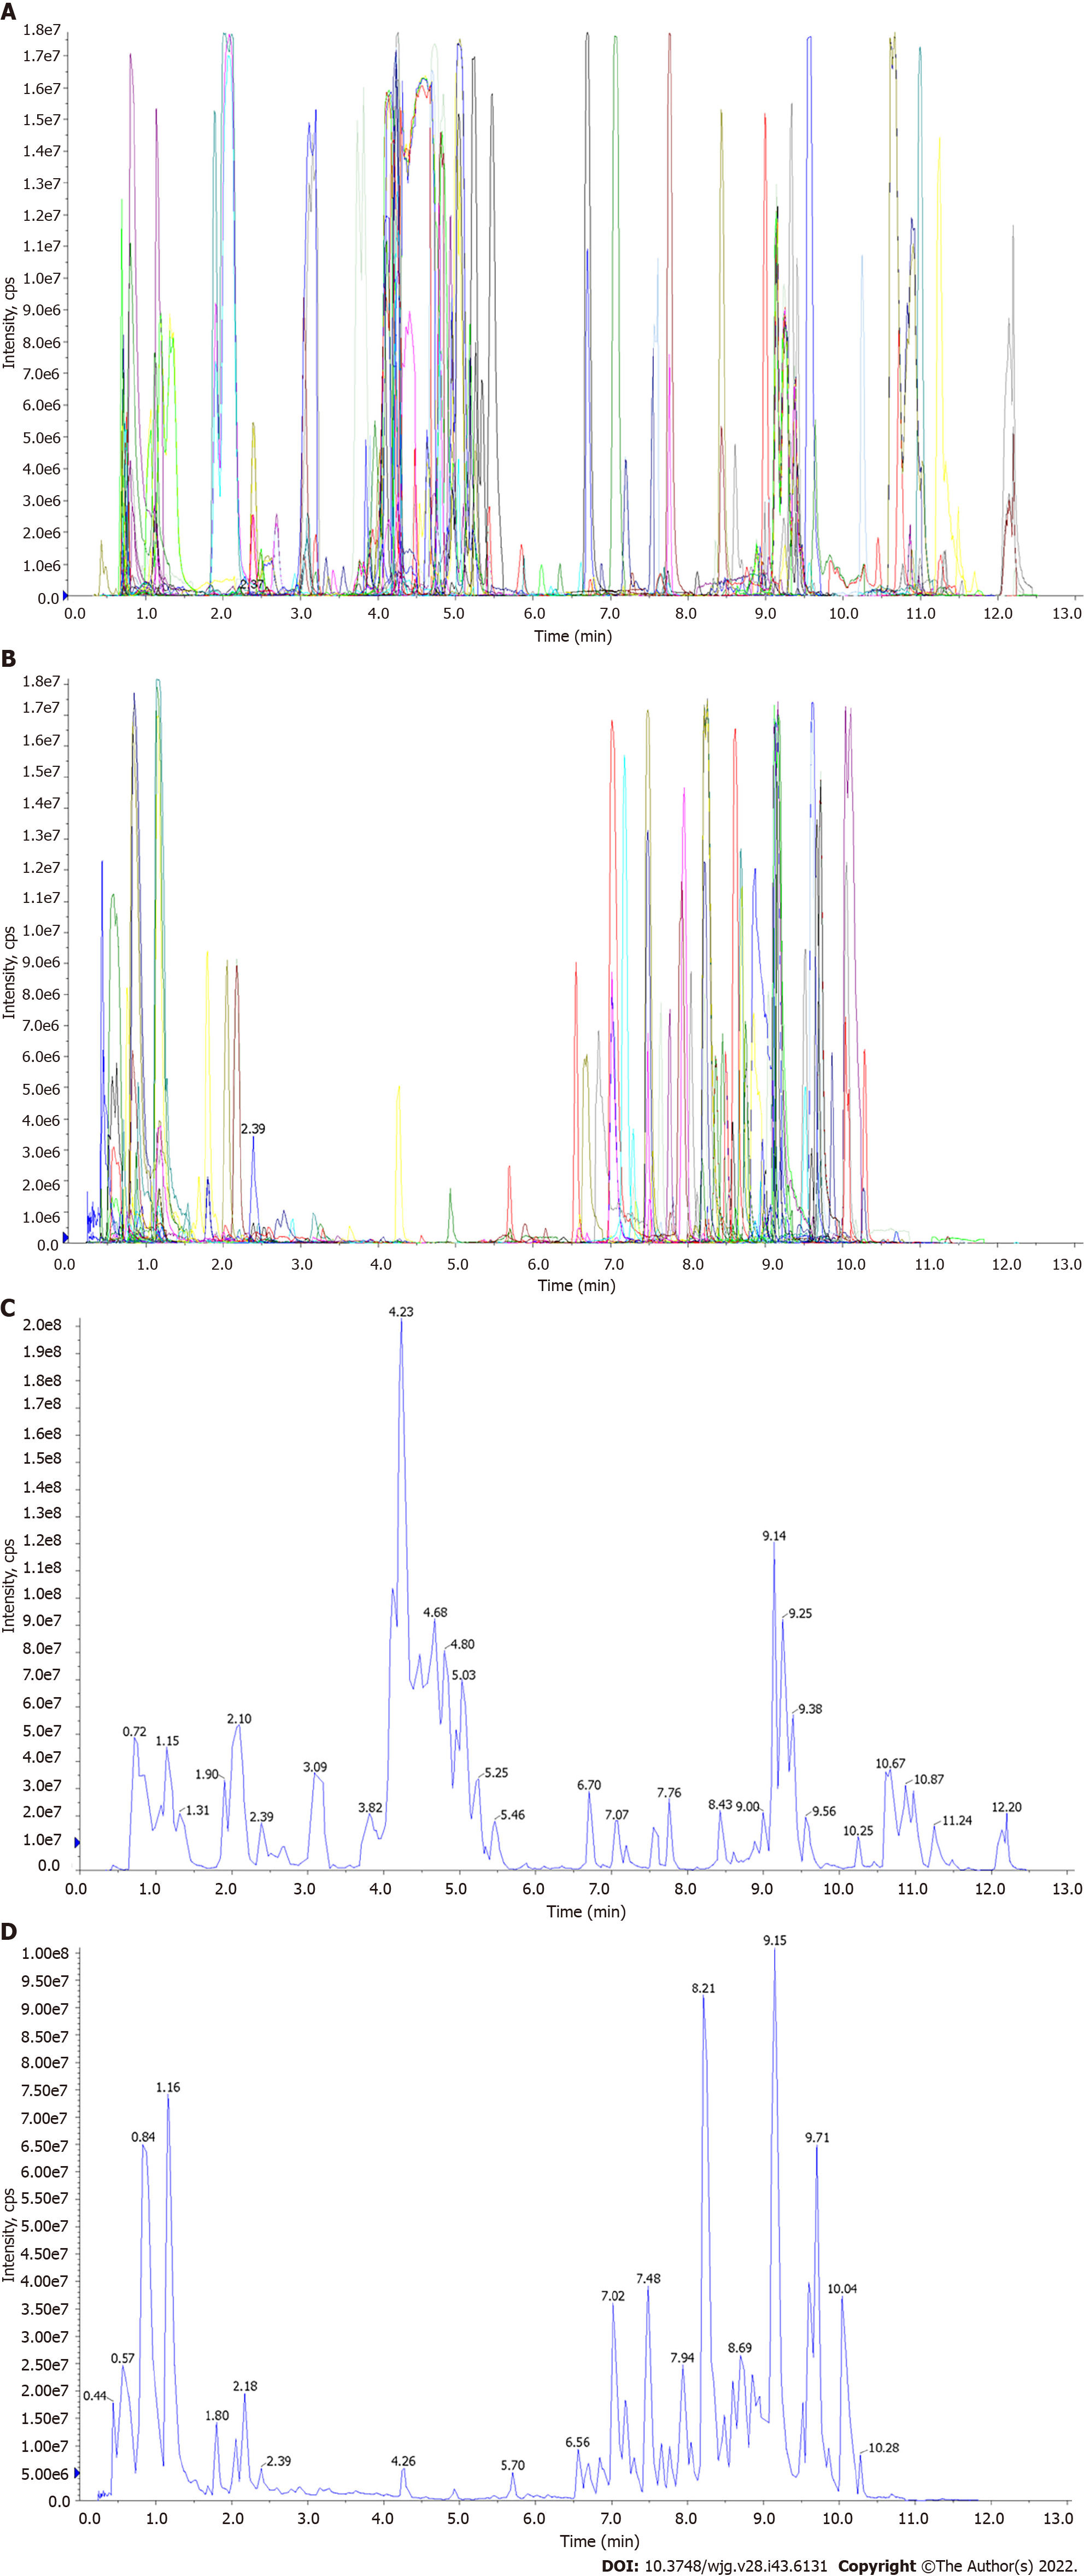
Figure 1 UPLC-MS/MS analysis of Salvia miltiorrhiza extract.
A: Total ions Current-N of QC_MS; B: Total ions Current-P of QC_MS; C: MRM detection of multimodal maps-N; D: MRM detection of multimodal maps-P.
Figure 2 In vivo experiment scheme.
Sal: Salvia miltiorrhiza.
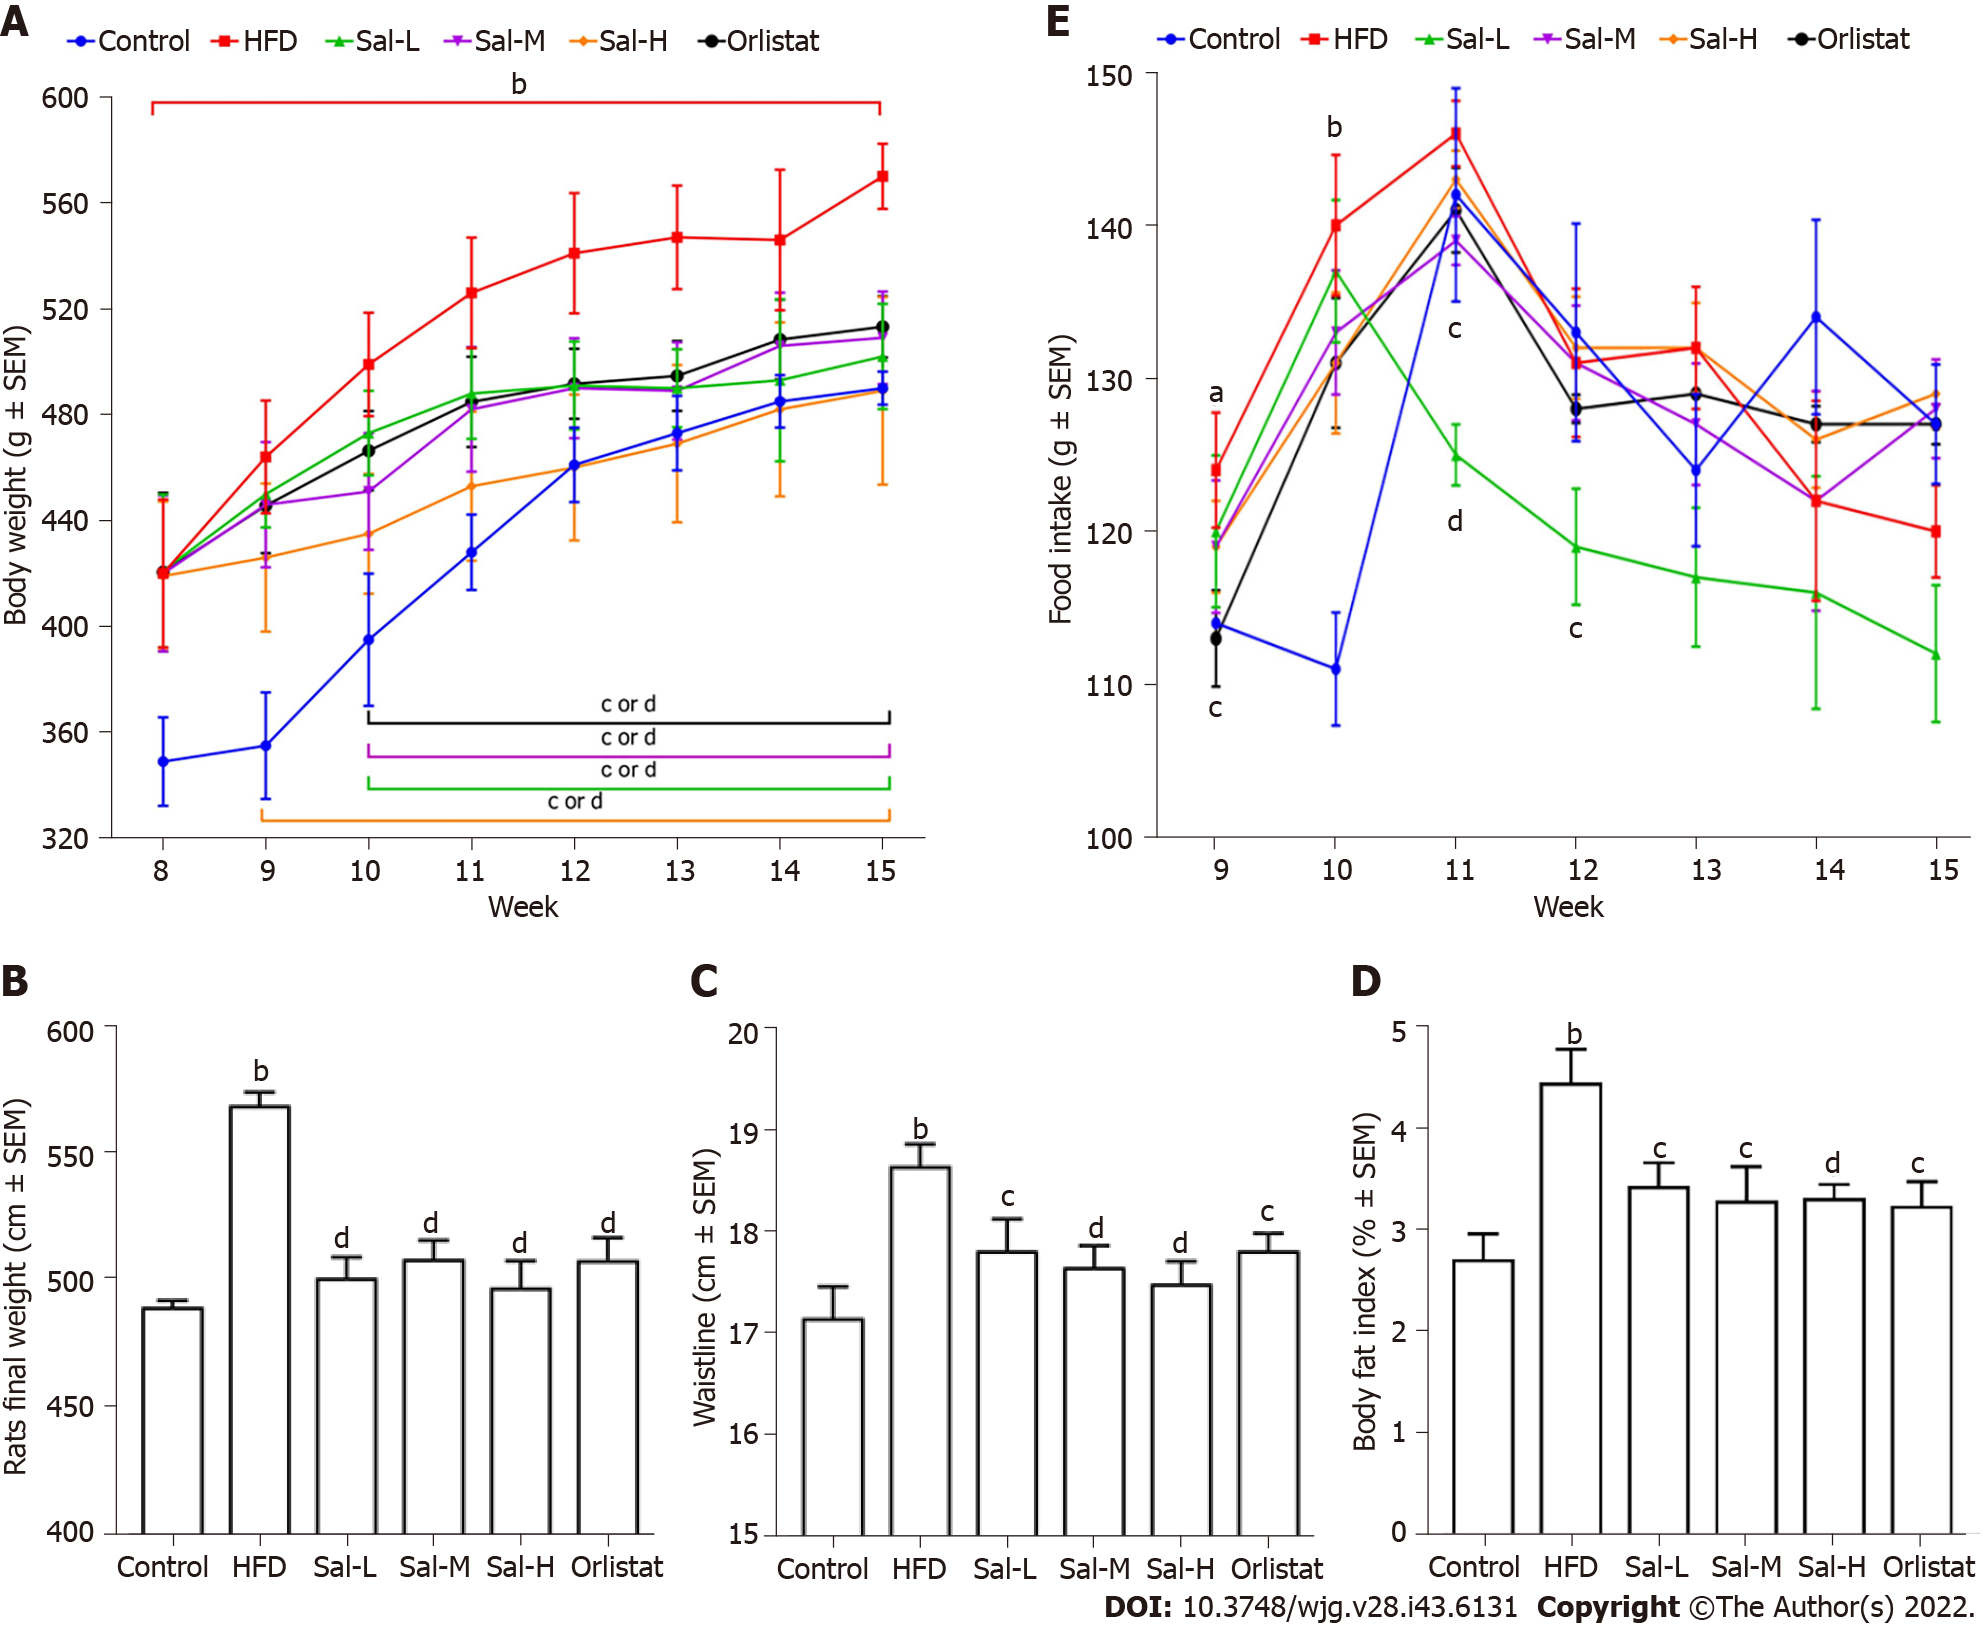
Figure 3 Therapeutic evaluation of Salvia miltiorrhiza in ameliorating high-fat diet-induced obesity in rats.
A: Body weight change; B: Final weight; C: Waistline; D: Body fat index; E: Food intake. Values are expressed as the mean ± SE and analyzed by one-way ANOVA followed by Duncan’s multiple comparison test, n = 8. HFD: High-fat diet. aP < 0.05, bP < 0.01 vs control group; cP < 0.05, dP < 0.01 vs HFD group.
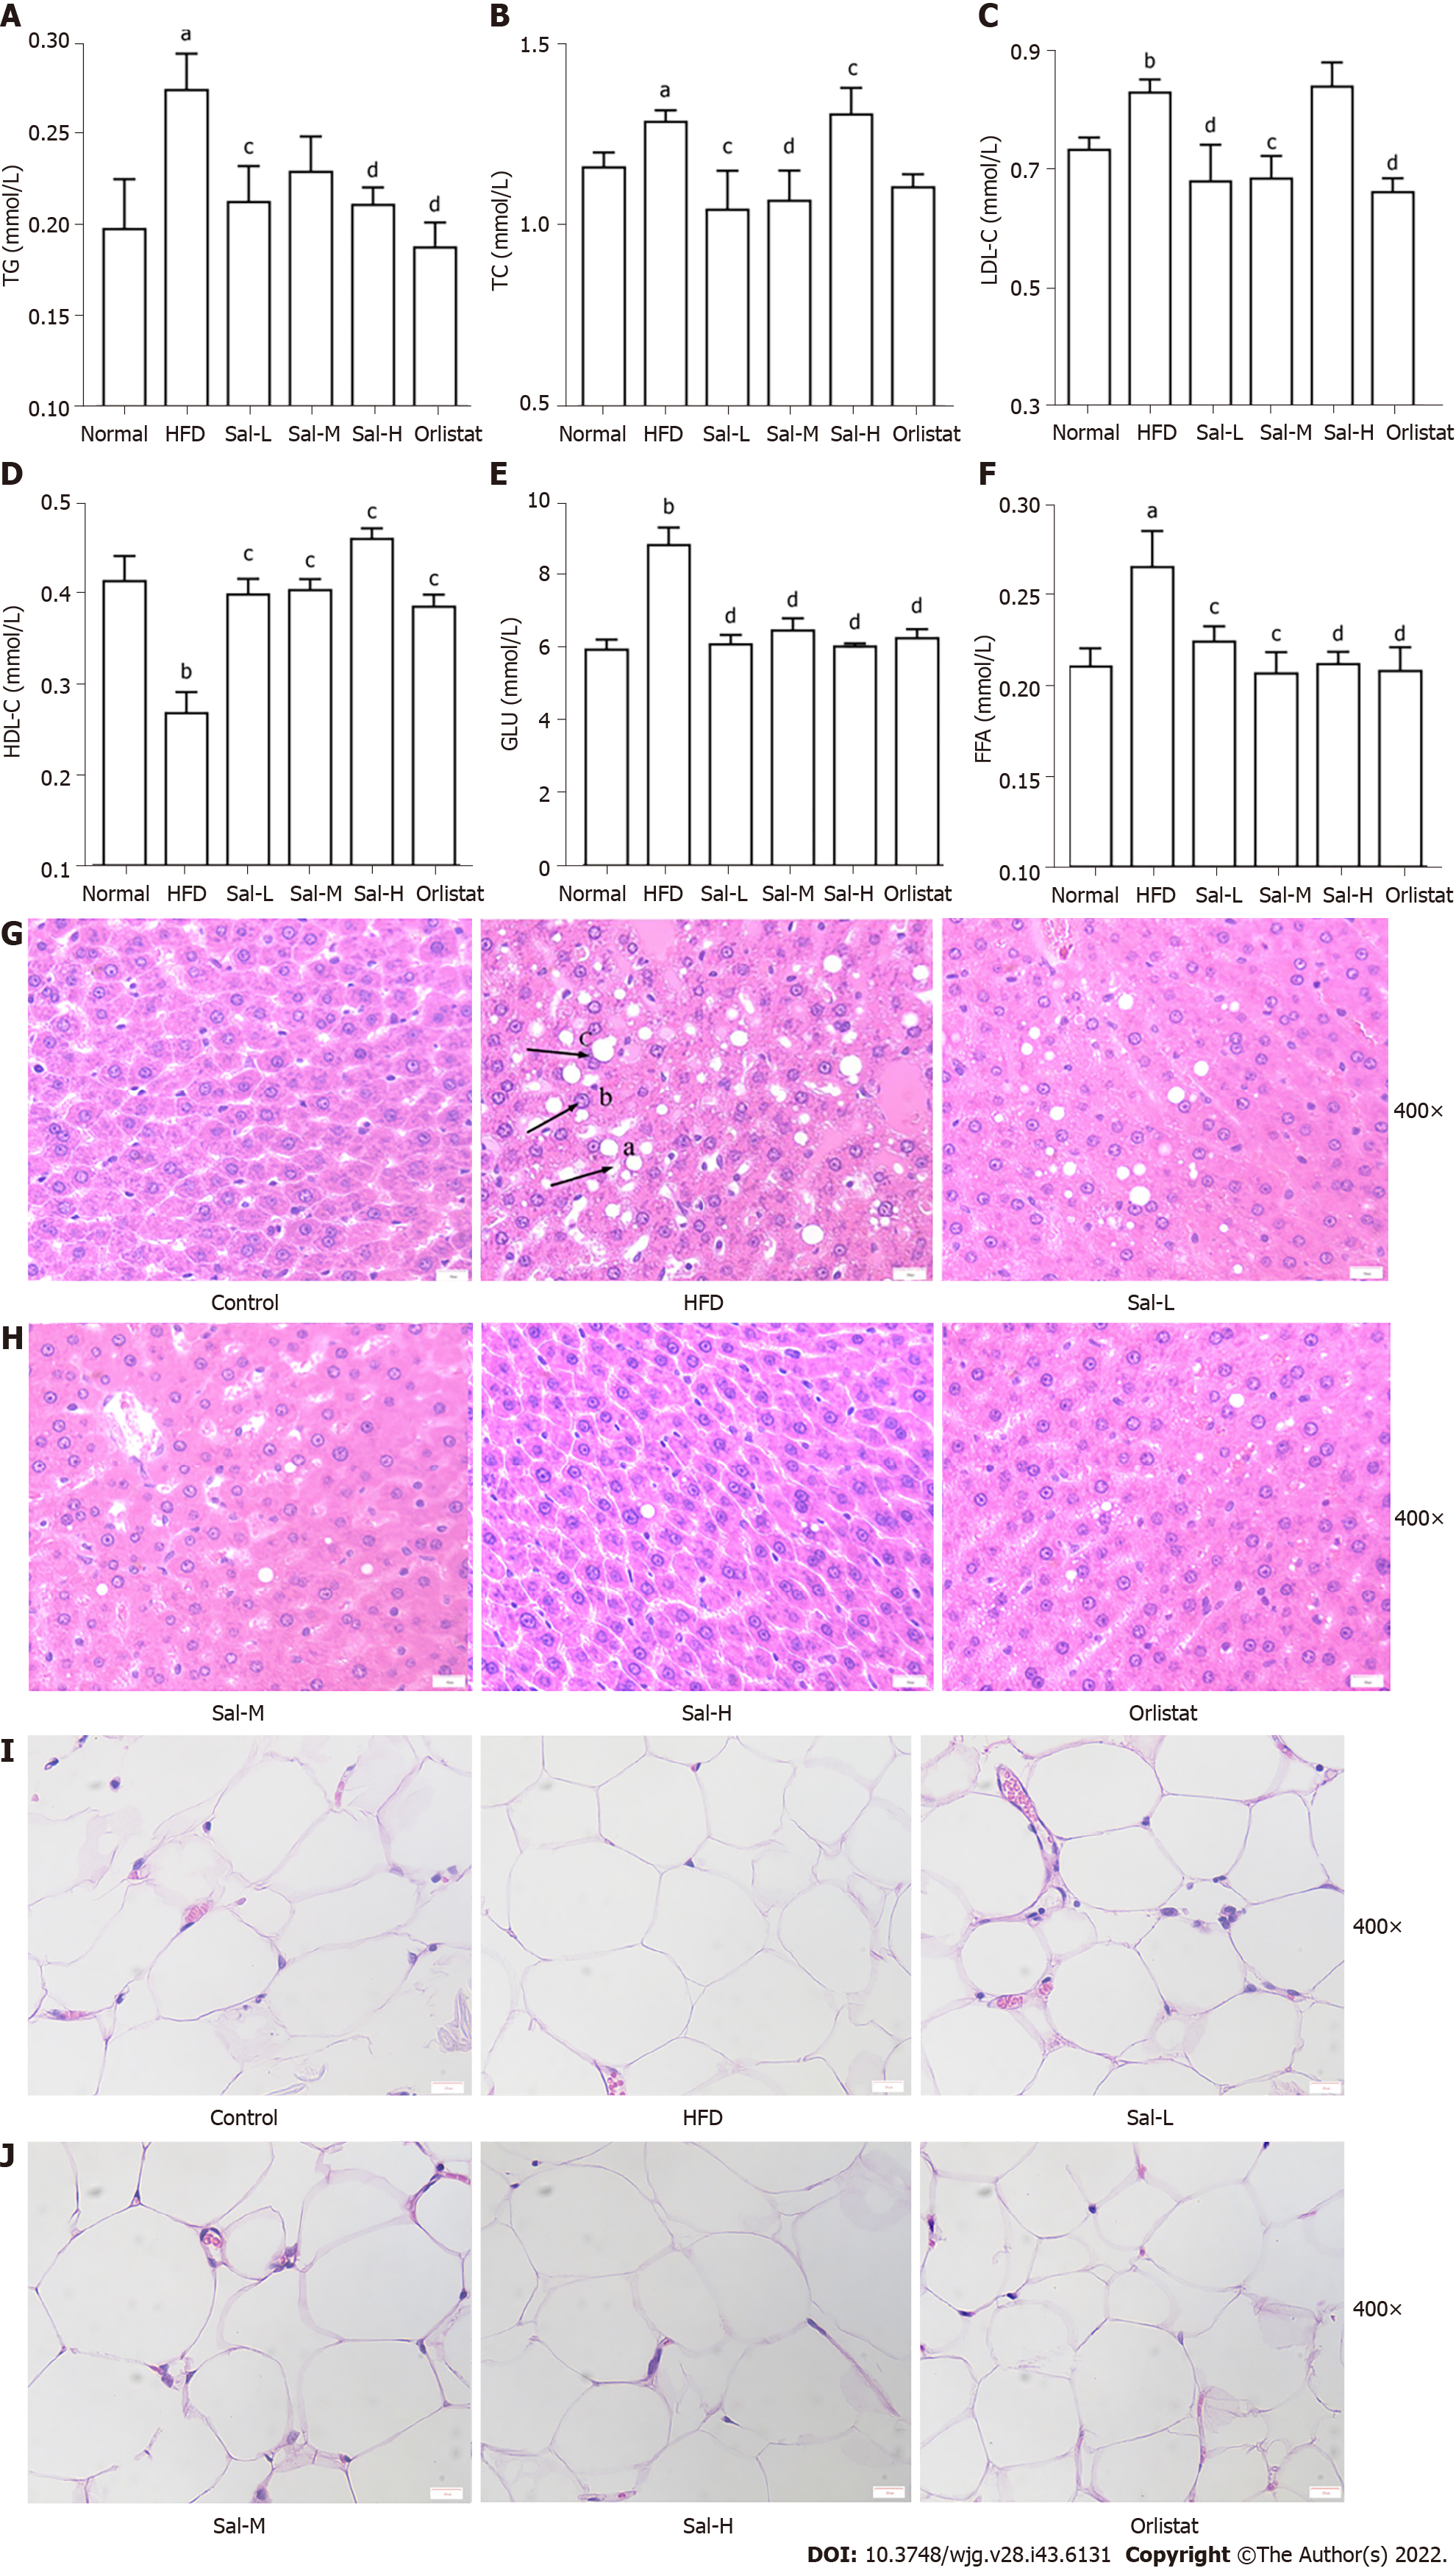
Figure 4 Effects of Salvia miltiorrhiza on serum lipid profiles, glucose, free fatty acid levels, and histopathological changes of the liver and adipose tissue in HFD-fed rats.
A-D: Serum triglyceride, total cholesterol, low-density lipoprotein, and high-density lipoprotein levels; E: Serum glucose level; F: Serum free fatty acid level; G and H: Representative images of hematoxylin-and eosin-stained (H&E) sections of liver tissue (400 ×) in the six groups (a: Lipid droplet accumulation; b: Punctate necrosis of hepatocytes with inflammatory cell infiltration; c: Balloon-like changes) (Scale bars: 20 µm); I and J: Representative images of H&E sections of adipose tissue (400 ×) in the six groups (Scale bars: 20 µm). Significance between groups was calculated using one-way ANOVA followed by Duncan’s multiple comparison test. Data are shown as the mean ± SE. aP < 0.05, bP < 0.01 vs control group; cP < 0.05, dP < 0.01 vs HFD group. Error bars represent standard error.
Figure 5 Levels of cAMP in liver tissue and HSL and PKA in adipose tissue of high-fat diet-fed rats.
A: cAMP; B: PKA; C: HSL. Data are presented as the mean ± SE (n = 8). HFD: High-fat diet. aP < 0.05, bP < 0.01 vs control group; cP < 0.05, dP < 0.01 vs HFD group.
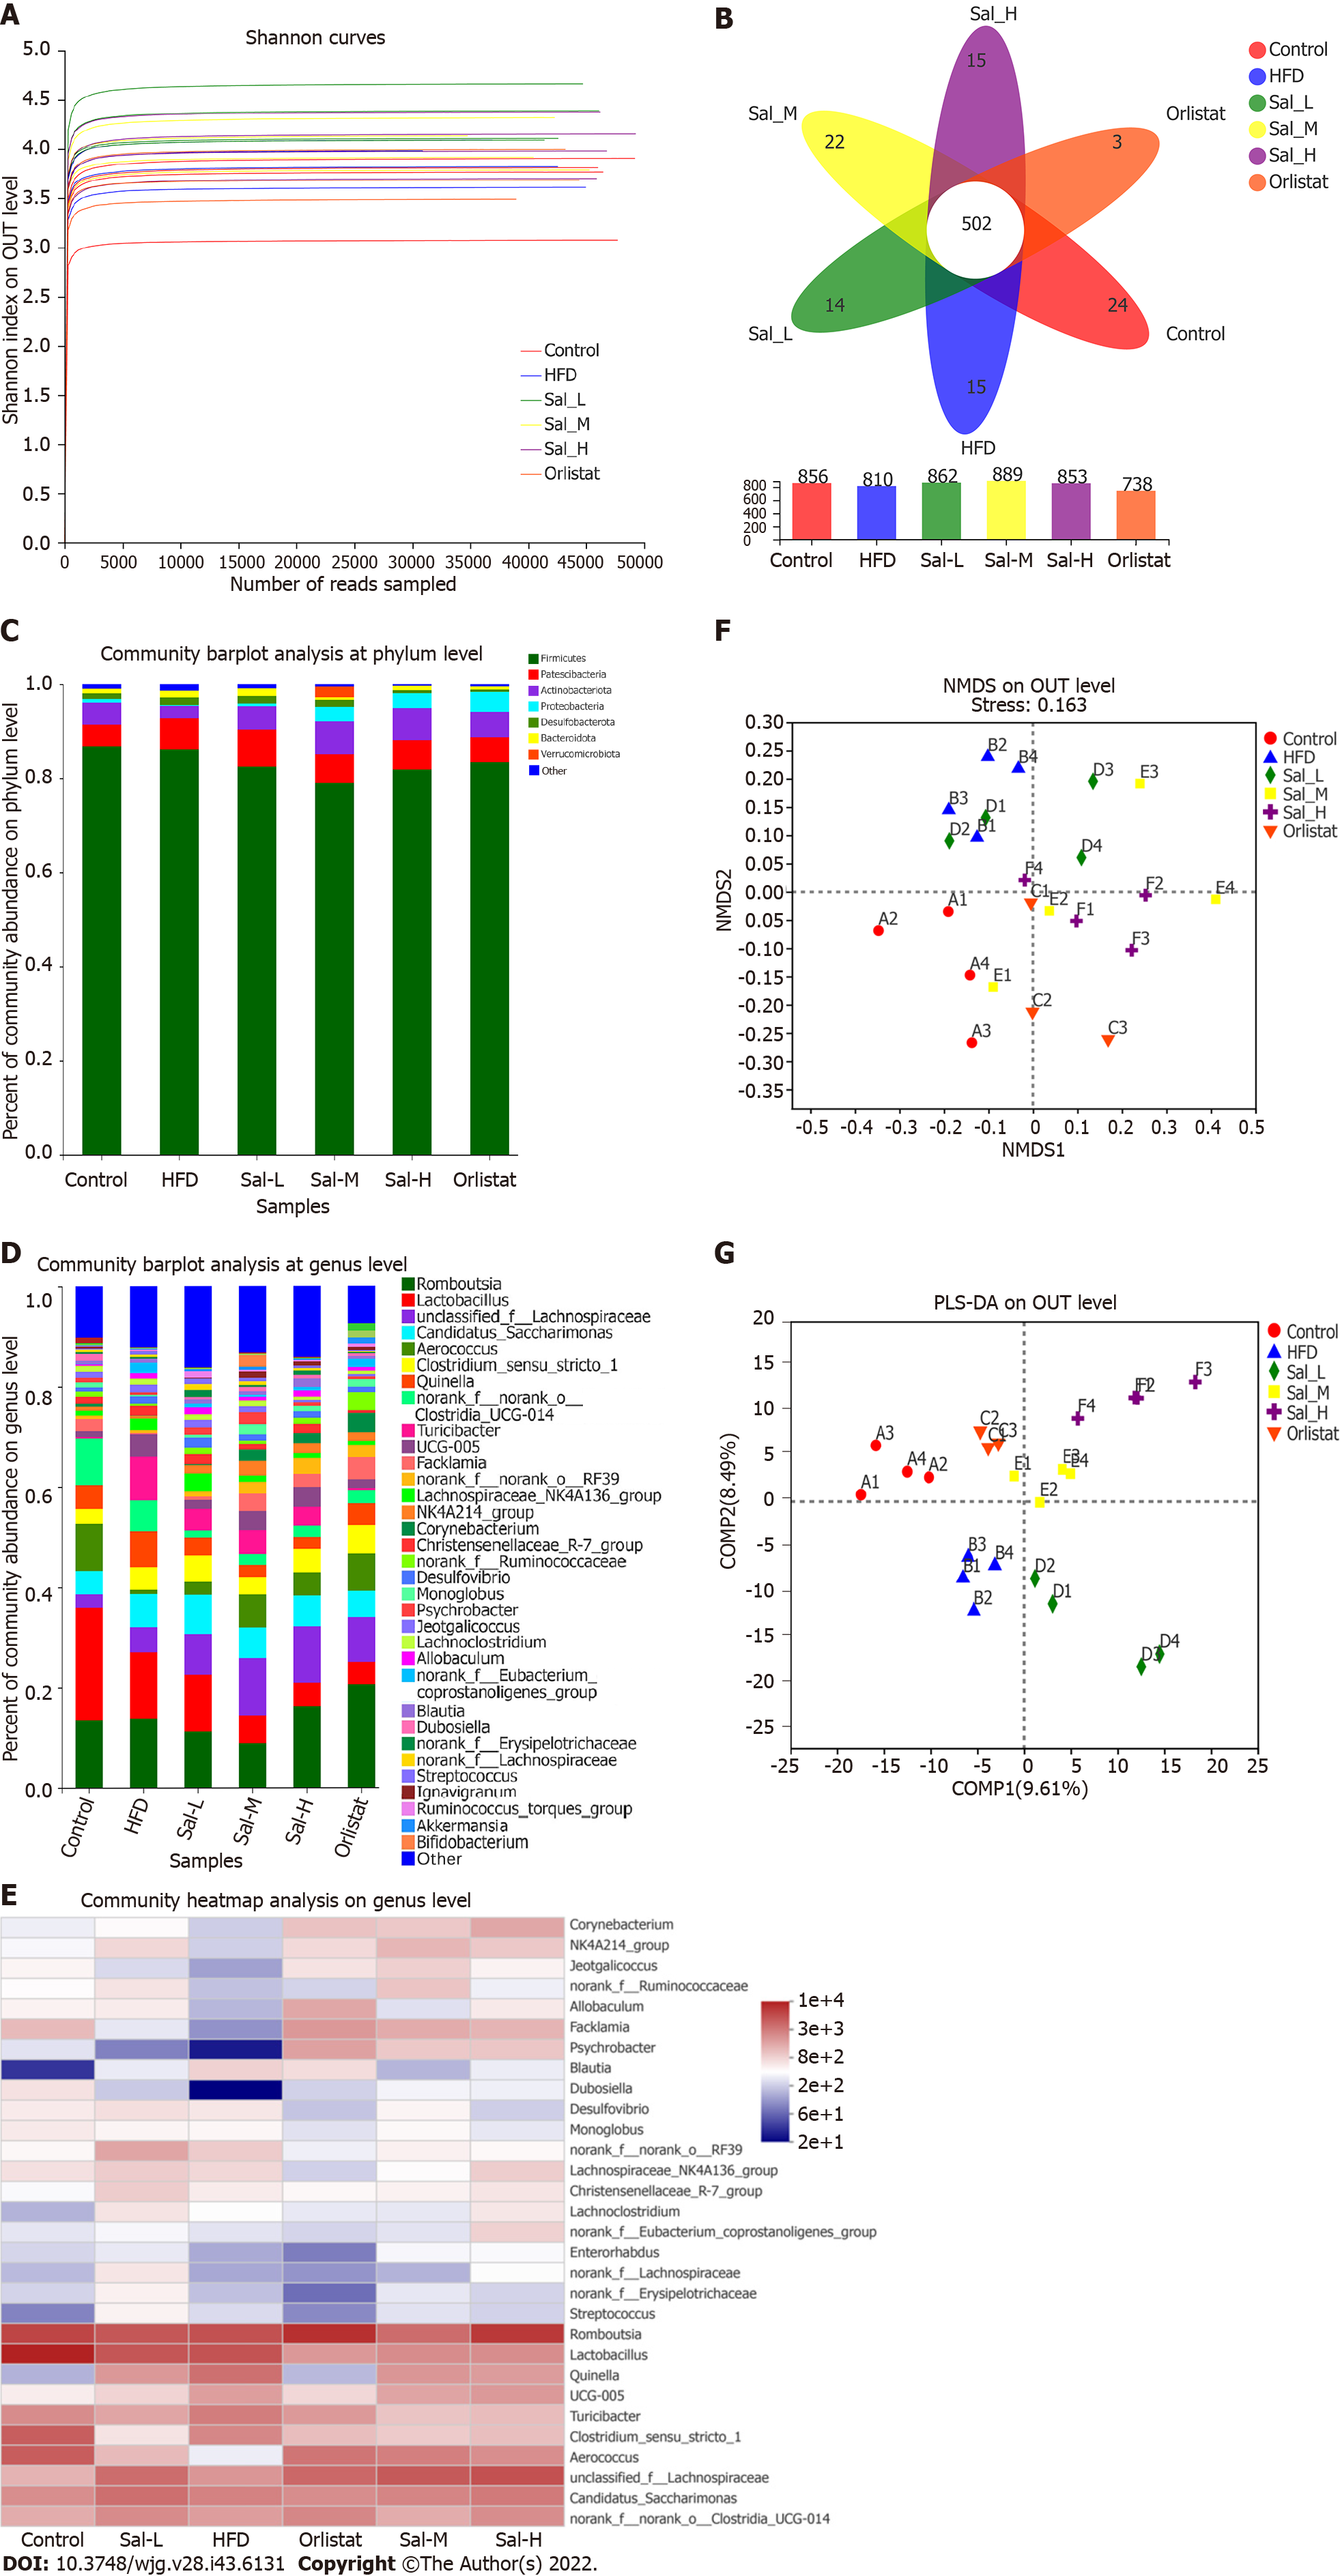
Figure 6 Beneficial effects of Salvia miltiorrhiza are associated with improved gut microbiome composition in high-fat diet-fed rats.
A: α-diversity analysis: Shannon curves at the operational taxonomic unit (OTU) level; B: Venn diagram; C: Community bar plot analysis at the phylum level; D: Community bar plot analysis at the genus level; E: Community heatmap analysis of 30 species at the genus level; F: Non-metric multidimensional scaling (NMDS) at the OTU level; G: Partial least squares discriminant analysis (PLS-DA) score at the OTU level.
Figure 7 Effect of Salvia miltiorrhiza on intestinal microbiota composition in six groups of rats.
A: Differential analysis among these six groups at the genus level; B-F: Differential analysis between control and high-fat diet (HFD) groups, HFD and Sal_L groups, HFD and Sal_M groups, HFD and Sal_H groups, and HFD and orlistat groups at the genus level (aP < 0.05, bP < 0.01); G: Network analysis at the genus level; H: Phylogenetic tree at the genus level; I: COG functional classification.
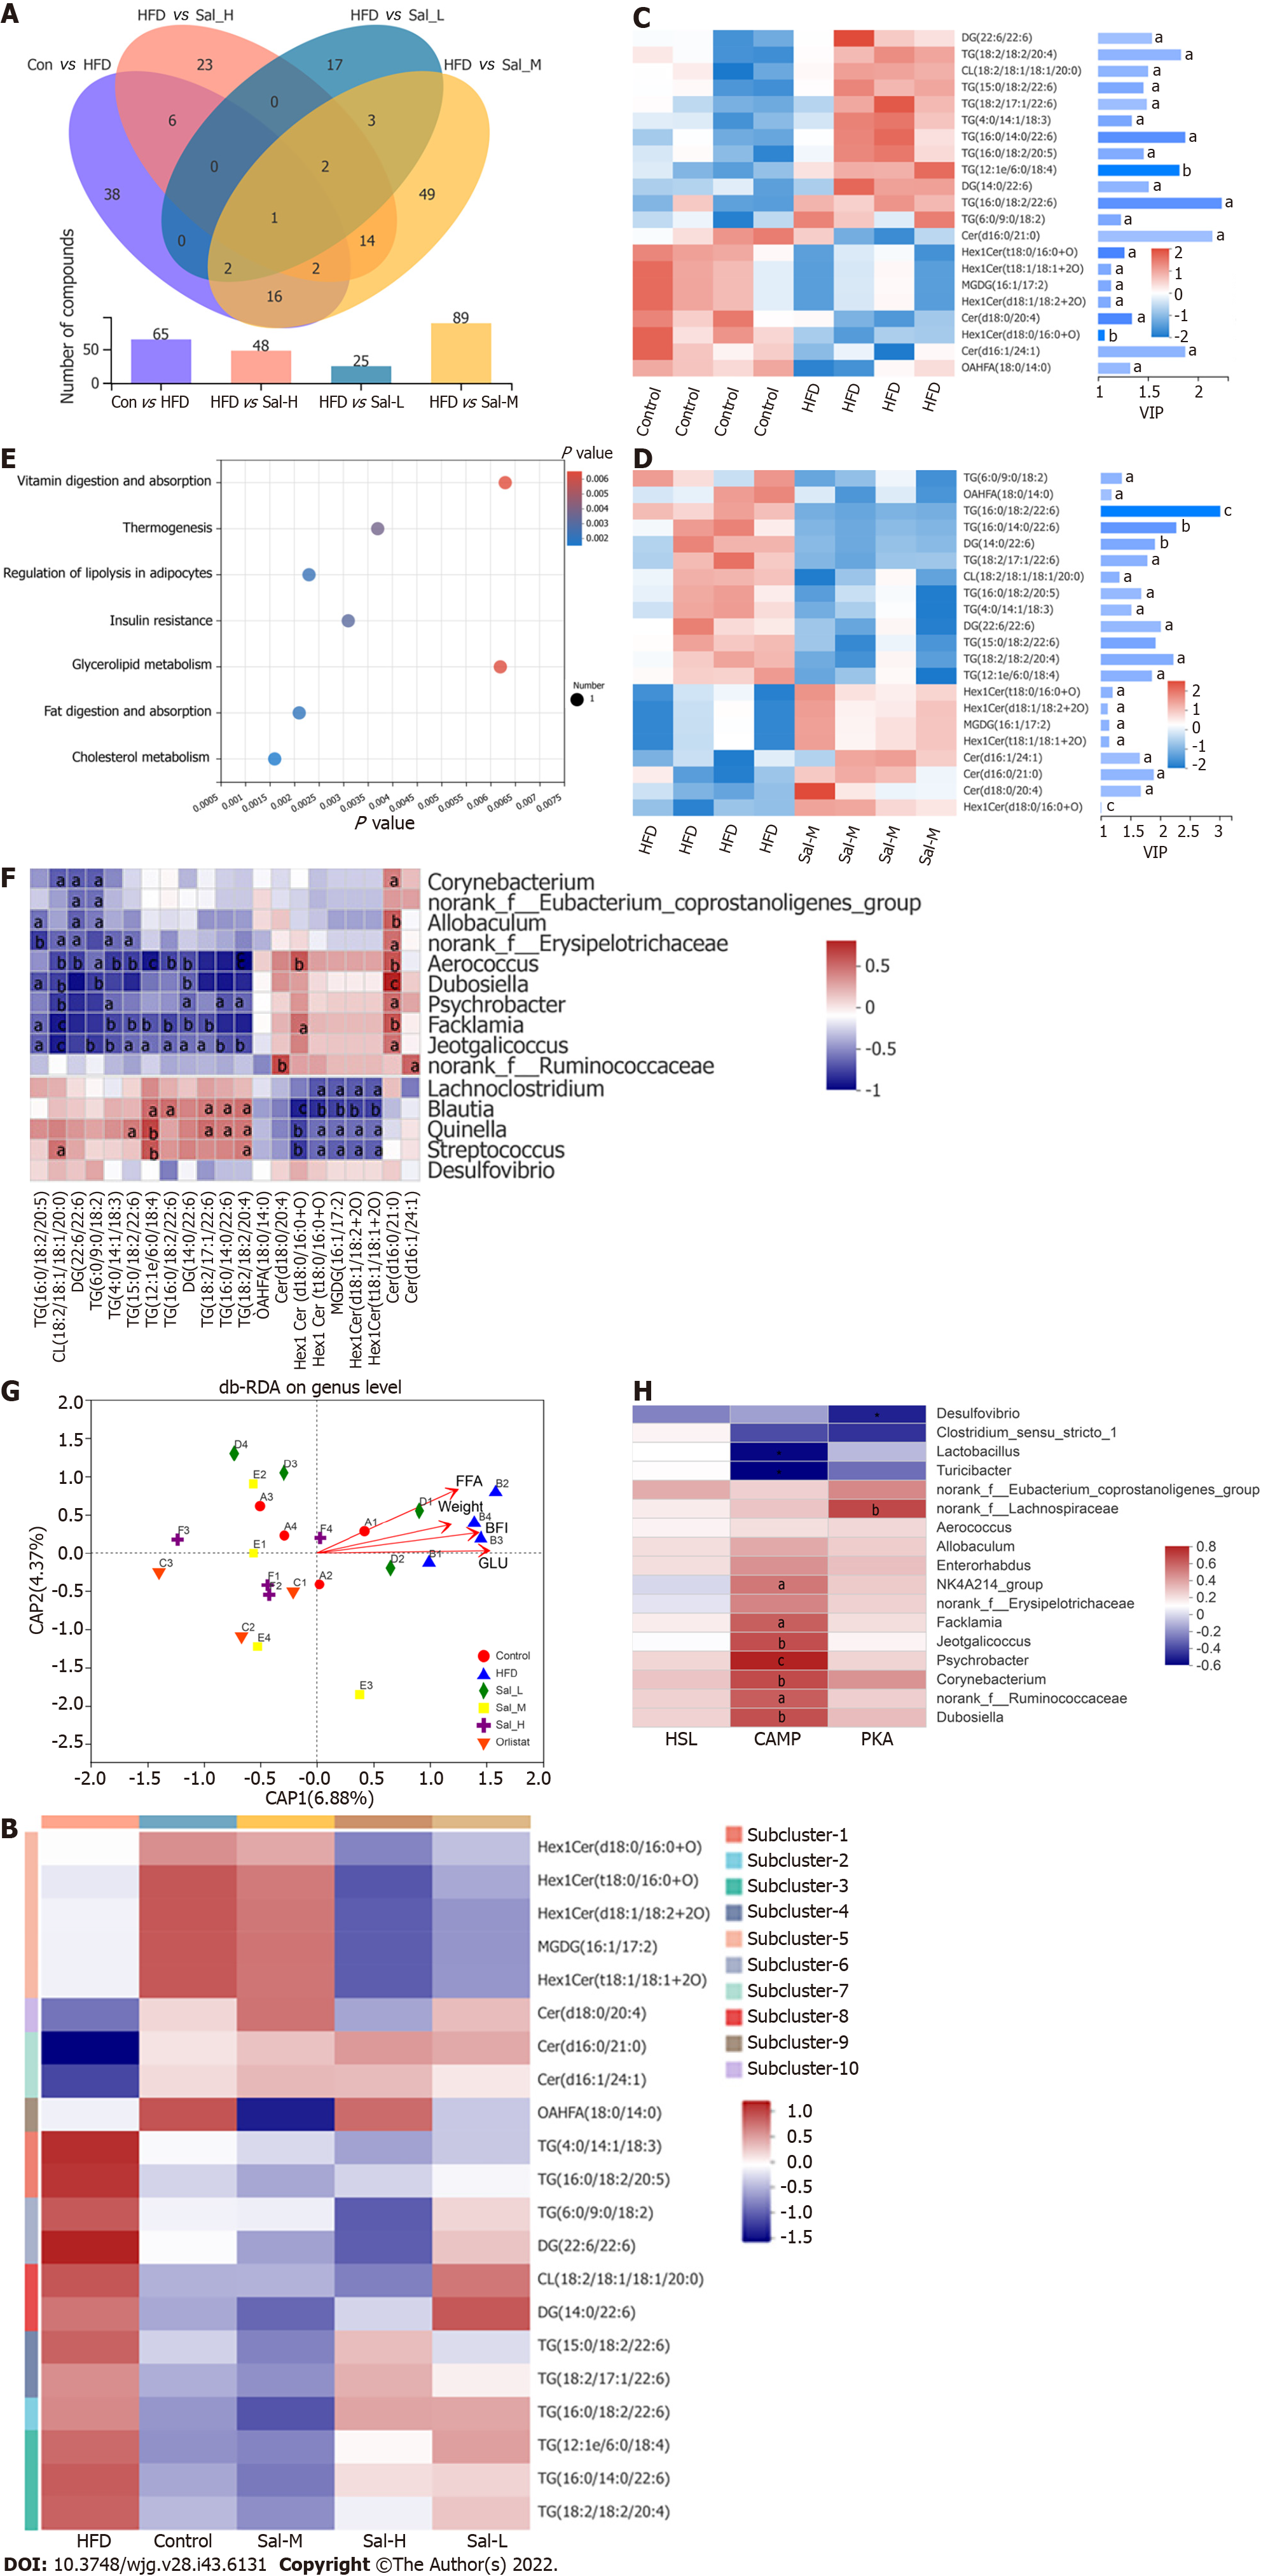
Figure 8 Lipidomics analysis and associations of gut microbial species with environmental factors.
A: Numbers of differential metabolites between the control and high-fat diet (HFD) groups, HFD and Sal_L groups, HFD and Sal_M groups, and HFD and Sal_H groups (Venn diagram); B: Hierarchical clustering of metabolites in Control, HFD, Sal_L, Sal_M, and Sal_H groups; C: Heatmap of the VIP expression profile of the metabolites between control and HFD groups; D: Heatmap of the VIP expression profile of the metabolites between HFD and Sal_M groups; E: KEGG pathway enrichment; F: Spearman’s correlation between metabolites and gut microbiota; G: Correlation between free fatty acids, weight, body fat index, glucose, and microbial flora structure displayed by distance-based redundancy analysis (db-RDA analysis); H: Spearman’s correlation between cAMP, PKA, HSL, and gut microbiota. aP < 0.05, bP < 0.01, or cP < 0.001.
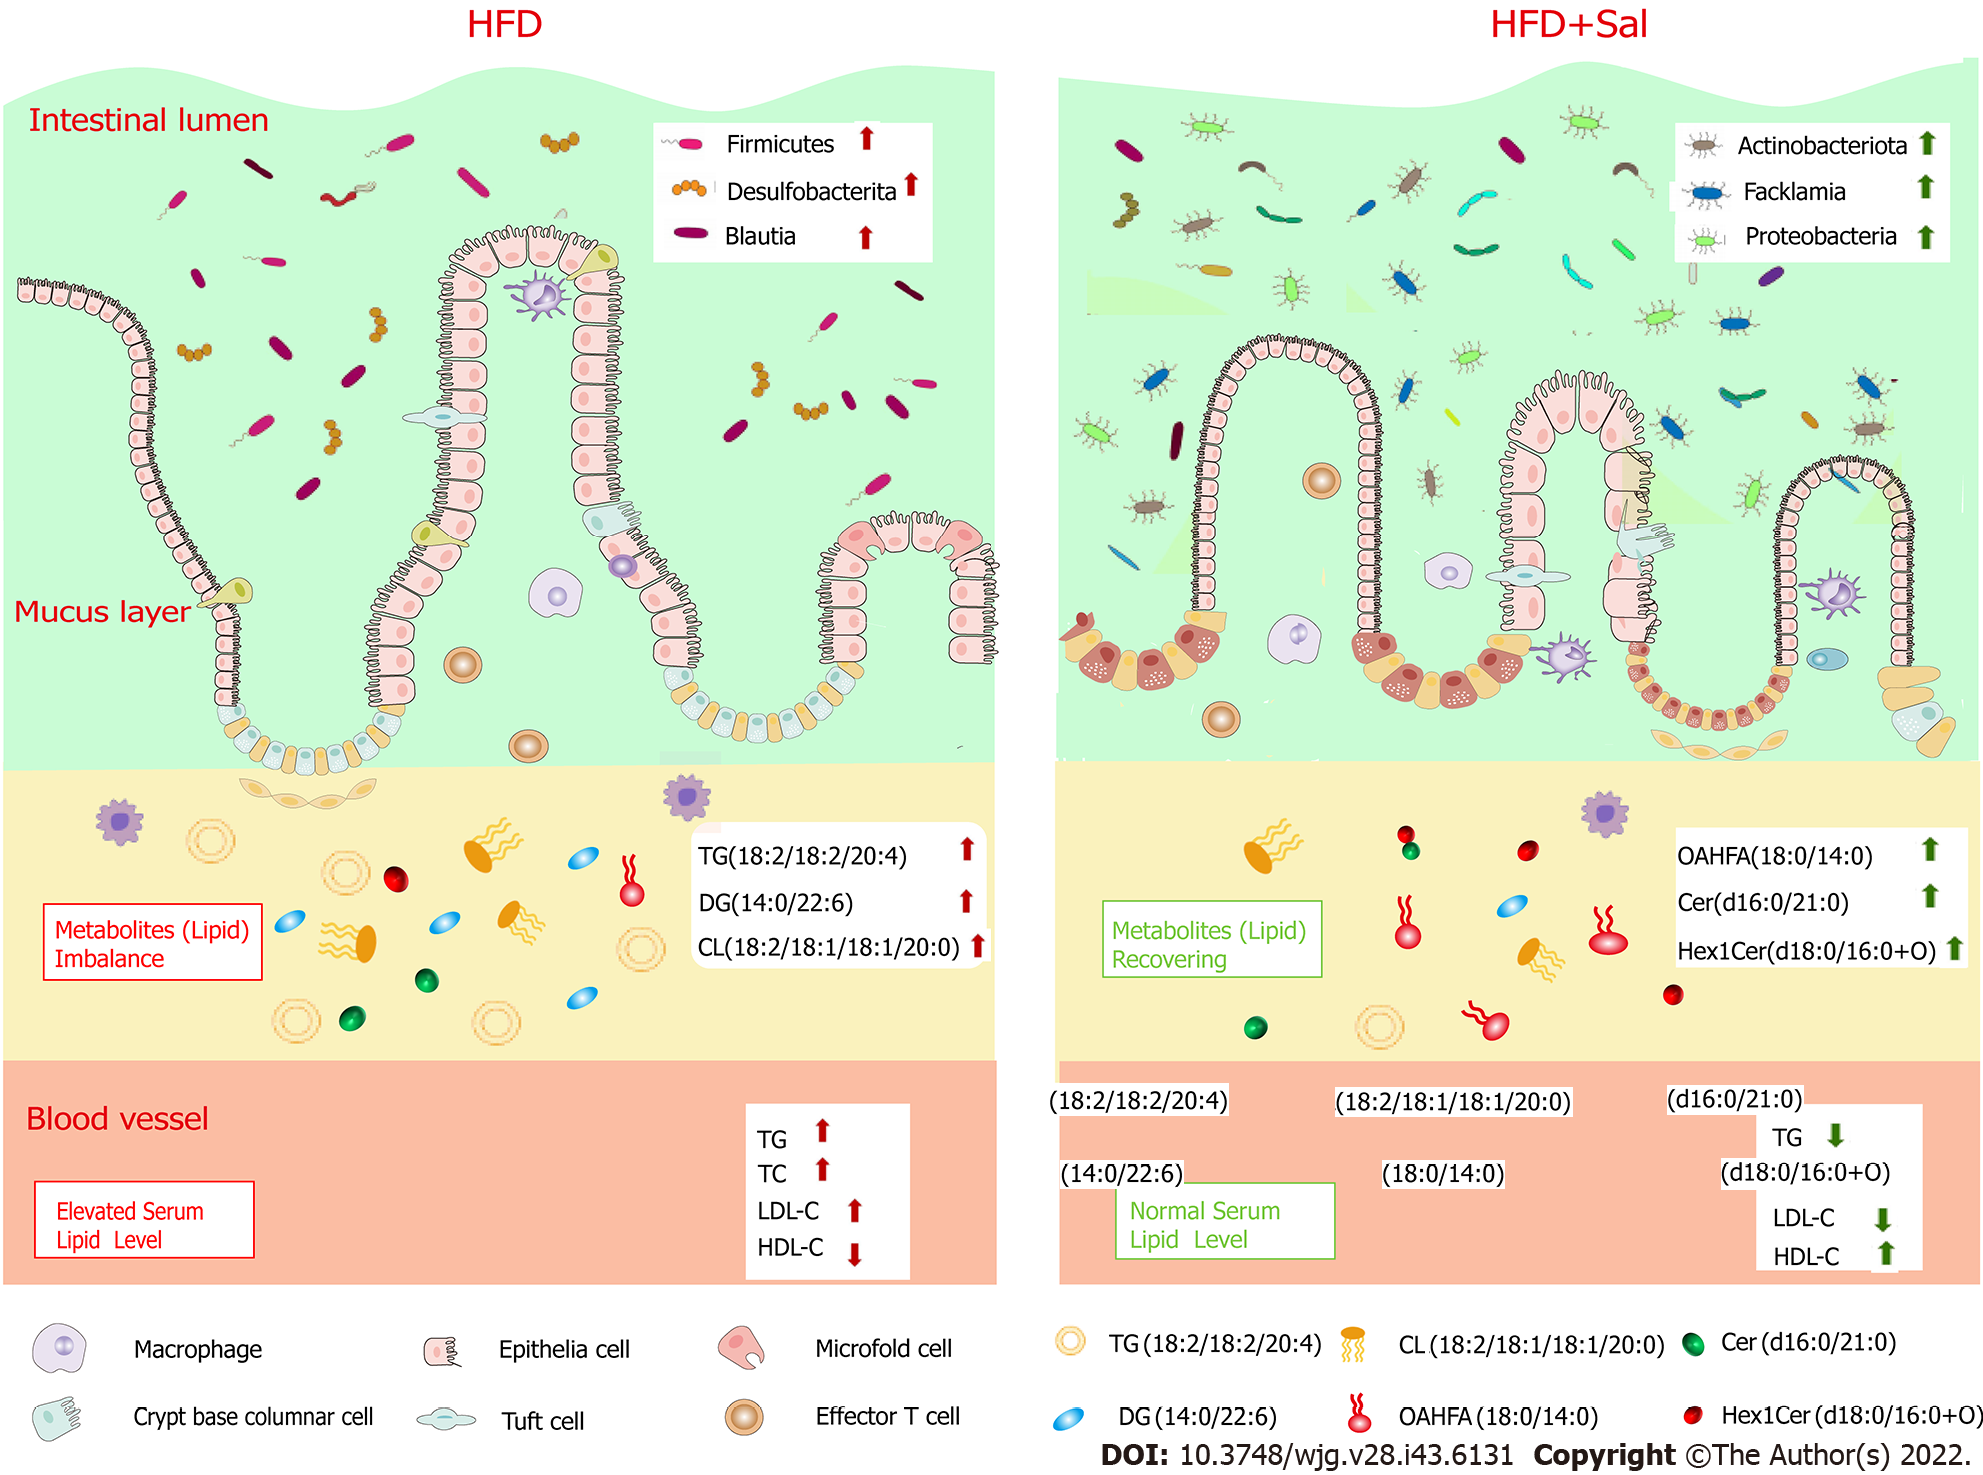
Figure 9 Graphical illustration of mechanism of action of Salvia miltiorrhiza to alleviate obesity.
Salvia miltiorrhiza ameliorated obesity by reshaping the balance of gut microbiota, modulating the lipid metabolites, and improving blood lipids. Sal: Salvia miltiorrhiza extract; HFD: High-fat diet; TG: Triglycerides; TC: Total cholesterol; HDL-C: High-density lipoprotein; LDL-C: Low-density lipoprotein; GLU: Glucose; FFA: Free fatty acids.
- Citation: Ai ZL, Zhang X, Ge W, Zhong YB, Wang HY, Zuo ZY, Liu DY. Salvia miltiorrhiza extract may exert an anti-obesity effect in rats with high-fat diet-induced obesity by modulating gut microbiome and lipid metabolism. World J Gastroenterol 2022; 28(43): 6131-6156
- URL: https://www.wjgnet.com/1007-9327/full/v28/i43/6131.htm
- DOI: https://dx.doi.org/10.3748/wjg.v28.i43.6131


