Copyright
©The Author(s) 2022.
World J Gastroenterol. Jan 28, 2022; 28(4): 479-496
Published online Jan 28, 2022. doi: 10.3748/wjg.v28.i4.479
Published online Jan 28, 2022. doi: 10.3748/wjg.v28.i4.479
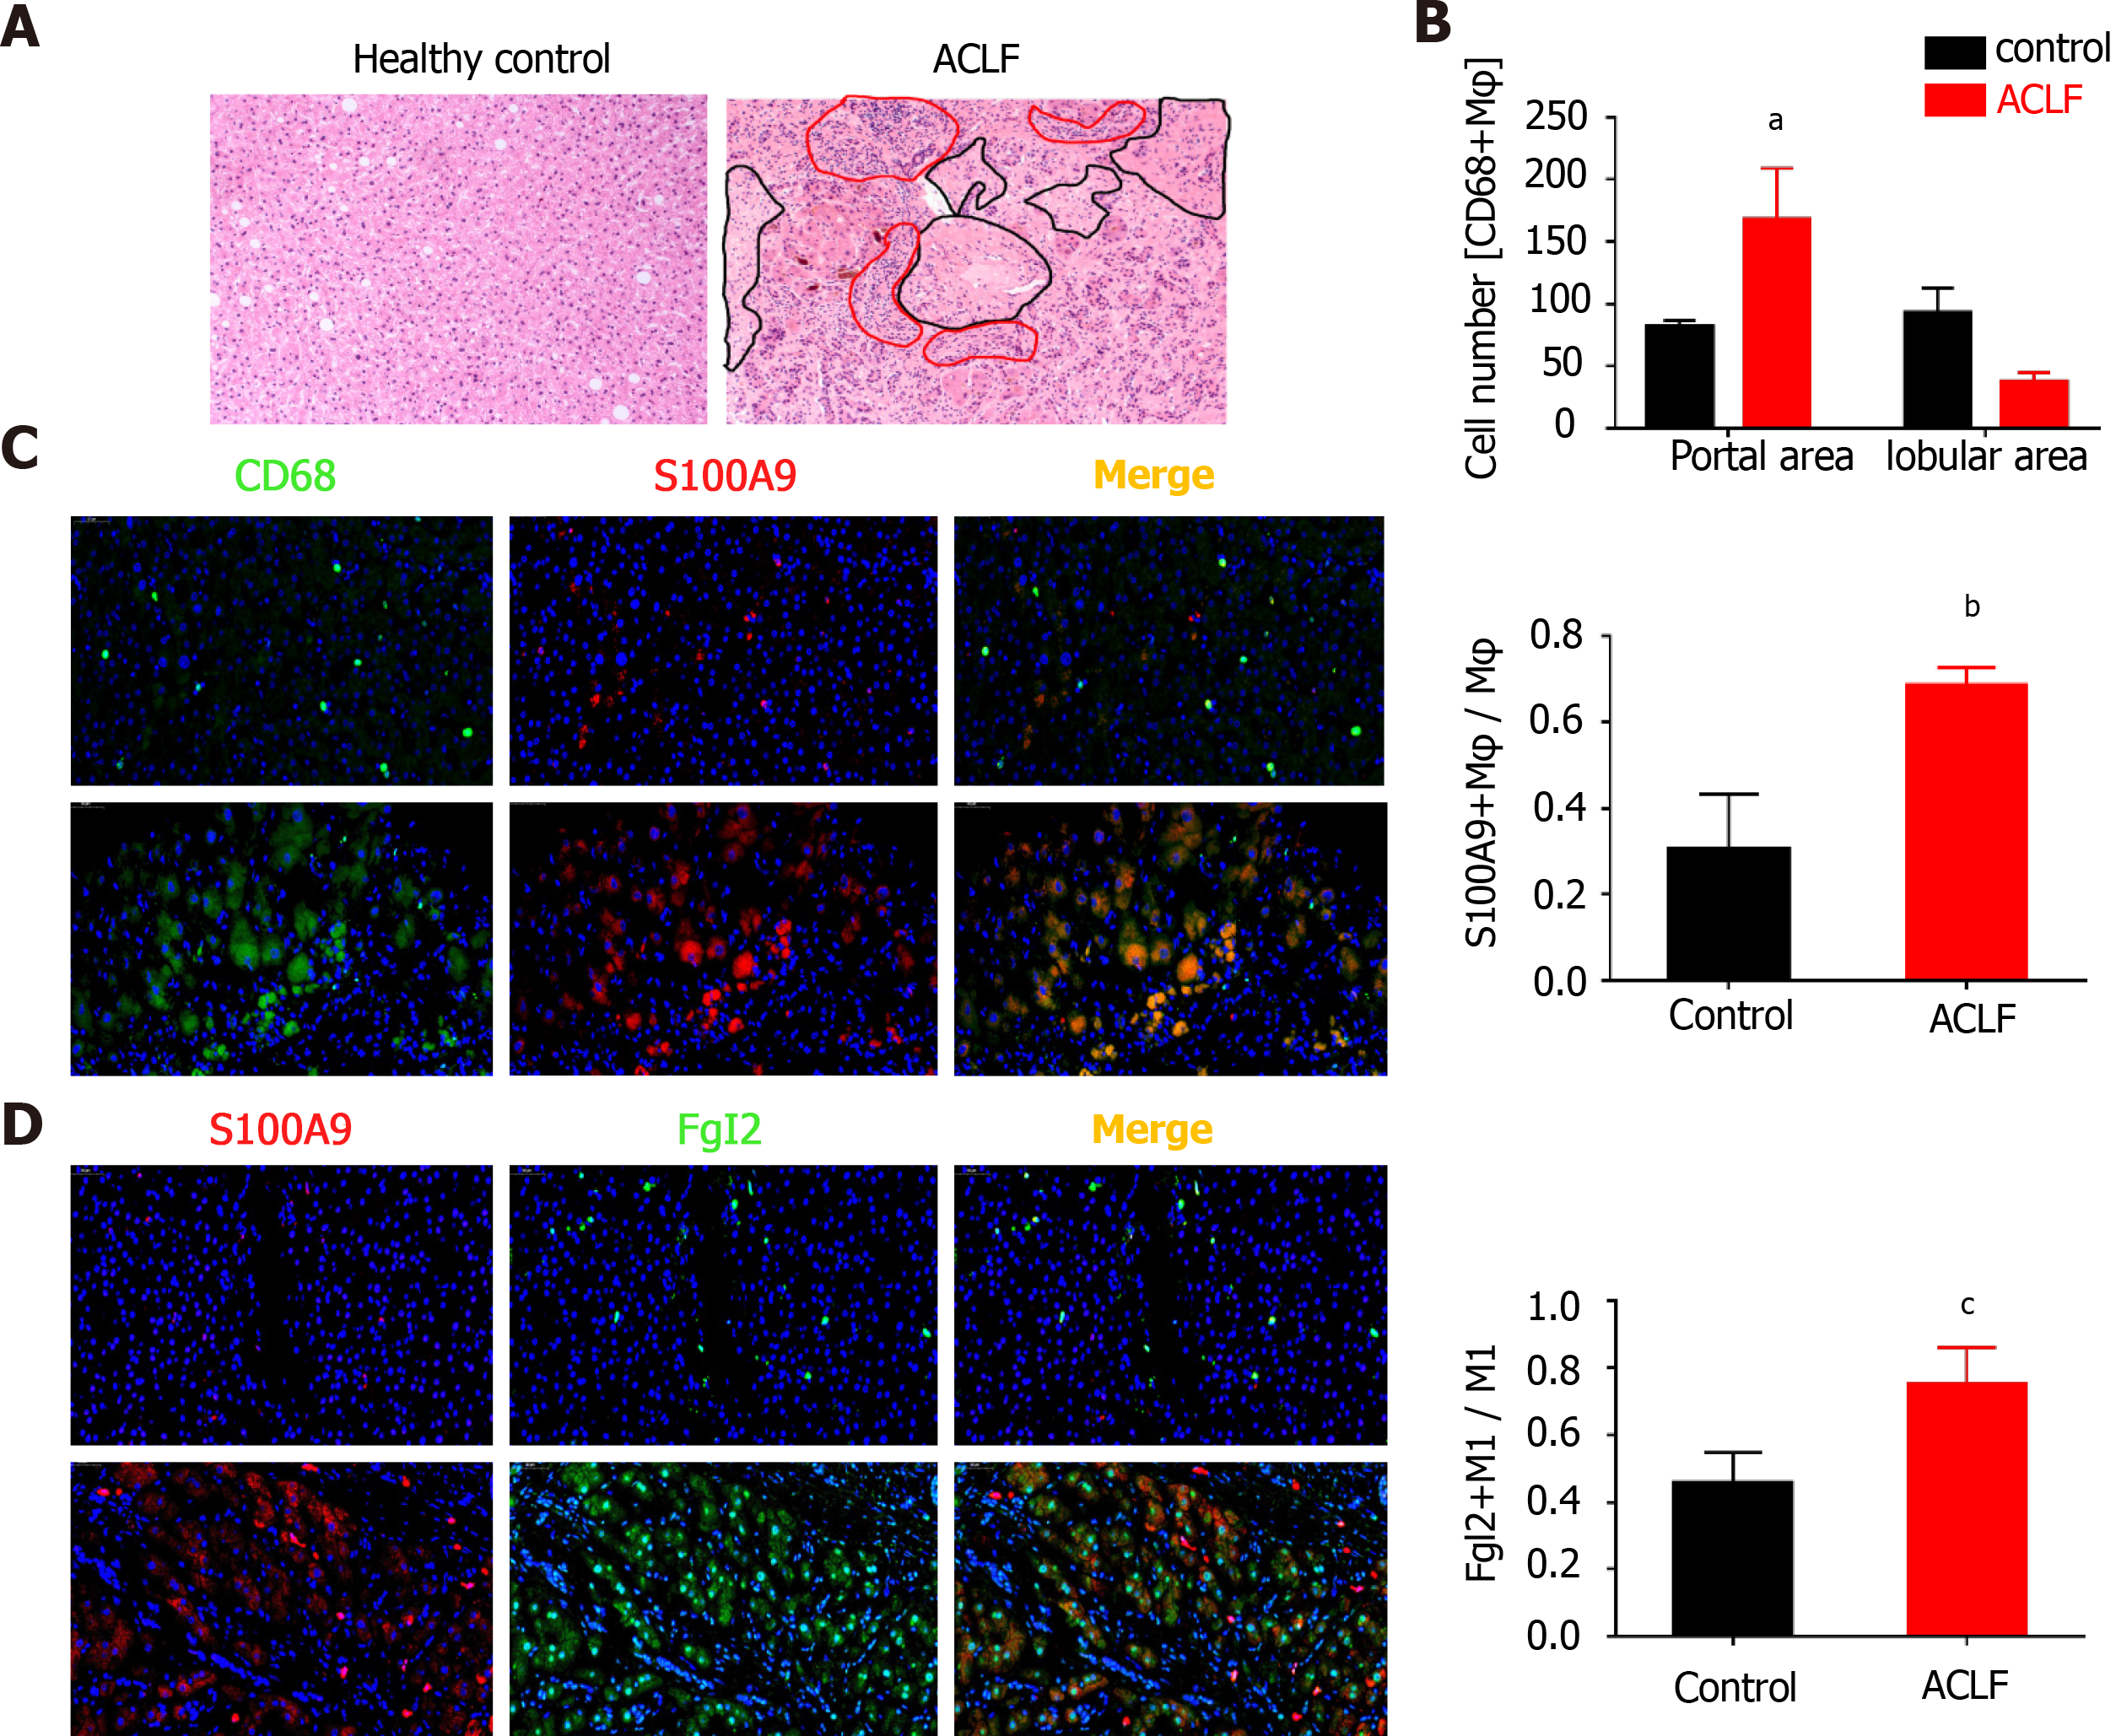
Figure 1 Fibrinogen-like protein 2 was expressed on proinflammatory macrophages in patients with hepatitis B virus-associated liver failure.
A: Representative image of liver sections (200×) subjected to Hematoxylin and eosin staining (H&E); Black circles point to transparent necrosis, red circles point to infiltrating leukocytes; B: Calculation of CD68+ macrophages at periportal and lobular areas; C: Immunofluorescence against CD68, S100A9 on liver sections (200×) from patients of hepatitis B virus-associated acute chronic-on liver failure (acute-on-chronic liver failure (ACLF), n = 7) and healthy controls (n = 3); D: Immunofluorescence against S100A9 and fibrinogen-like protein 2 on liver sections (200×) from ACLF patients (n = 7) and healthy controls (n = 3), representative images on the left and statistical columns on the right. Data are expressed as mean ± SD.
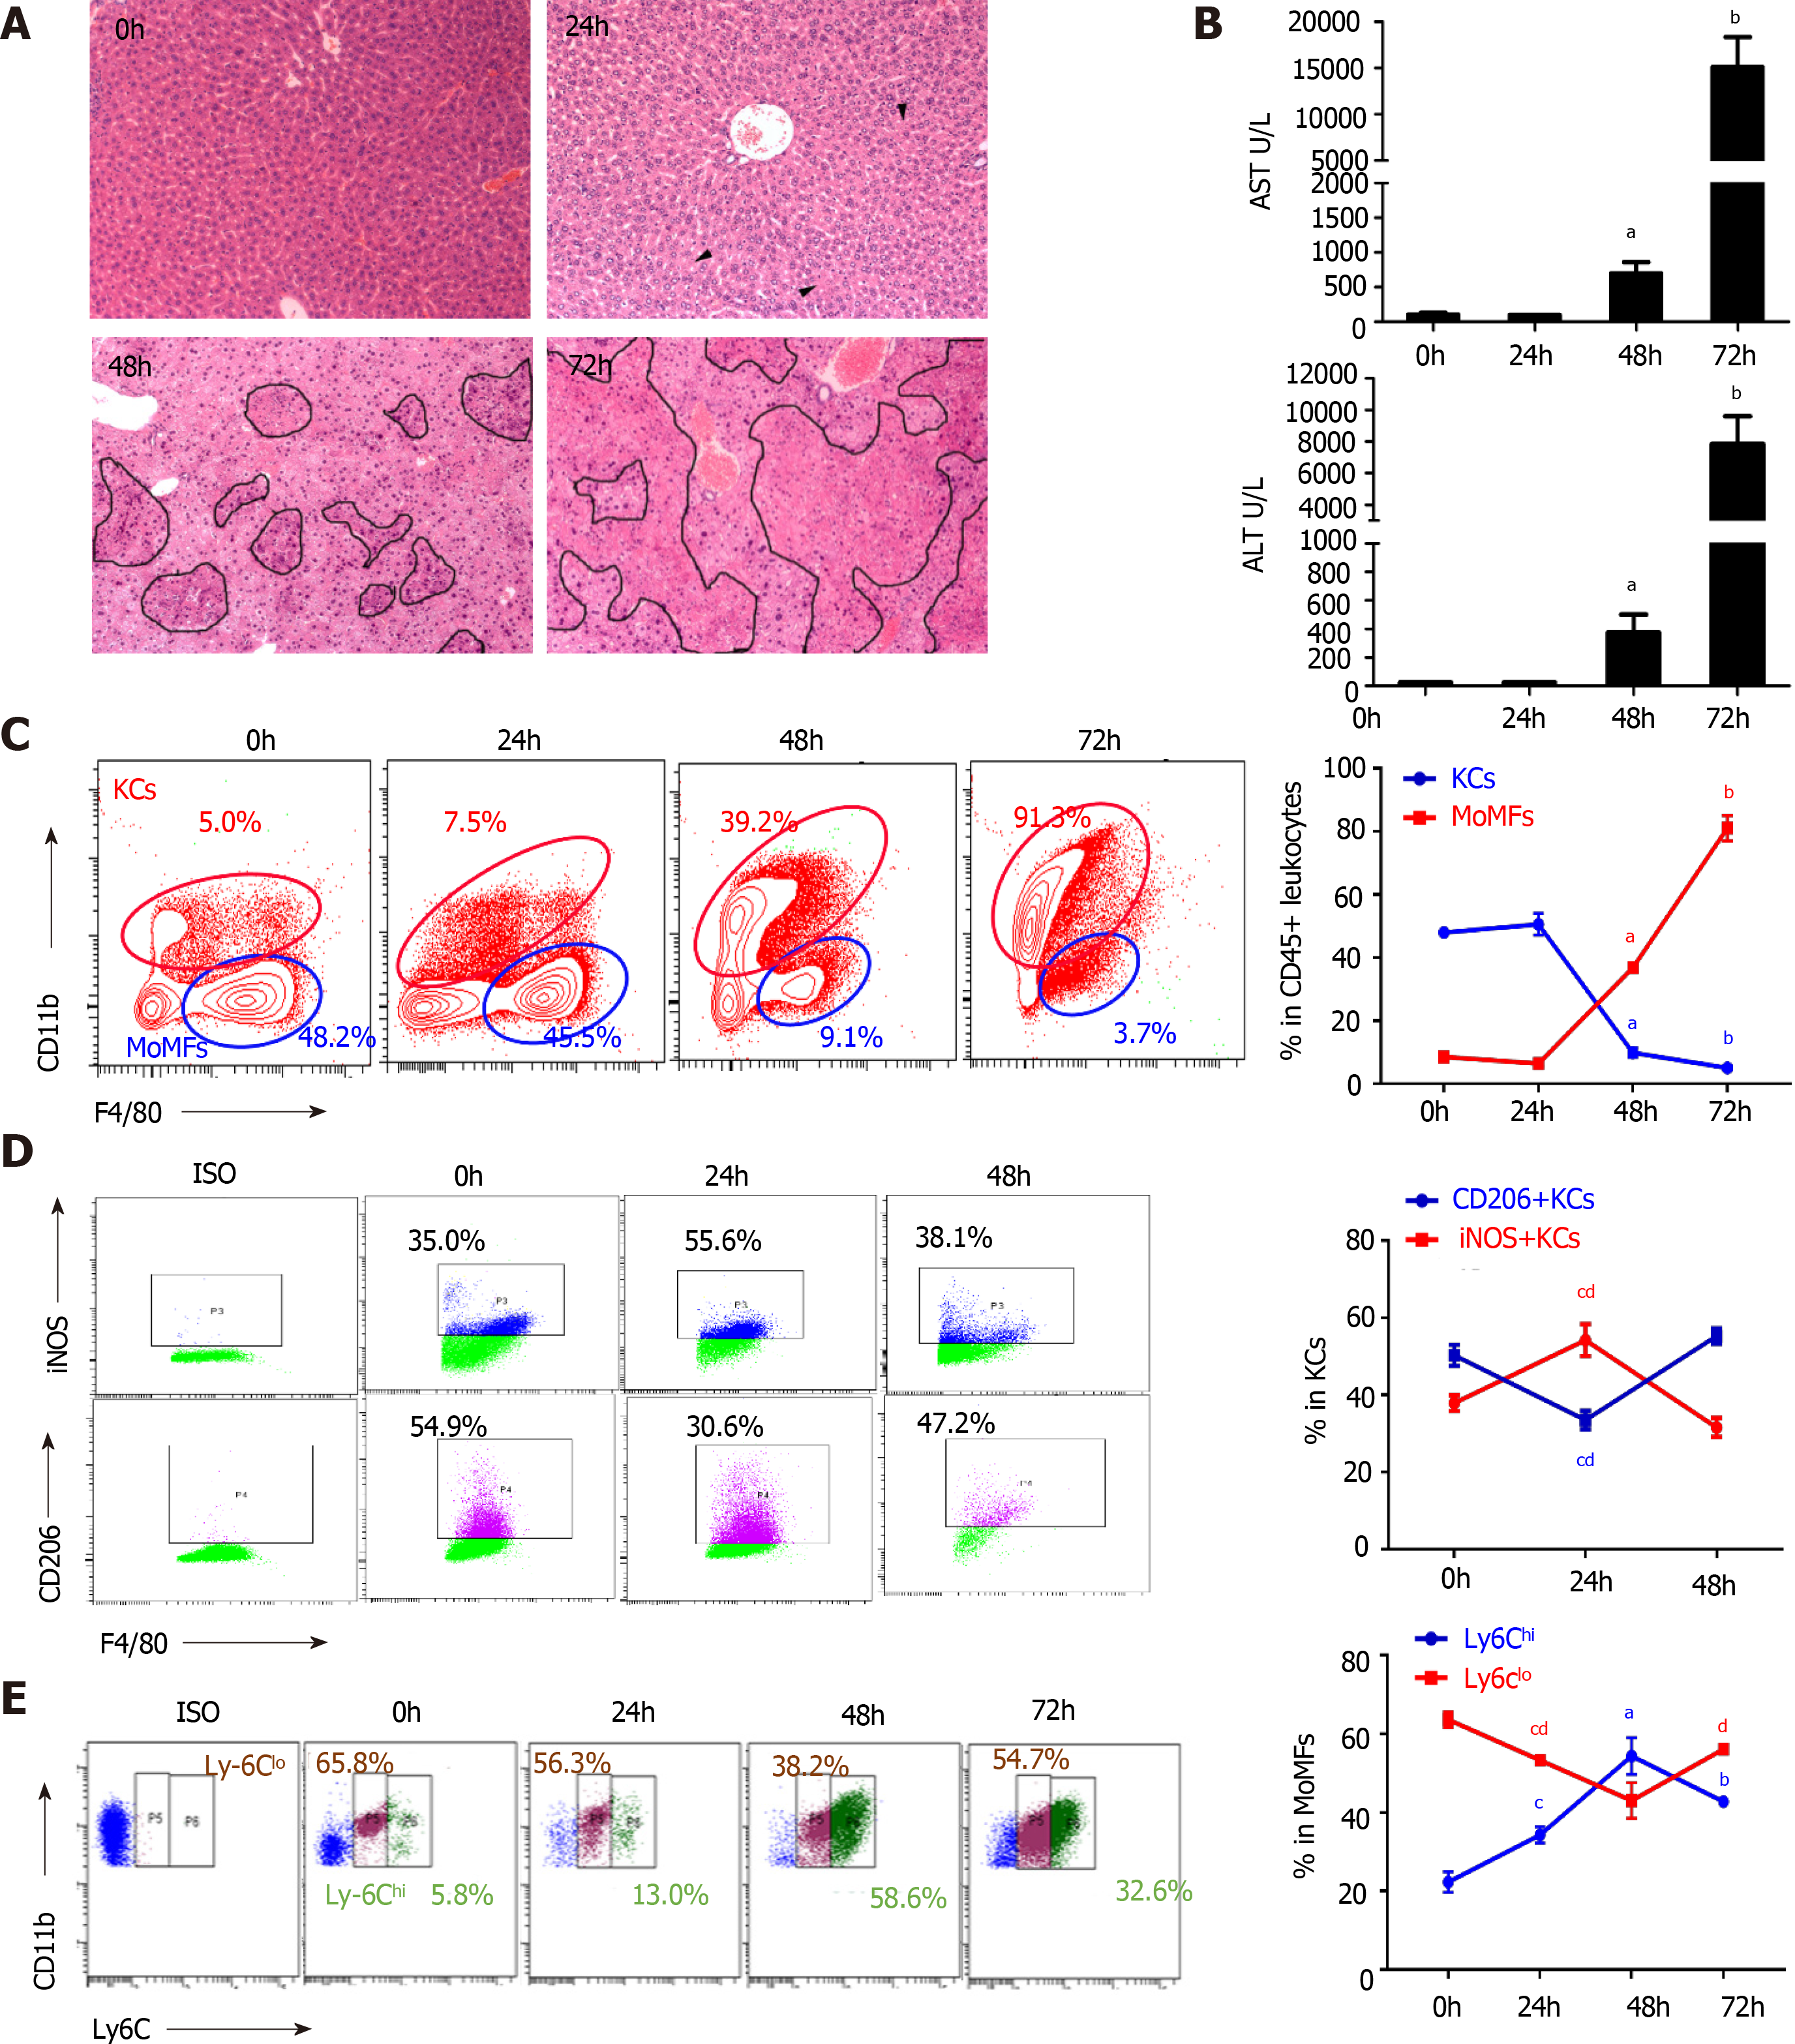
Figure 2 Dynamic alteration of macrophage subsets during viral fulminant hepatitis progression.
A: Time-course H&E staining on liver sections of mice after murine hepatitis virus strain 3 infection. Arrowheads indicated hepatocyte cytoplasmic destruction, Circles pointed to necrosis; B: ALT and AST levels from serum of mice post-viral infection; C: Flow cytometry of KCs (CD45+ F4/80high), MoMFs (CD45+ Ly6C+ F4/80int) of cells (left), and their percentage in the liver at various time point after viral infection; D: Flow cytometry of KCs (left) and frequency of M1 (iNOS+), M2 (CD206+) macrophages in KCs (right); E: Representative image of MoMFs (left) and frequency of Ly6Chigh and Ly6Clow MoMFs at different time point after viral infection. Data are presented as mean ± SD (n = 5). These experiments were repeated at least three times. KCs: Kuffer cells; MoMFs: Monocyte derived macrophages.
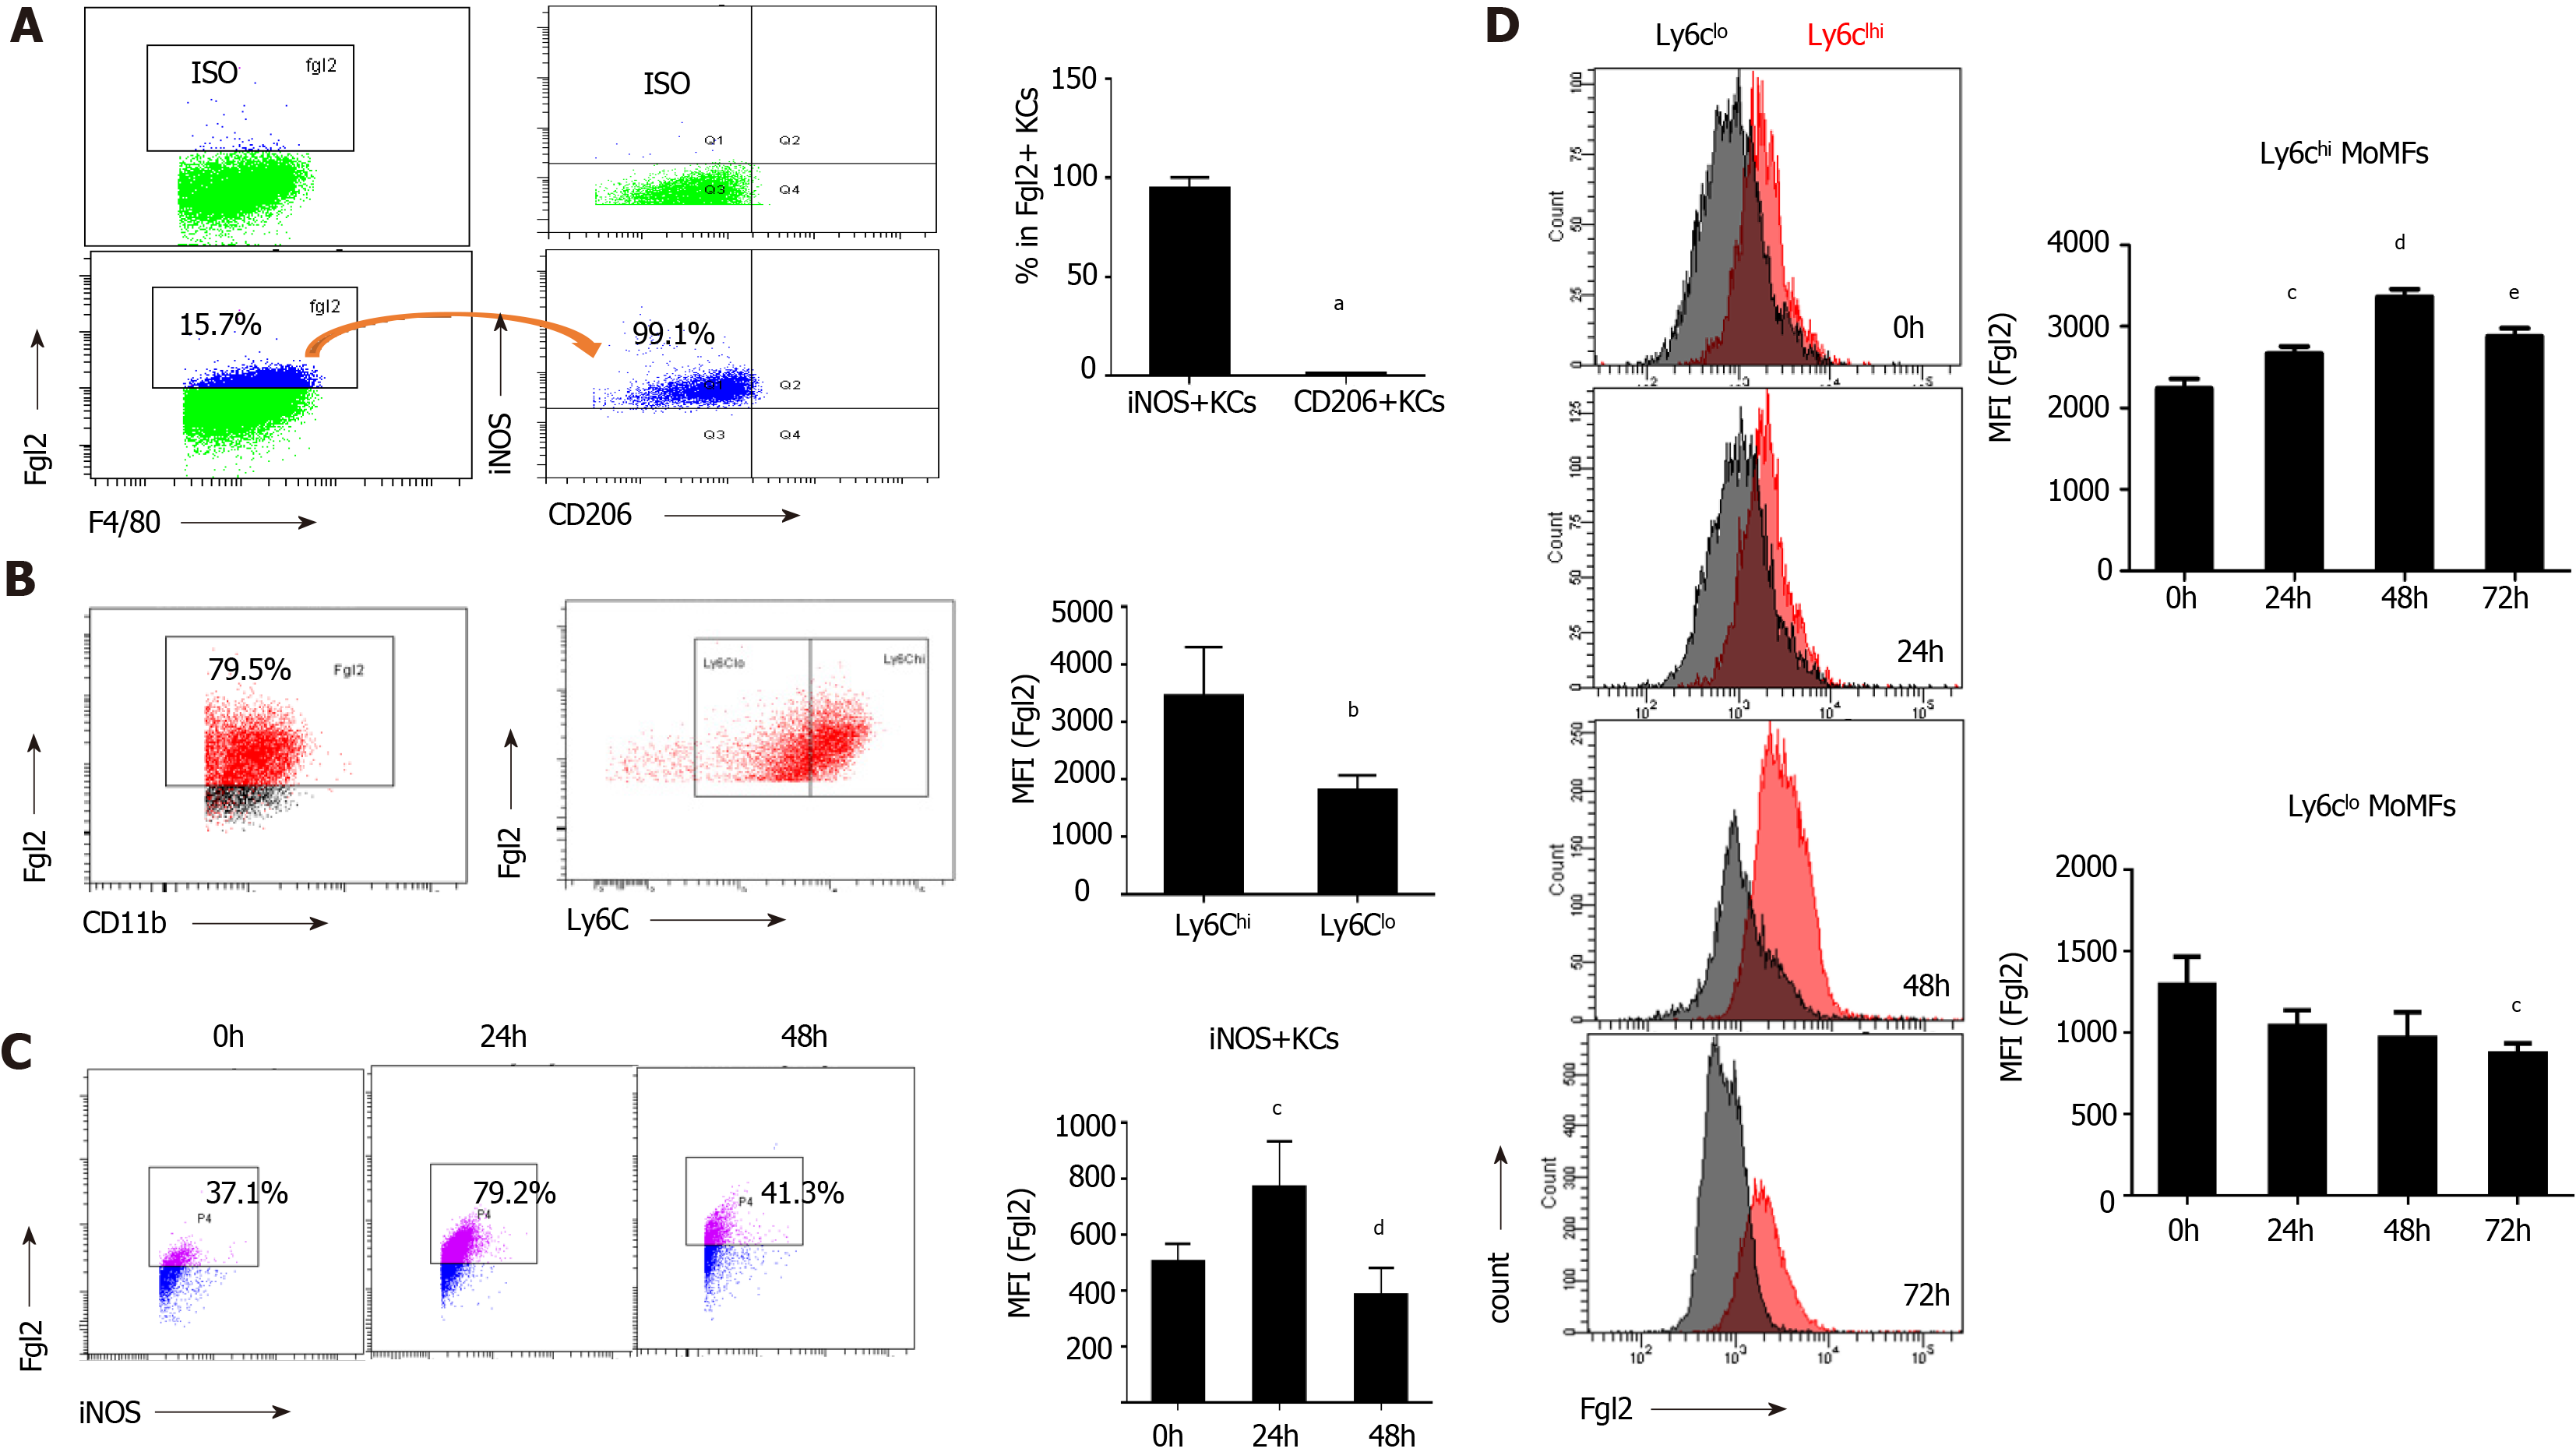
Figure 3 Fibrinogen-like protein 2 expression was robustly inducted upon proinflammatory macrophage activation.
A: Flow cytometry of fibrinogen-like protein 2 (Fgl2) +KCs expressing iNOS and CD206 under homeostatic conditions (left), and frequency of iNOS+ and CD206+ cells subsets (right); B: Representative image of Fgl2+MoMFs expressing Ly6C (left), and relative expression level of Fgl2 in Ly6ChiMoMFs and Ly6Clo MoMFs under physiological conditions (right); C: Time course-presentation of Fgl2 expression in M1 polarized KCs (left), and expression level of Fgl2 in Ly6ChiMoMFs and Ly6Clow MoMFs, respectively (right); D: Cell counts of Fgl2+ MoMFs (left), and relative level of Fgl2 expression on both MoMFs subset (right) following viral infection. Data are presented as mean ± SD (n = 5). These experiments were repeated at least three times. MFI: Mean fluorescence intensity.
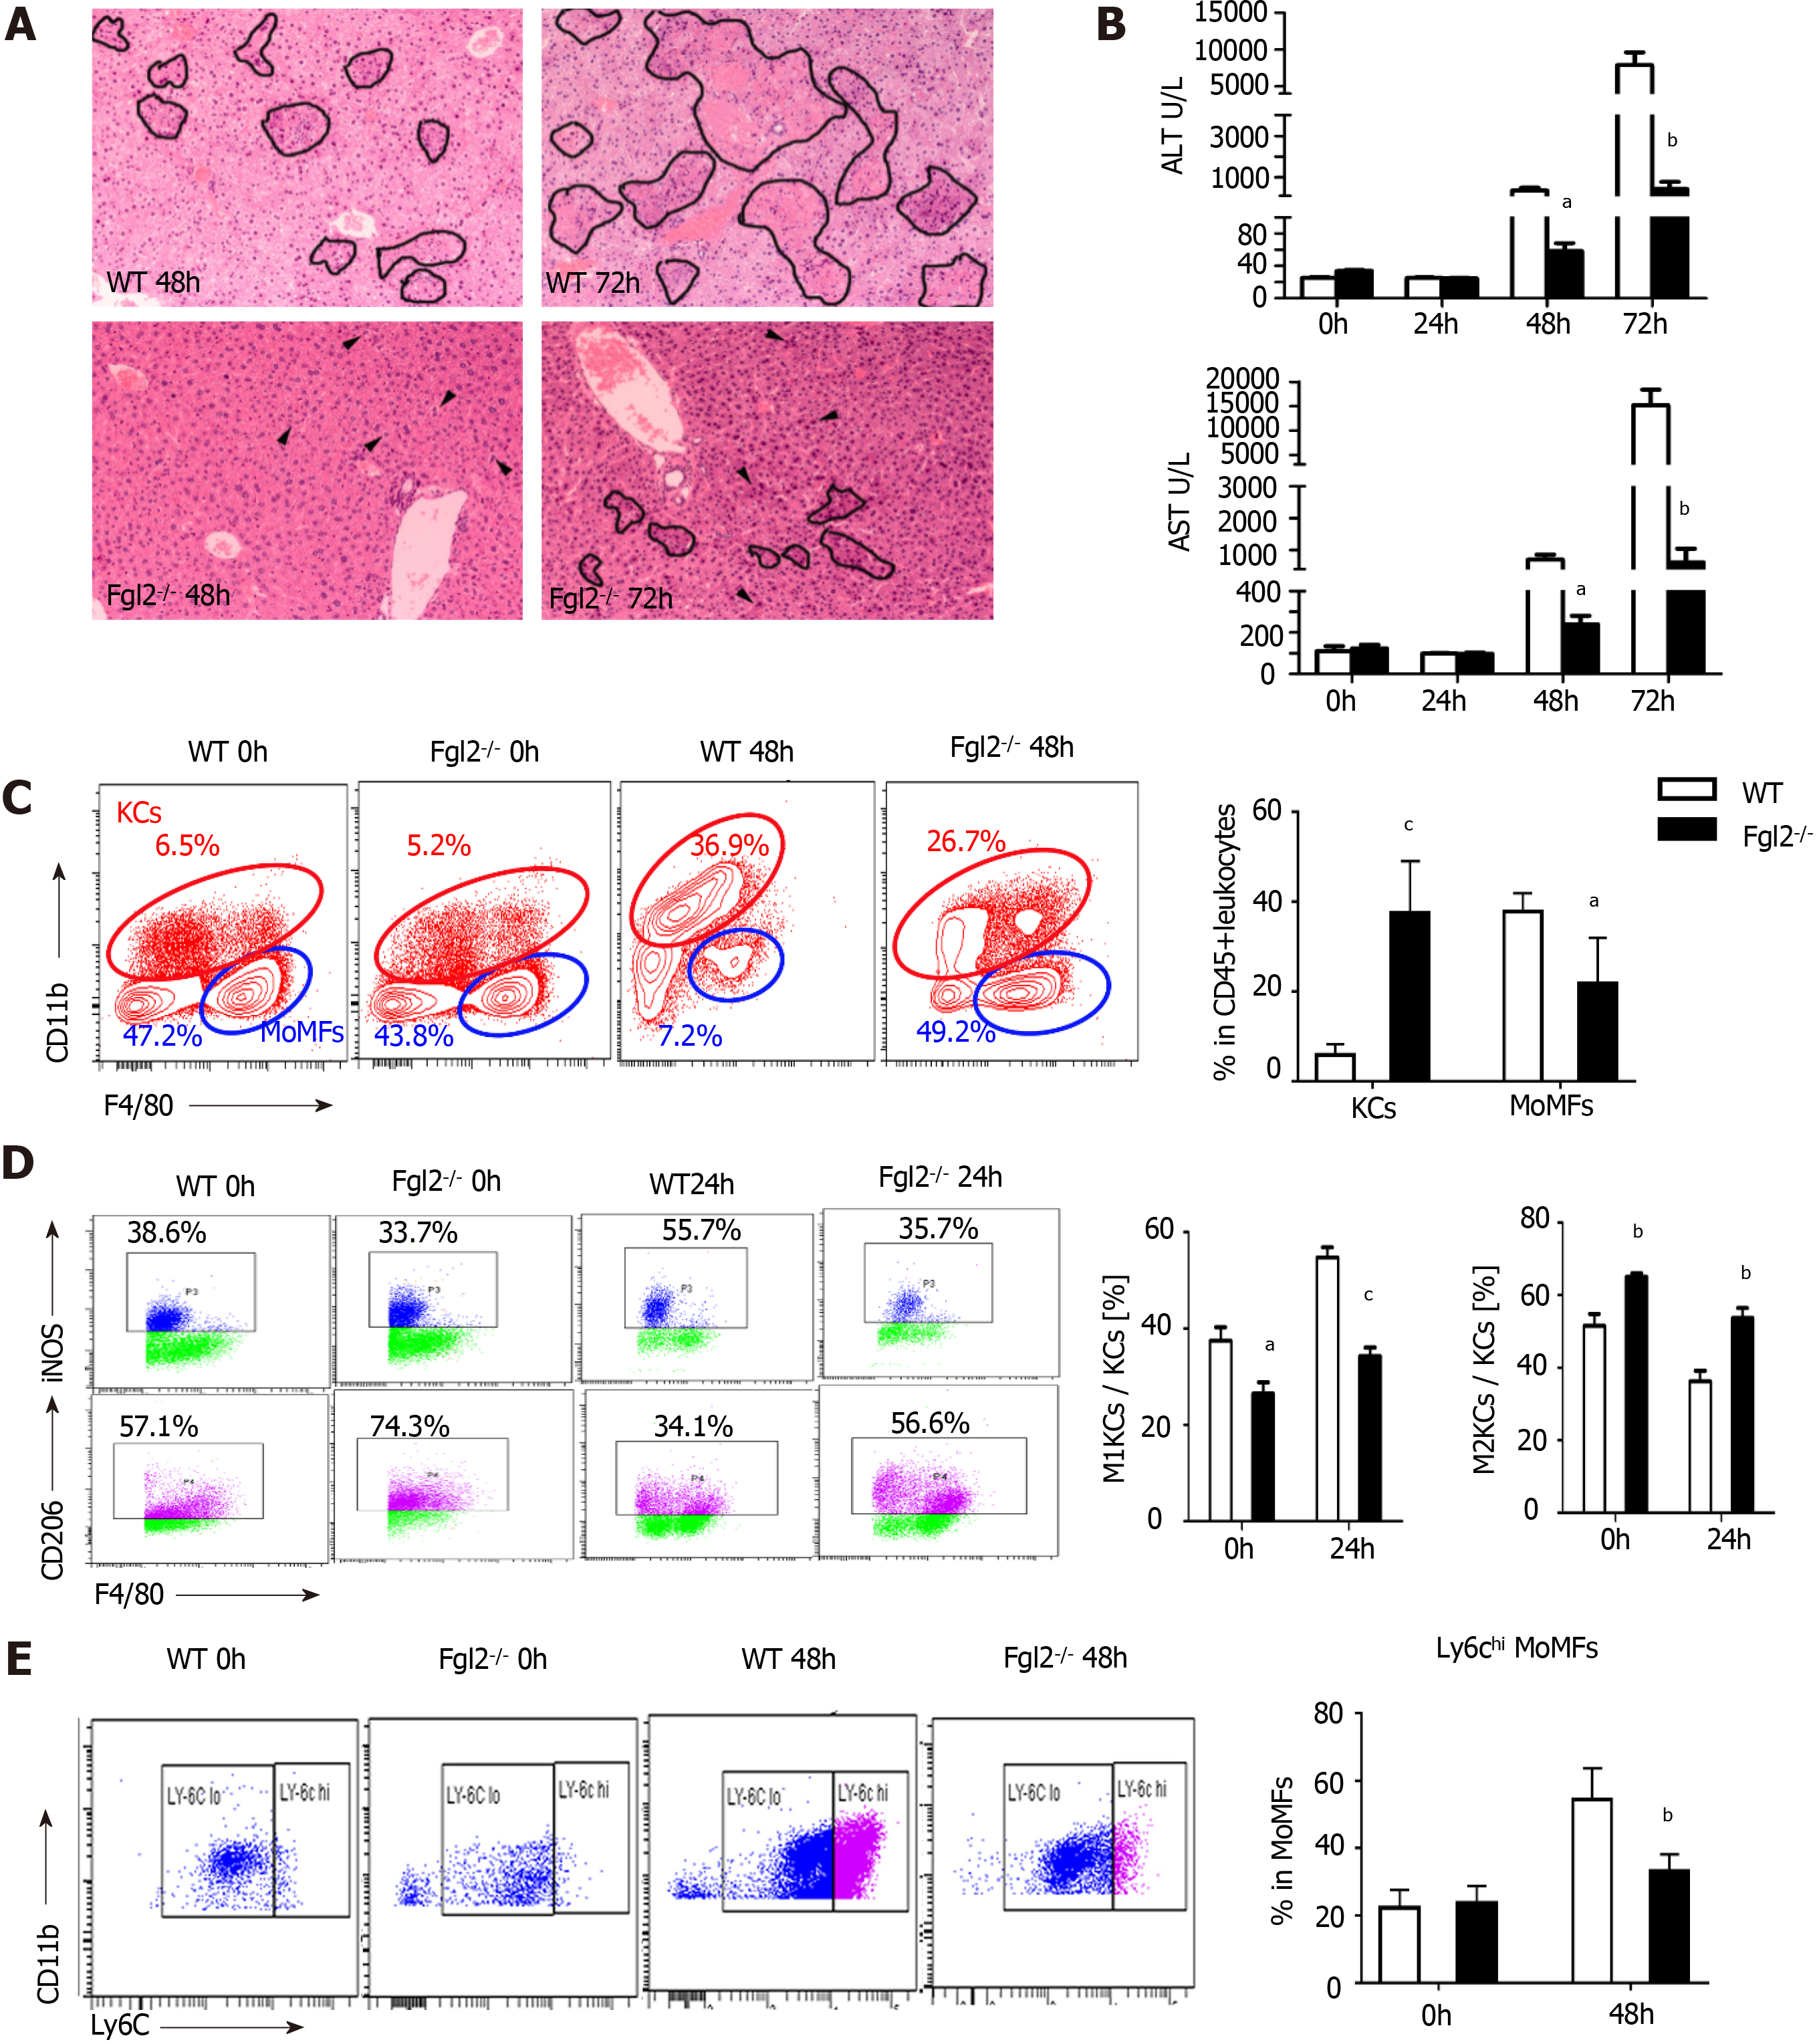
Figure 4 Fibrinogen-like protein 2 promotes pro-inflammatory macrophage polarization following murine hepatitis virus strain 3 infection.
A: H&E staining on liver sections from wild type (WT) and fibrinogen-like protein 2 (Fgl2-/-) mice at 48 and 72 h post viral infection. Circled field represented bulk necrosis. Arrows point to necrotic cells; B: Serum alanine transaminase and aspartate transaminase levels at 0, 24, 48, and 72 h post viral infection in WT and Fgl2-/- mice; C: Flow cytometry of KCs and MoMFs in hepatic CD45+ leukocytes at steady condition and 48 h following viral fulminant hepatitis in WT and Fgl2-/- mice (left); and respective frequency at 48 h post infection; D: Frequency of polarized M1 (iNOS+), M2 (CD206+) KCs at 0 and 24 h post murine hepatitis virus strain 3 (MHV-3) infection; E: Frequency of Ly6Chi and Ly6Clow MoMFs at 0 and 48 h post MHV-3 infection. Data are presented as mean ± SD (n = 5). These experiments were repeated at least three times.
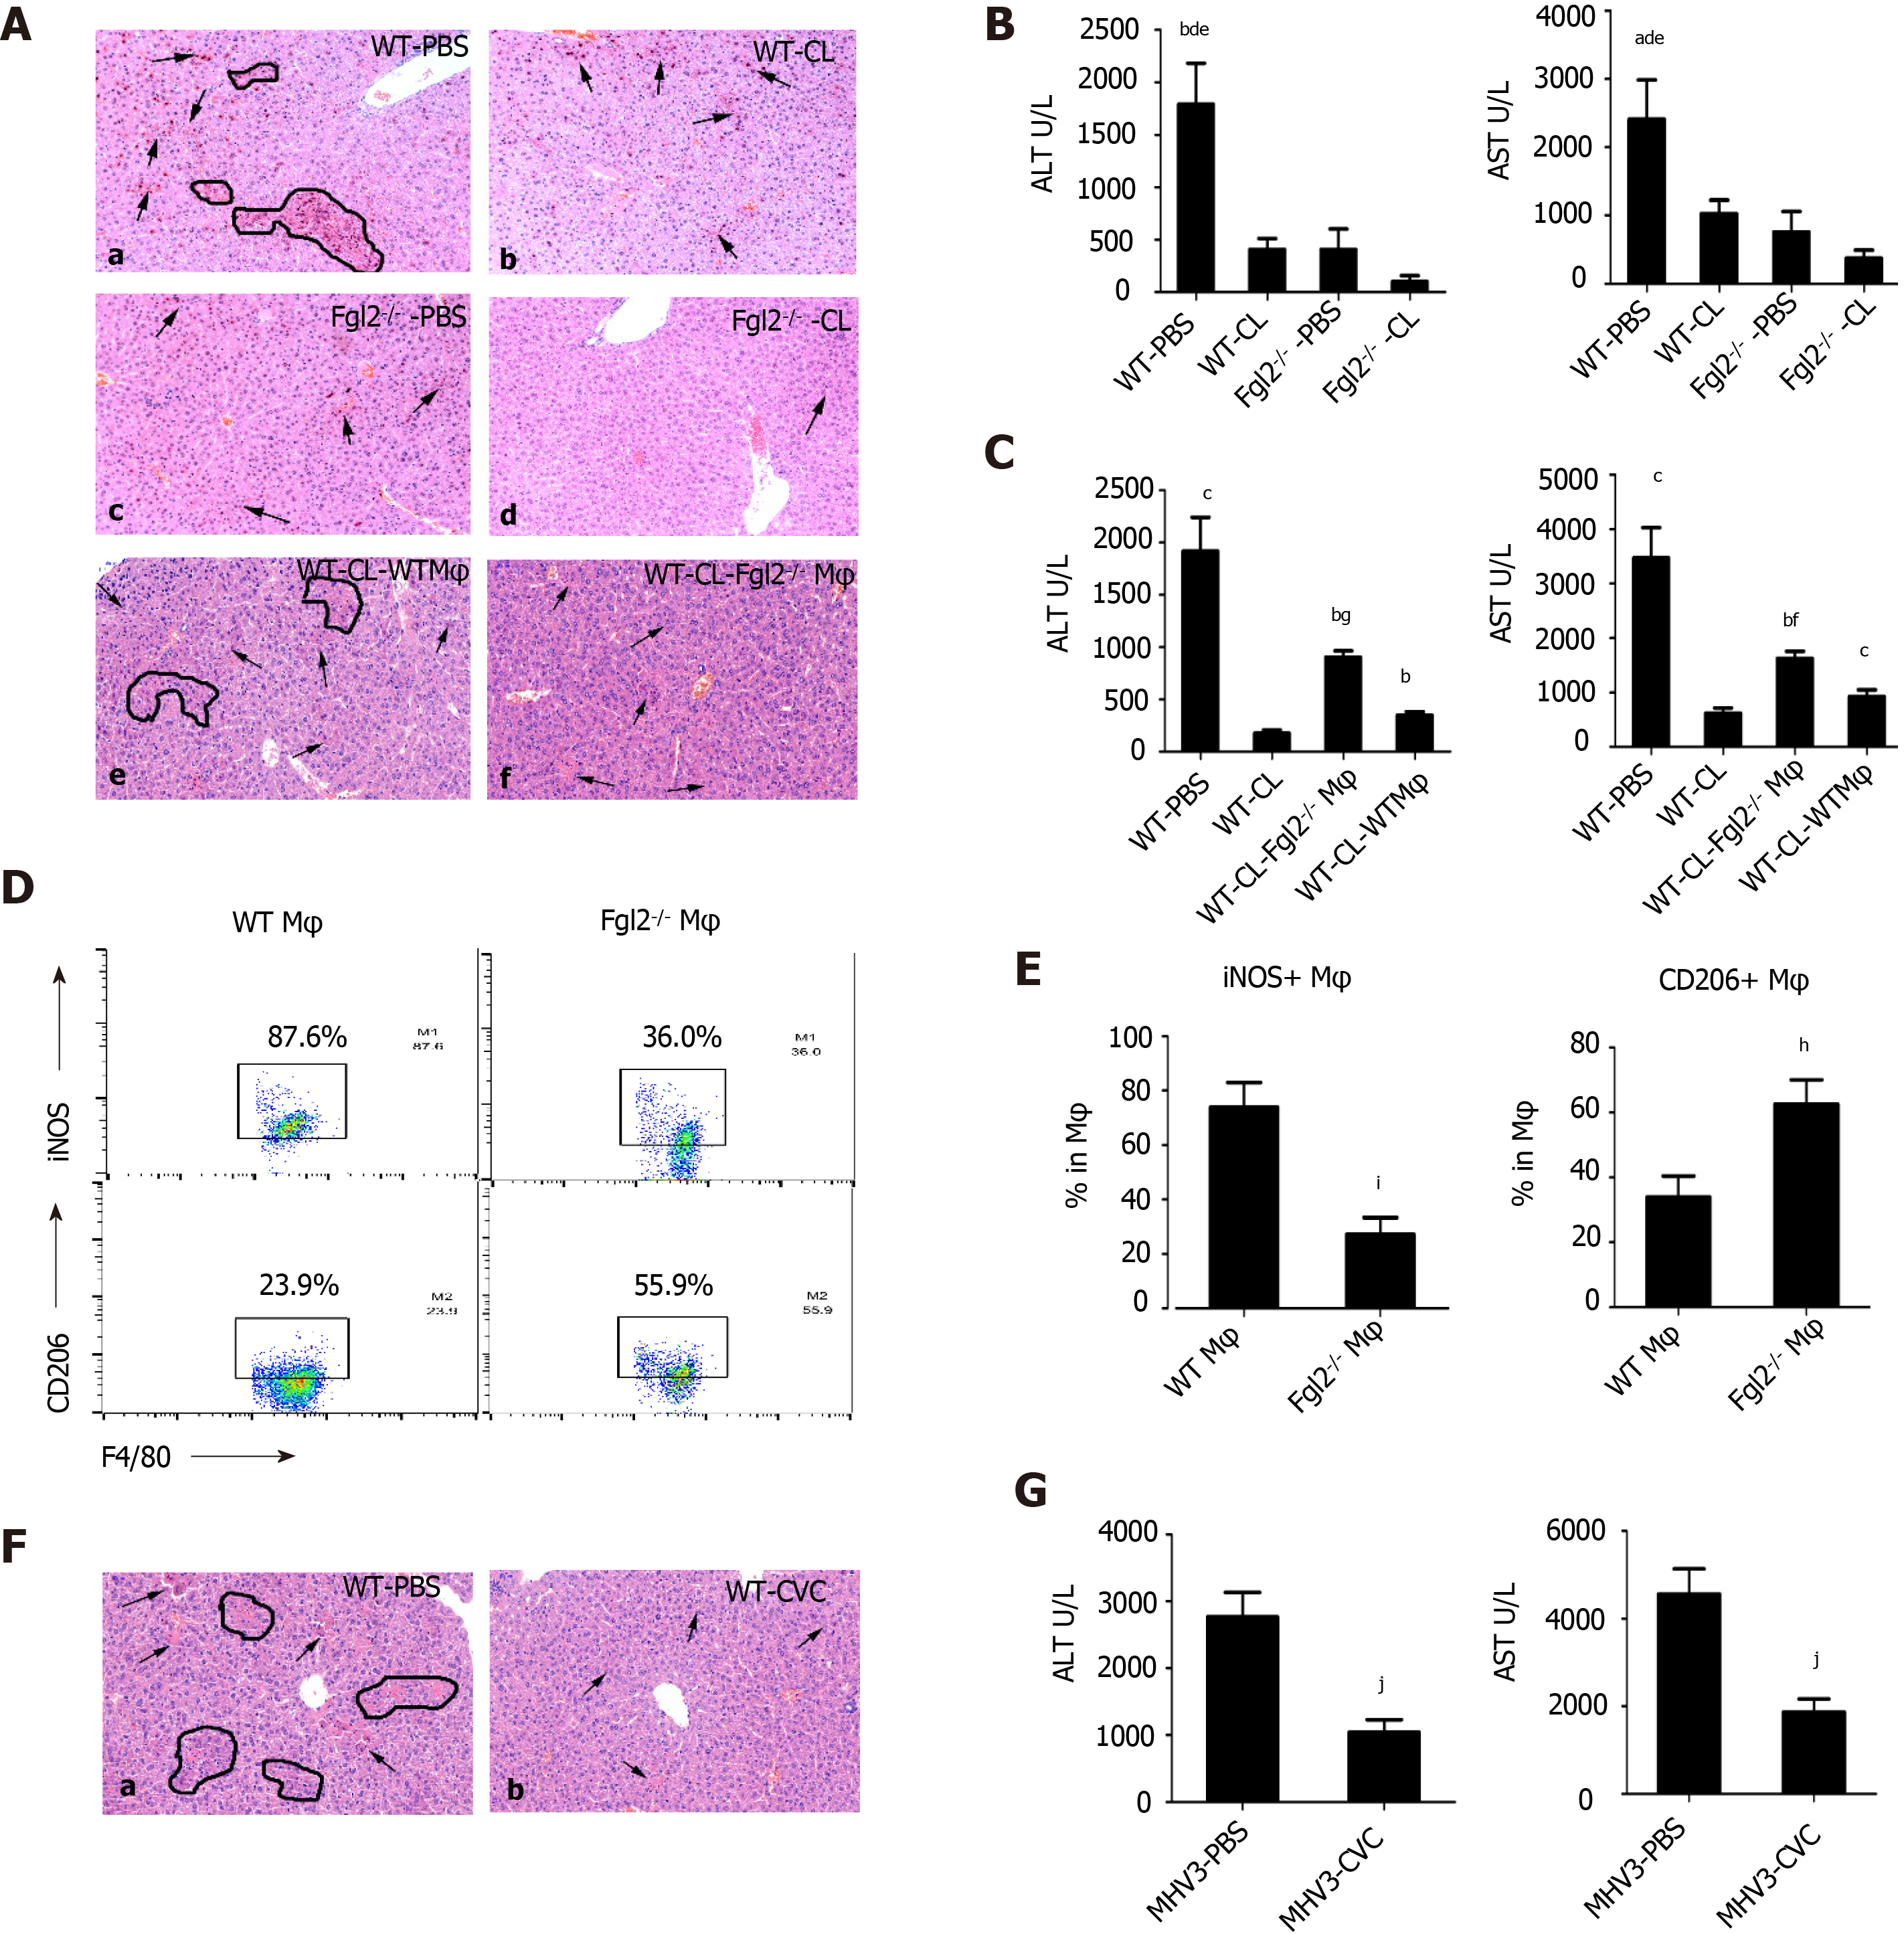
Figure 5 Depletion of macrophages in fibrinogen-like protein 2 synergically attenuated liver damage after viral infection.
A: H&E staining on liver sections from mice administered with either clodronate liposomes (CL) (b and d on the right) or PBS-liposomes (PBS) (a and c on the left) at 48 h post murine hepatitis virus strain 3 (MHV-3) infection; e-f, liver sections from bone marrow-derived macrophages (BMDMs) adoptive transferred mice at 48 h post MHV-3 infection (e: WT BMDM donor; f: Fibrinogen-like protein 2 (Fgl2-/-) BMDM donor); B: Serum ALT and AST levels from clodronate liposomes-treated WT and Fgl2-/- mice at 48 h post MHV-3 infection; C: Serum AST and ALT levels from WT and Fgl2-/- BMDM chimeric mice; D: representative F4/80+ iNOS+ and F4/80+ CD206+ donor macrophages from WT and Fgl2-/- BMDM chimeric mice at 48 h post infection; E: statistical analysis of iNOS+ and CD206+ donor macrophages in chimeric mice at 48 h post infection; F: H&E-stained liver section from mice which were treated with Cenicriviroc (CVC) in advance and subjected to MHV-3 infection for 48 h. Arrows represented necrotic cells, circles represent areas of hepatocyte necrosis. Image magnificence: 200×; G: aminotransferase levels of CVC treated viral fulminant hepatitis mice and its control. Data were presented as mean ± SD (n = 5). These experiments were repeated at least three times. BMDM: Bone marrow derived macrophages.
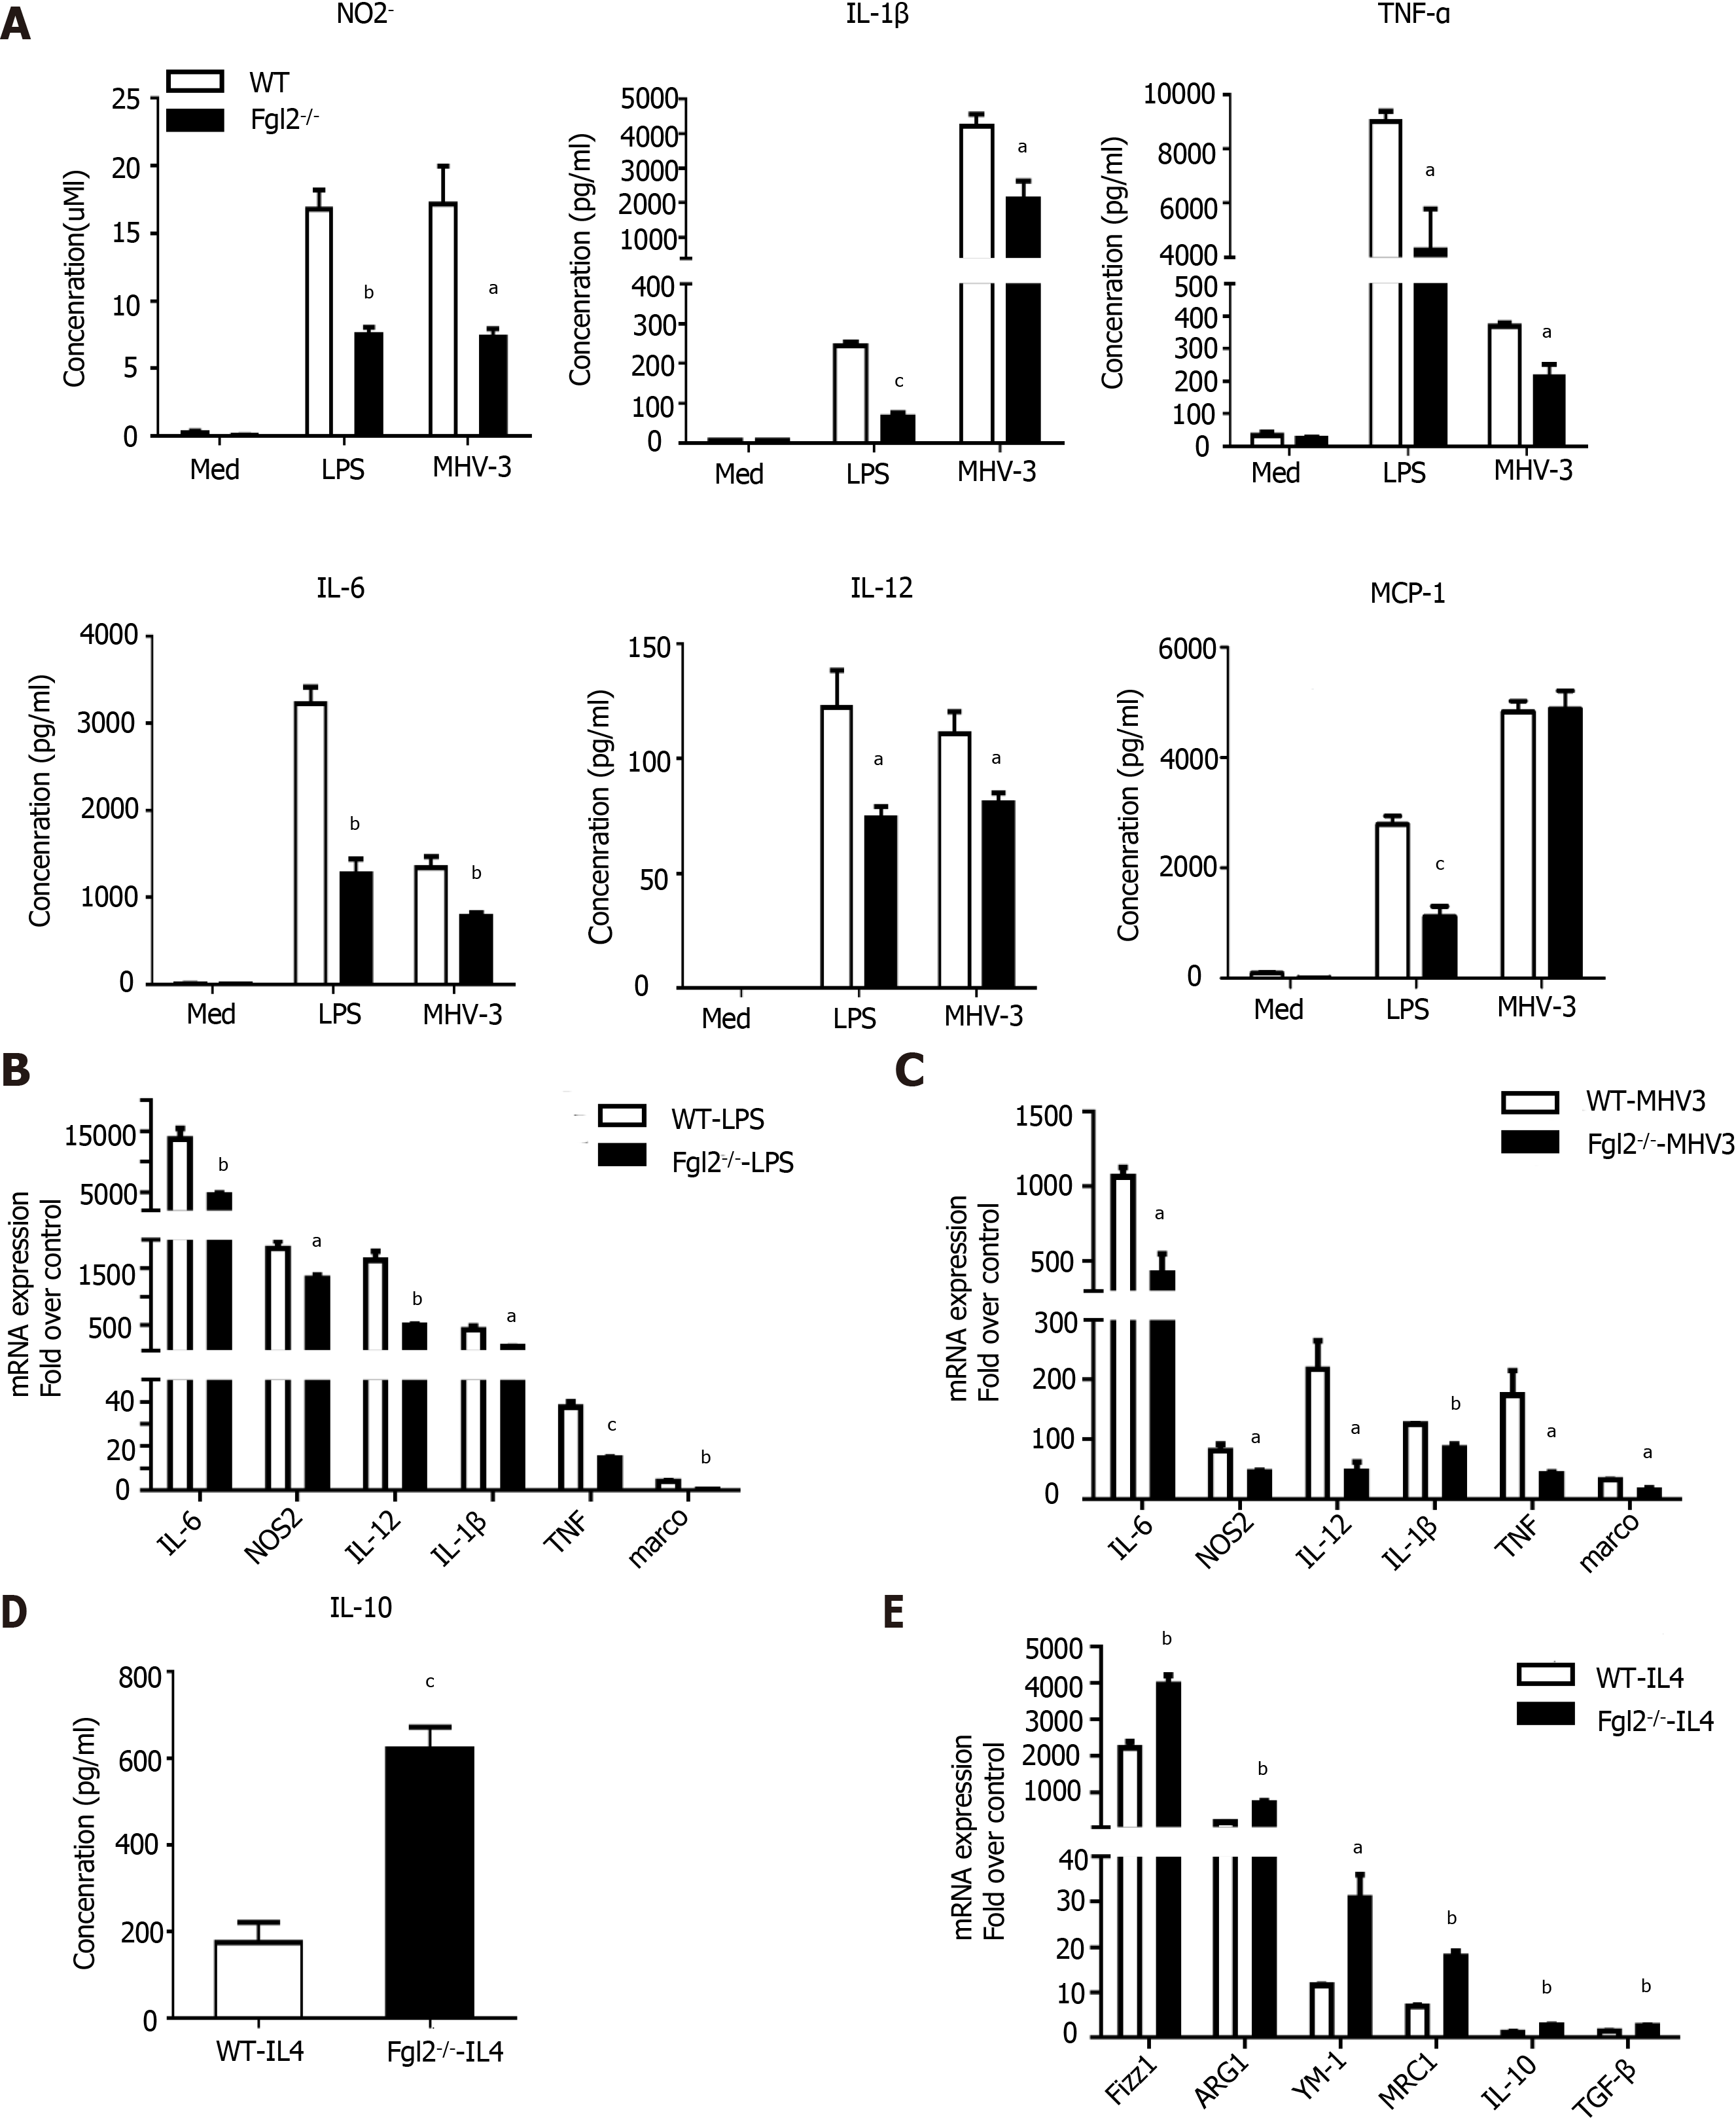
Figure 6 Fibrinogen-like protein 2 promoted bone marrow-derived macrophages M1 polarization in vitro.
A: Supernatant concentration of NO2-, IL-1β, TNF-α, IL -6, IL-12 and MCP-1 released by bone marrow-derived macrophages (BMDMs) after LPS (100 ng/mL) treatment or murine hepatitis virus strain 3 (MHV-3) infection for 24 h; B: Relative transcriptional level of M1 markers (NOS2, IL-6, IL-12, IL-1β, TNF-α and marco) of WT and fibrinogen-like protein 2 (Fgl2-/-) BMDMs after the stimulation of LPS for 6 hours; C: Relative transcriptional level of M1 markers of WT and Fgl2-/- BMDMs after MHV-3 infection for 8 hours; D: Supernatant IL-10 concentration of BMDMs culture after the IL-4 stimulation (20 ng/mL) for 72 h; E: mRNA expression of M2 markers (Fizz1, ARG1, YM-1, MRC1, IL-10 and TGF-β) of WT and Fgl2 -/- BMDMs after of IL-4 treatment for 72 h. All data are presented as mean ± SD (n > 3). These experiments were repeated at least three times.
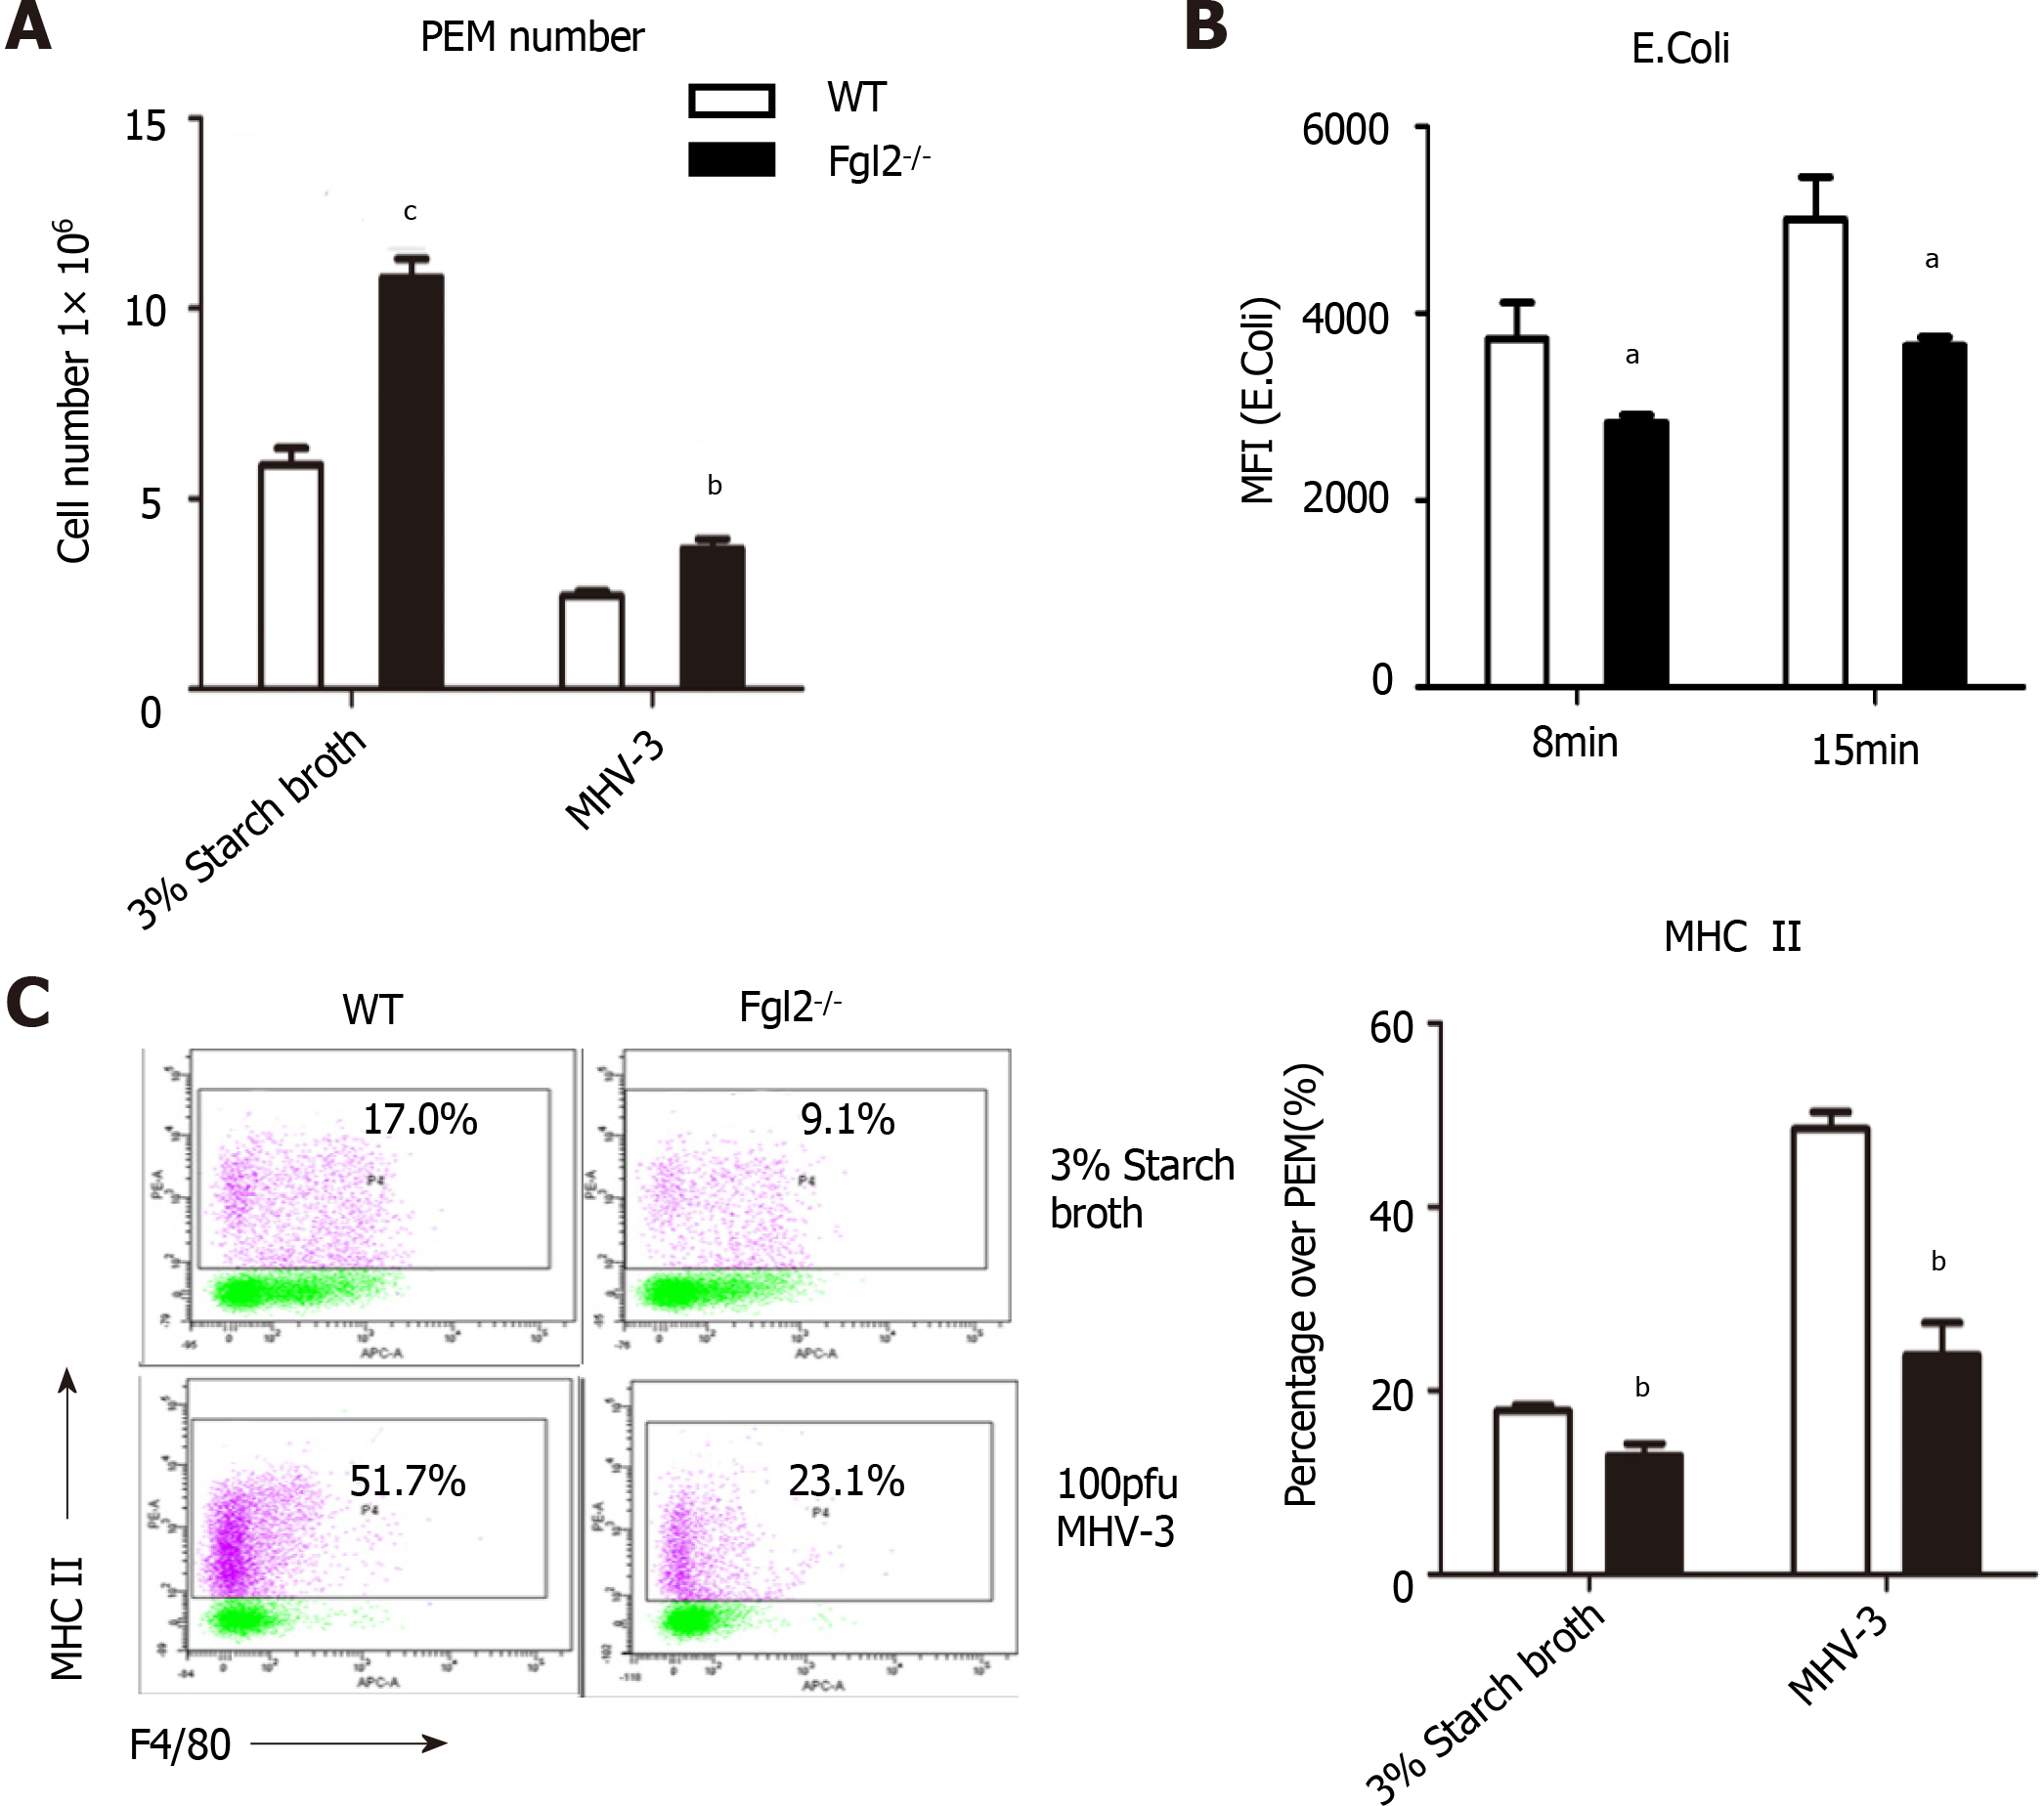
Figure 7 Fibrinogen-like protein 2 deficiency resulted in low expression of major histocompatibility complex II and impaired phagocytosis of macrophage.
A: Absolute number of PEMs under the stimulation of 3% starch broth or murine hepatitis virus strain 3 (MHV-3) extracted from wild-type (WT) and fibrinogen-like protein 2 (Fgl2-/-) mice; B: MFI of FITC+ phagocyted E.Coli by PEMs from WT and Fgl2-/- mice at different time points; C: Expression of major histocompatibility complex II on WT and Fgl2-/- PEMs under the stimulation of 3% starch broth or MHV-3 infection. All data are presented as mean ± SD. These experiments were repeated at least three times. PEMs: Peritoneal exudate macrophages.
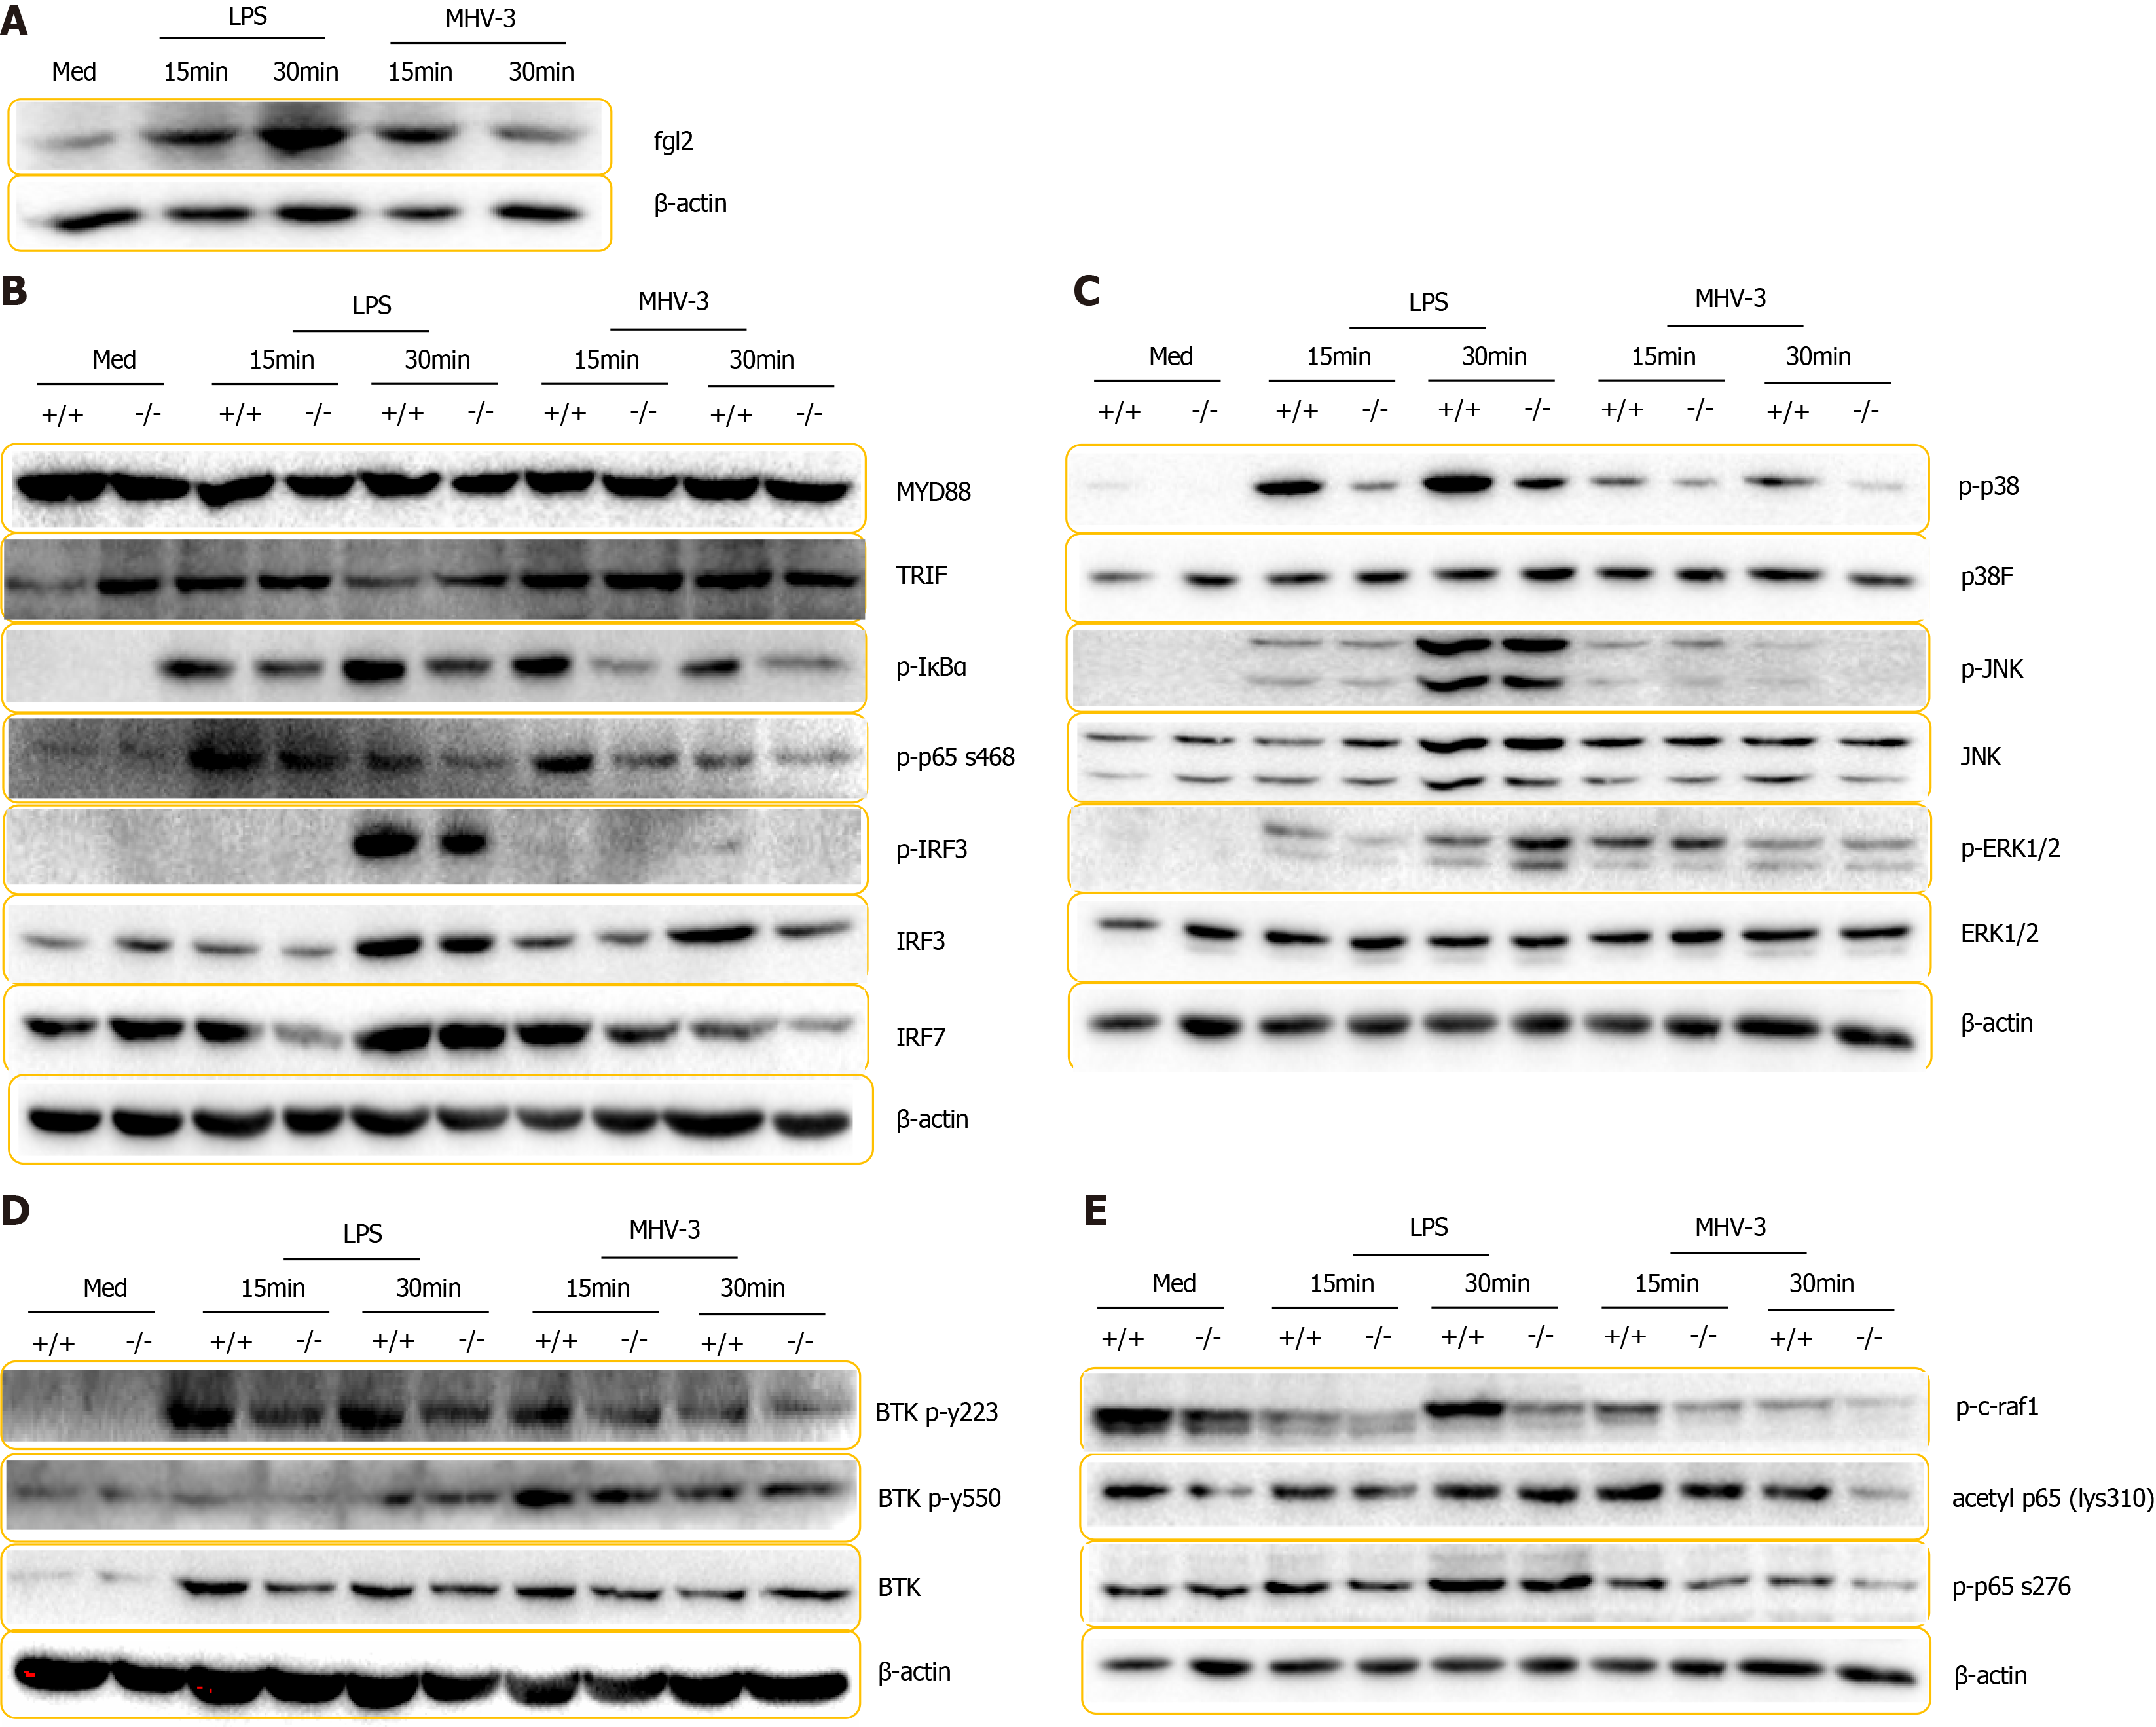
Figure 8 Fibrinogen-like protein 2 deficiency impaired inflammatory cascade in response to lipopolysaccharide treatment of viral infection.
A: Immunoblot for fibrinogen-like protein 2 (Fgl2) and β-actin expression in wild-type (WT) BMDMs in response lipopolysaccharide (LPS) stimulation and murine hepatitis virus strain 3 (MHV-3) infection. B-E: Immunoblot for proteins panels from lysates of WT and Fgl2-/- BMDMs in response to LPS treatment and MHV-3 infection; B: MyD88, TRIF, IκBα, phosphorylated IκBα, phosphorylated p65 (S468) and IRF3, phosphorylated IRF3, and IRF7; C: p38, JNK, ERK and phosphorylated p38, JNK, ERK; D: Phosphorylated c-Raf, phosphorylated p65 (S276), acetyl p65 (lys310); E: BTK, and phosphorylated BTK (Y223), BTK (Tyr550). These experiments were repeated at least three times.
- Citation: Xiao F, Wang HW, Hu JJ, Tao R, Weng XX, Wang P, Wu D, Wang XJ, Yan WM, Xi D, Luo XP, Wan XY, Ning Q. Fibrinogen-like protein 2 deficiency inhibits virus-induced fulminant hepatitis through abrogating inflammatory macrophage activation. World J Gastroenterol 2022; 28(4): 479-496
- URL: https://www.wjgnet.com/1007-9327/full/v28/i4/479.htm
- DOI: https://dx.doi.org/10.3748/wjg.v28.i4.479


