Copyright
©The Author(s) 2022.
World J Gastroenterol. Oct 21, 2022; 28(39): 5764-5783
Published online Oct 21, 2022. doi: 10.3748/wjg.v28.i39.5764
Published online Oct 21, 2022. doi: 10.3748/wjg.v28.i39.5764
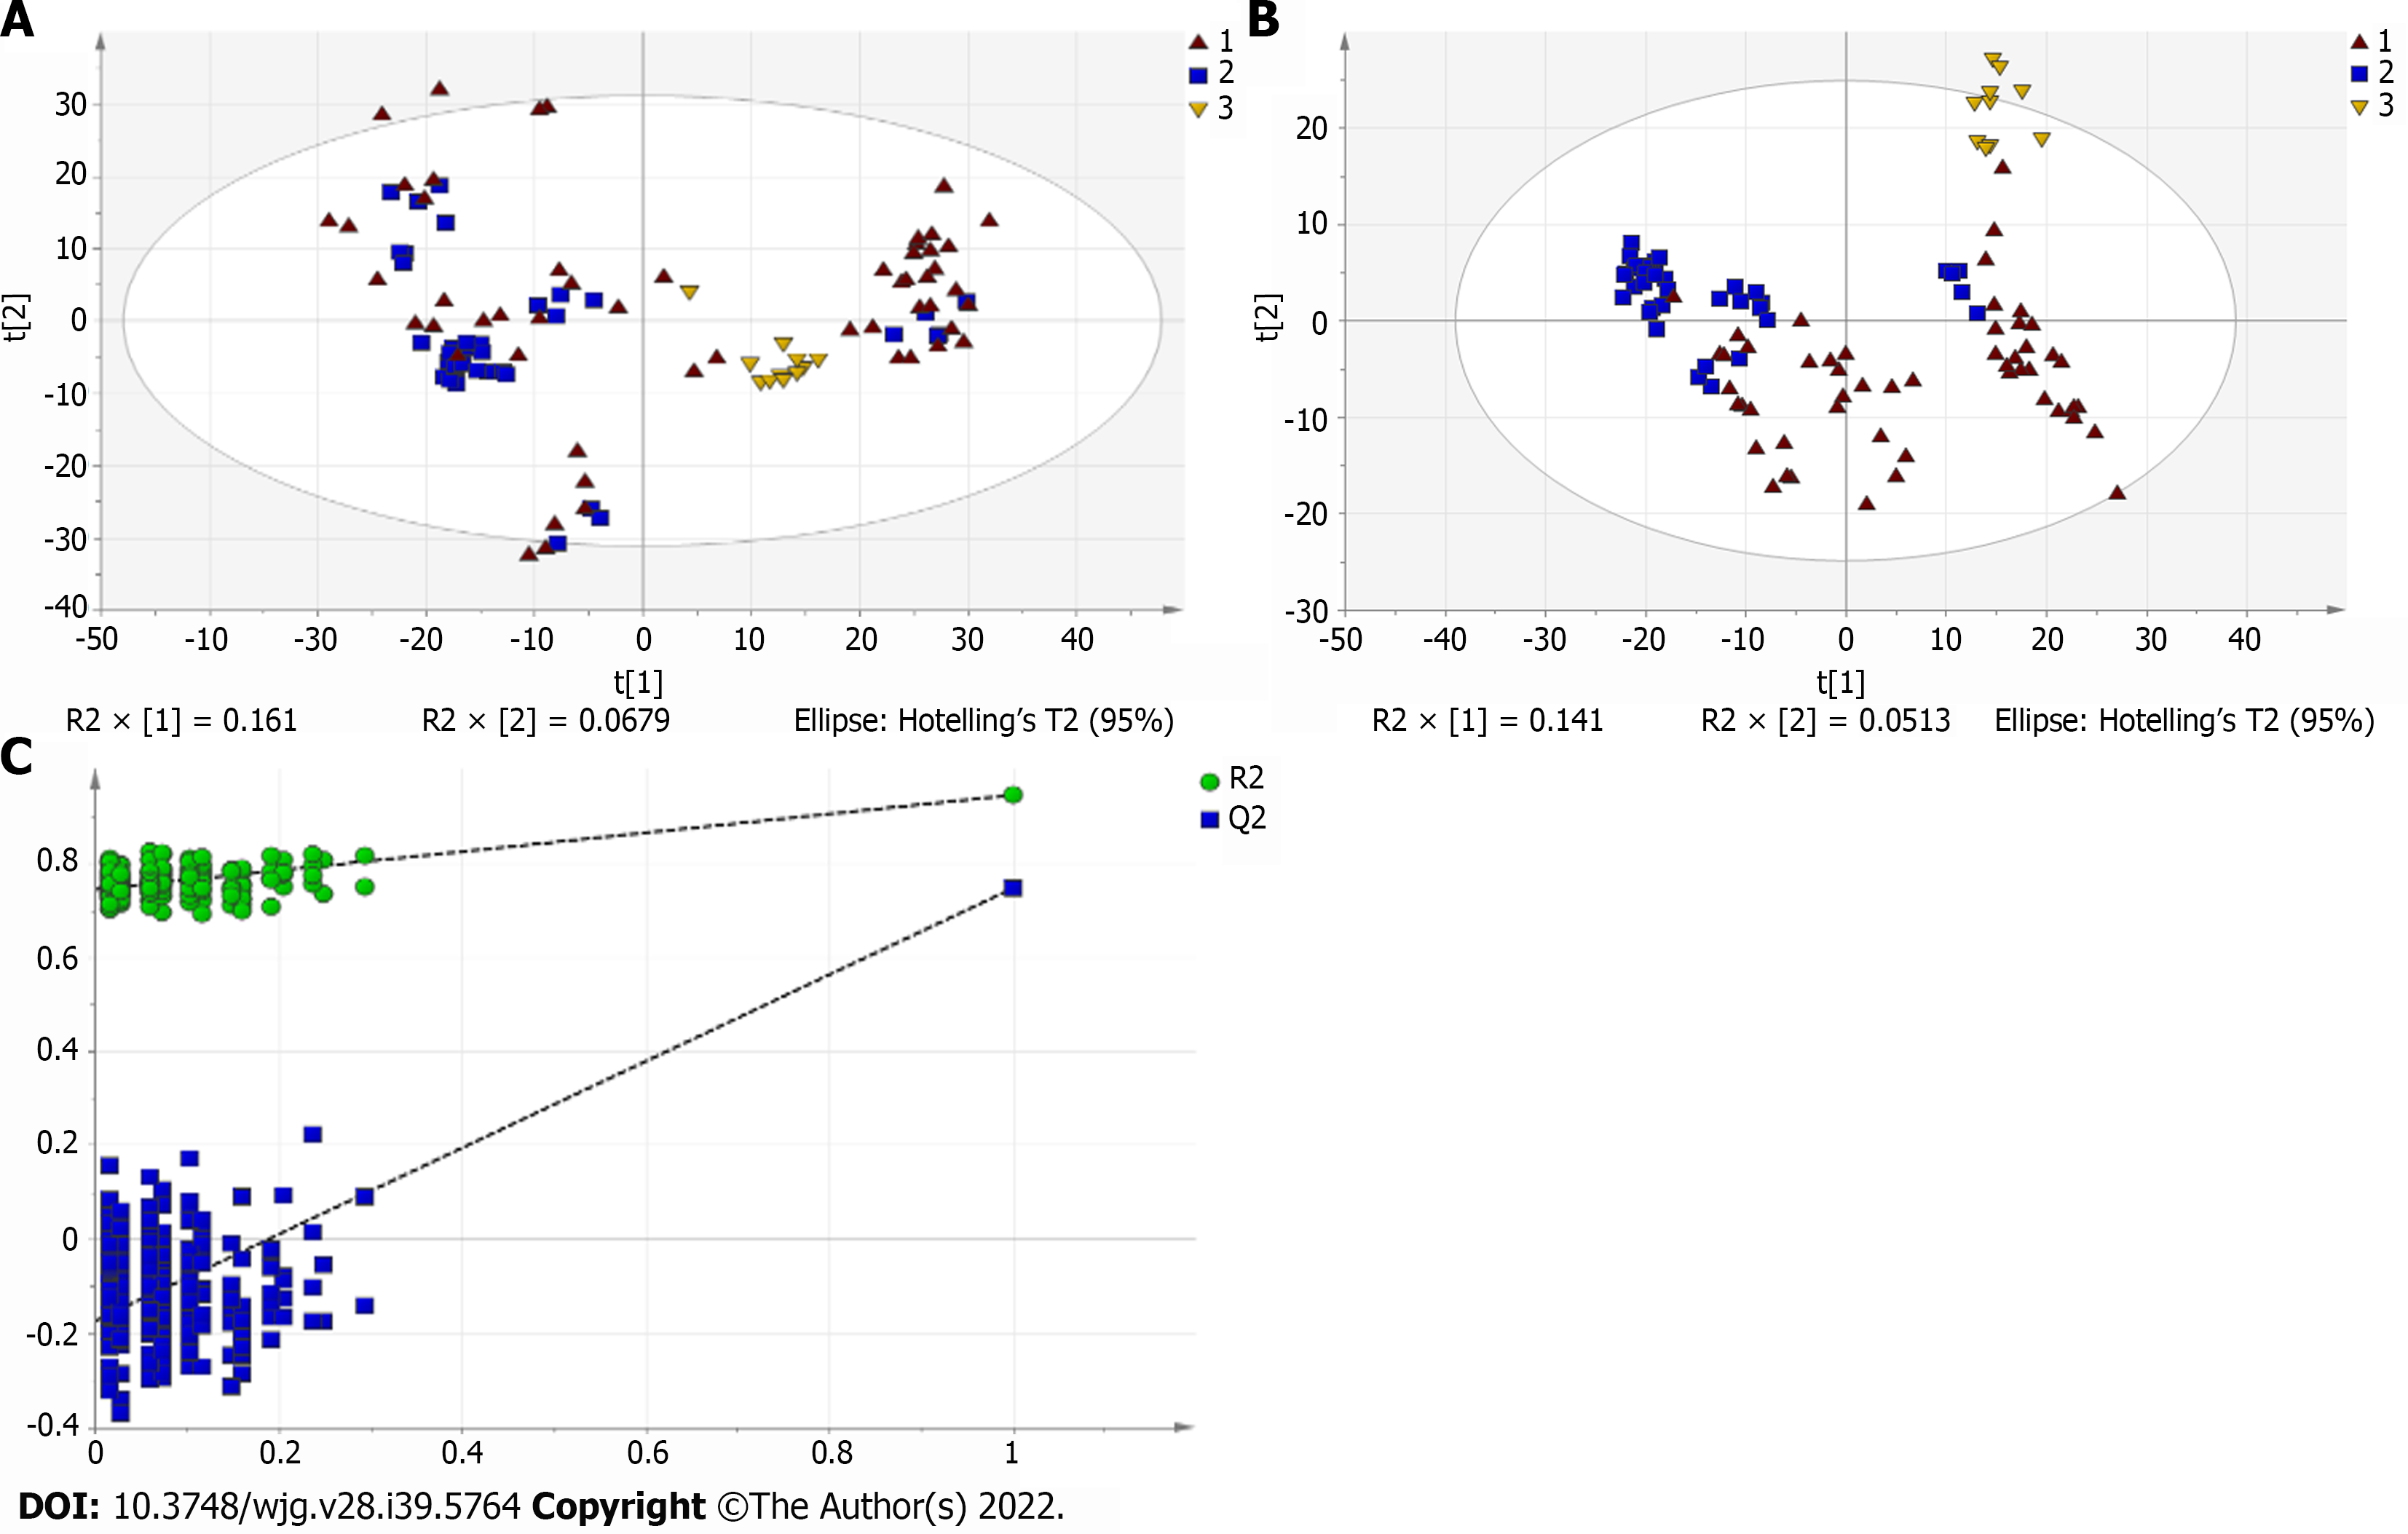
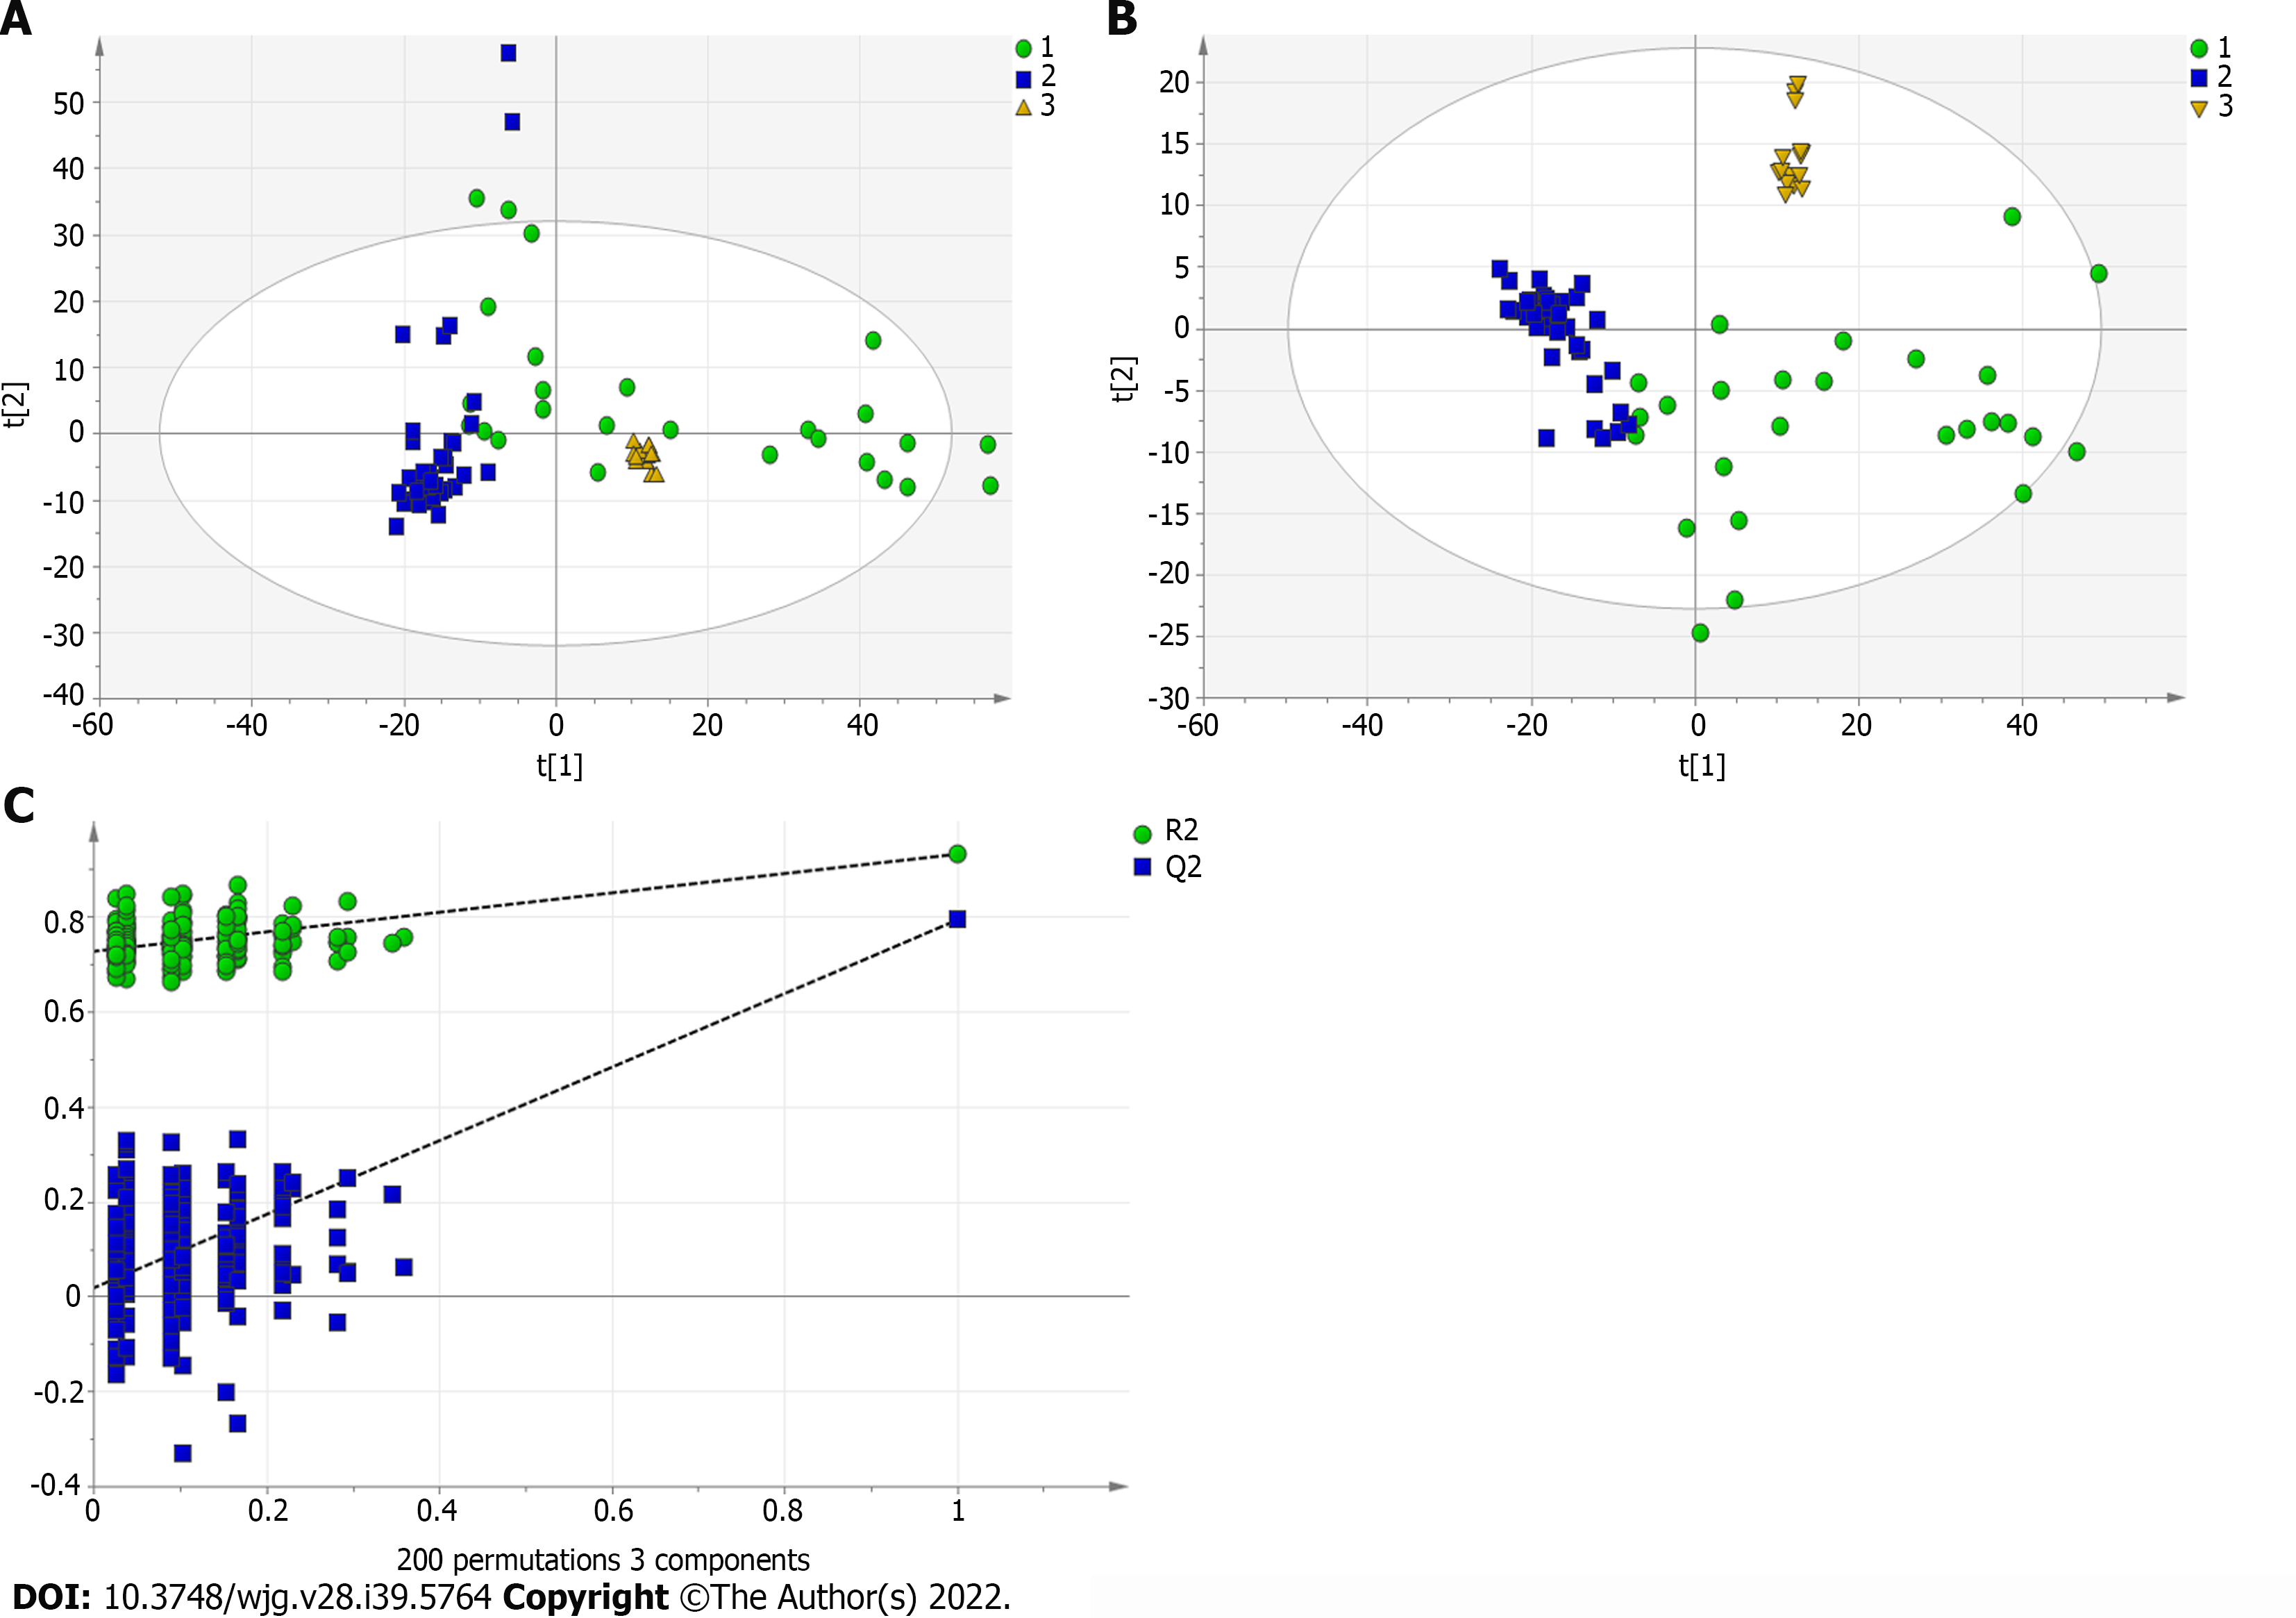
Figure 1 Multivariate statistical analysis on serum profiling data in positive ions between primary biliary cholangitis and control.
A: Plots of principal component analysis (PCA) in positive ion mode. (1) Primary biliary cholangitis (PBC); (2) Control; and (3) Quality control (QC); B: Scatter plots of partial least squares-discriminant analysis (PLS-DA) with a positive model of serum from patients with PBC, autoimmune hepatitis and healthy controls. (1) PBC; (2) Control; and (3) QC; C: Validation plot of the original PLS-DA with a positive model, strongly indicating that the original model is valid and shows signs of overfitting. The permutation test was repeated 200 times in the cross-validation plot.
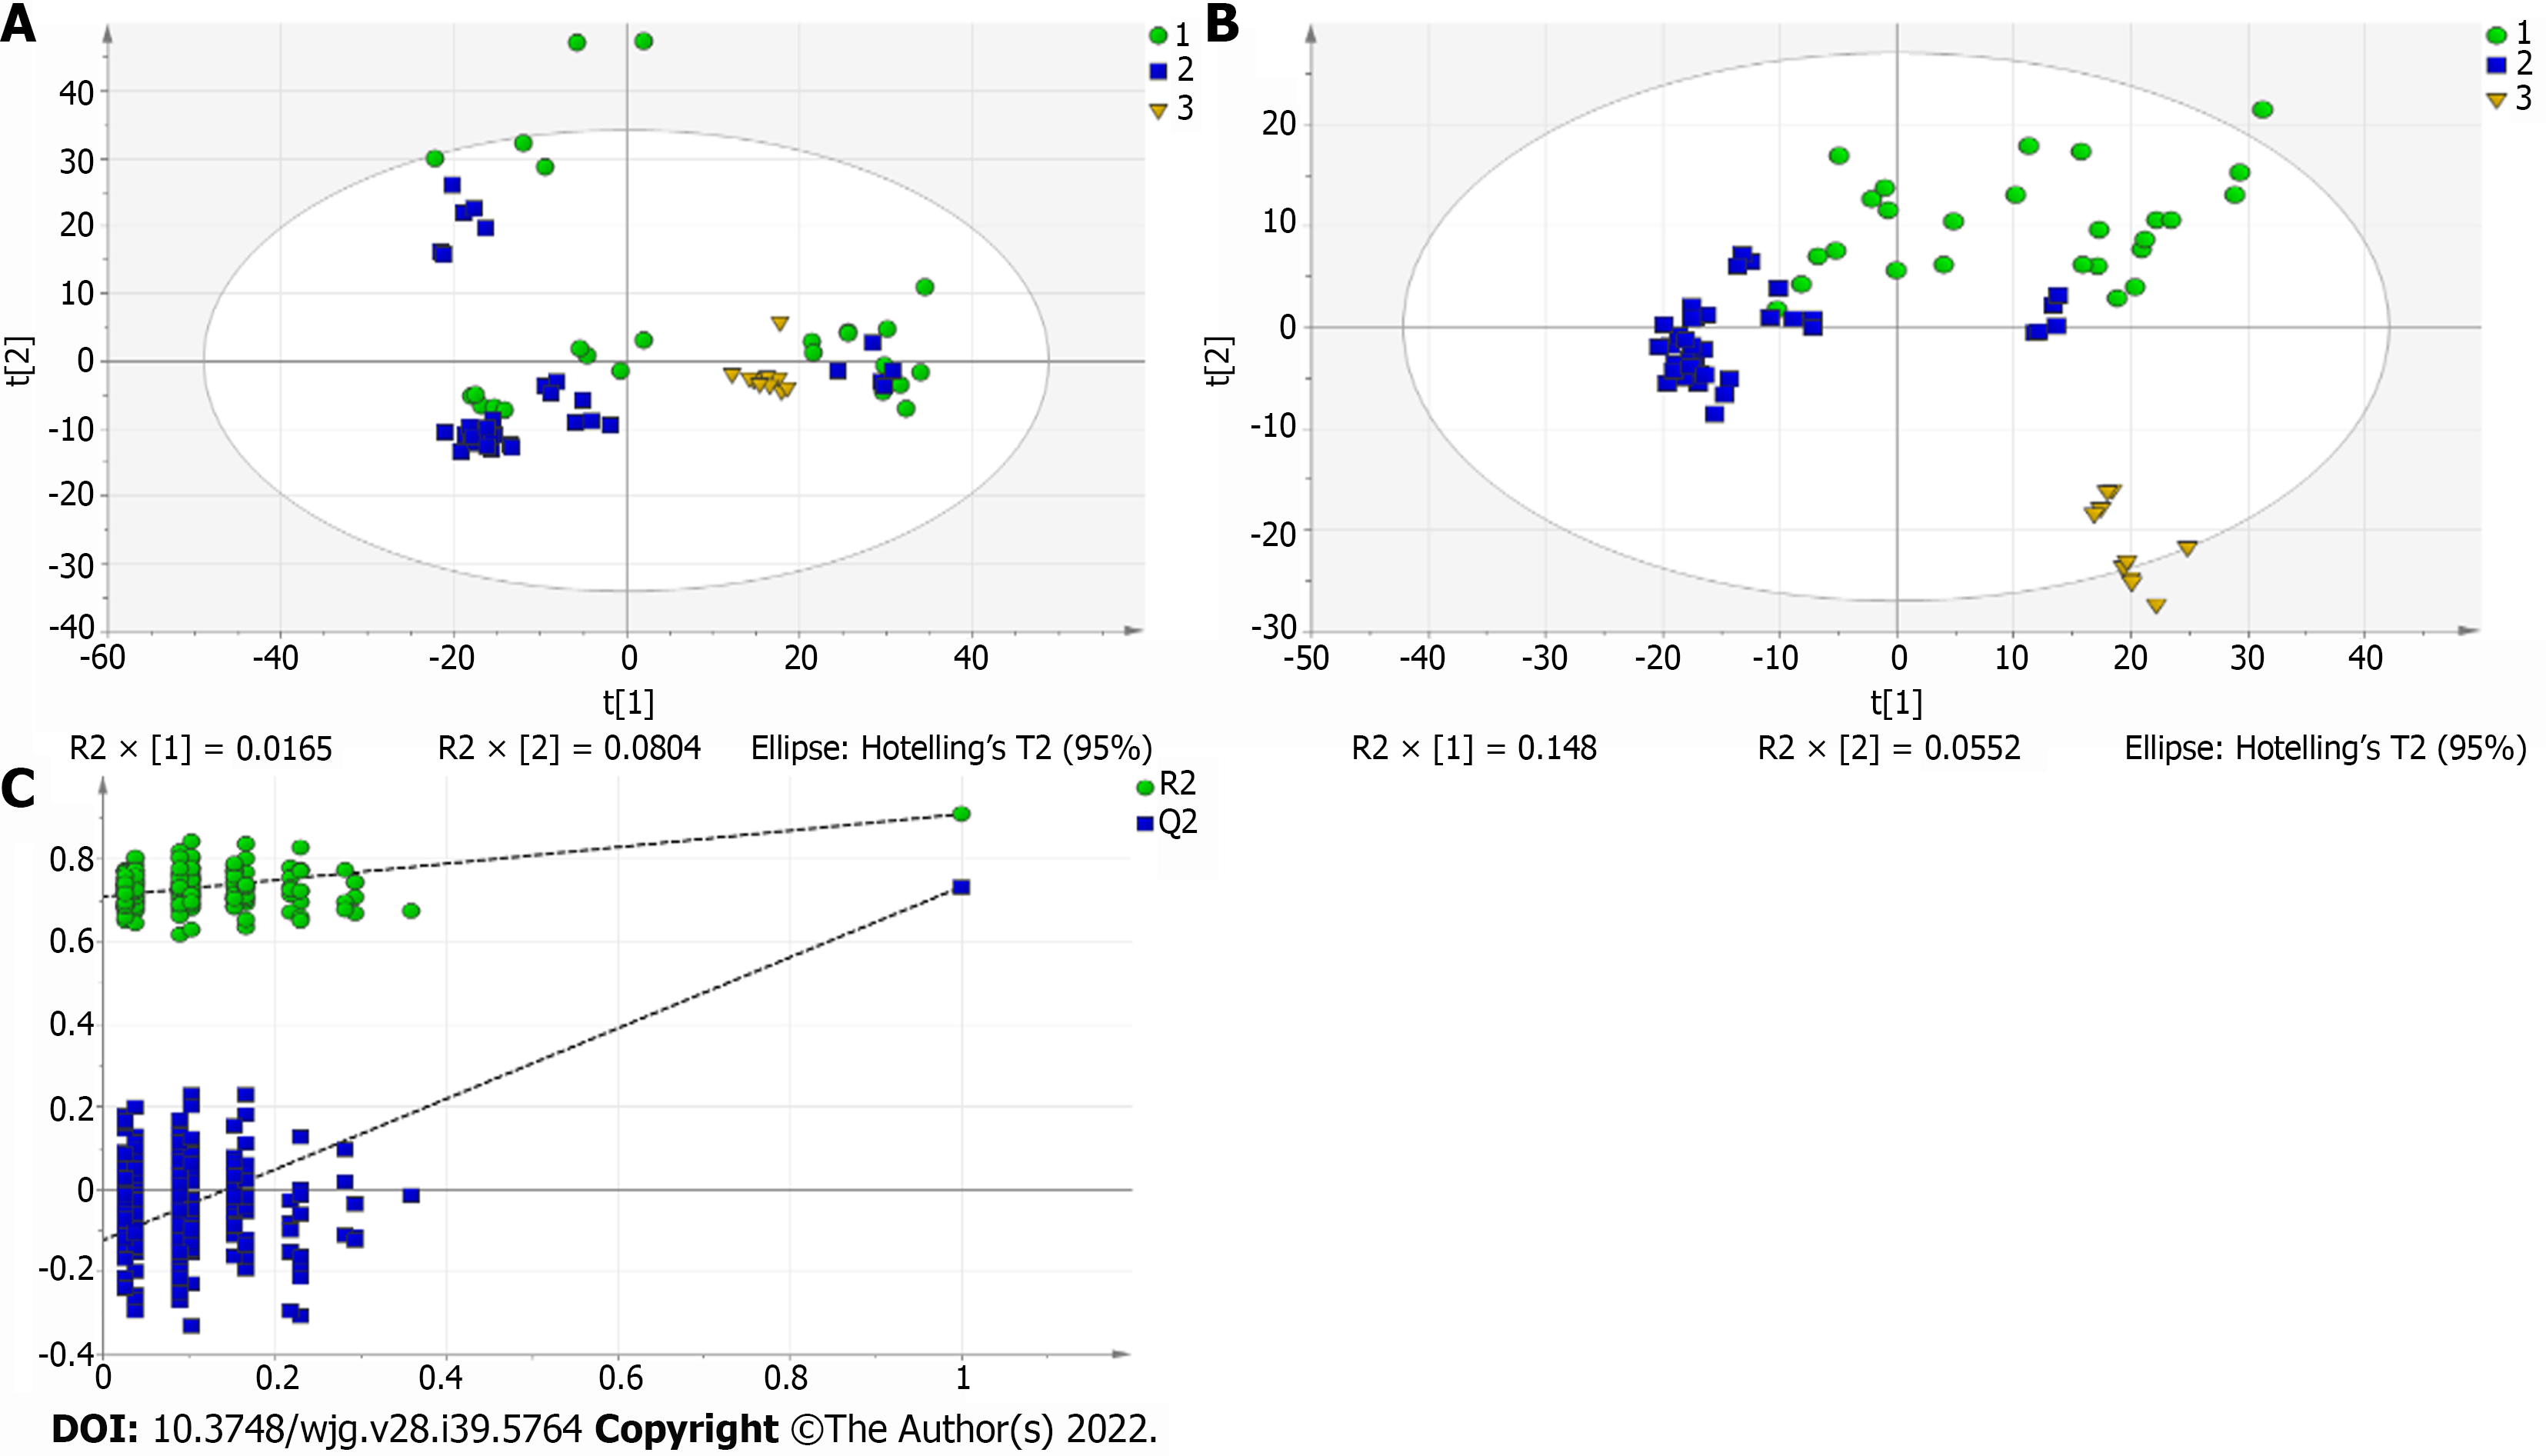
Figure 2 Multivariate statistical analysis on serum profiling data in positive ions between autoimmune hepatitis and control.
A: Plots of principal component analysis in positive ion mode. (1) Autoimmune hepatitis (AIH); (2) Control; and (3) Quality control (QC); B: Scatter plots of partial least squares-discriminant analysis (PLS-DA) with a positive model of serum from patients with primary biliary cholangitis (PBC), AIH and healthy controls. (1) PBC; (2) Control; and (3) QC; C: Validation plot of the original PLS-DA with a positive model, strongly indicating that the original model is valid and shows signs of overfitting. The permutation test was repeated 200 times in the cross-validation plot.
Figure 3 Multivariate statistical analysis on serum profiling data in positive ions between primary biliary cholangitis and autoimmune hepatitis.
A: Plots of principal component analysis in positive ion mode. (1) Autoimmune hepatitis (AIH); (2) Primary biliary cholangitis (PBC); and (3) Quality control; B: Scatter plots of partial least squares-discriminant analysis (PLS-DA) with a positive model of serum from patients with PBC, AIH and healthy controls. (1) PBC; and (2) AIH; C: Validation plot of the original PLS-DA with a positive model, strongly indicating that the original model is valid and shows signs of overfitting. The permutation test was repeated 200 times in the cross-validation plot.
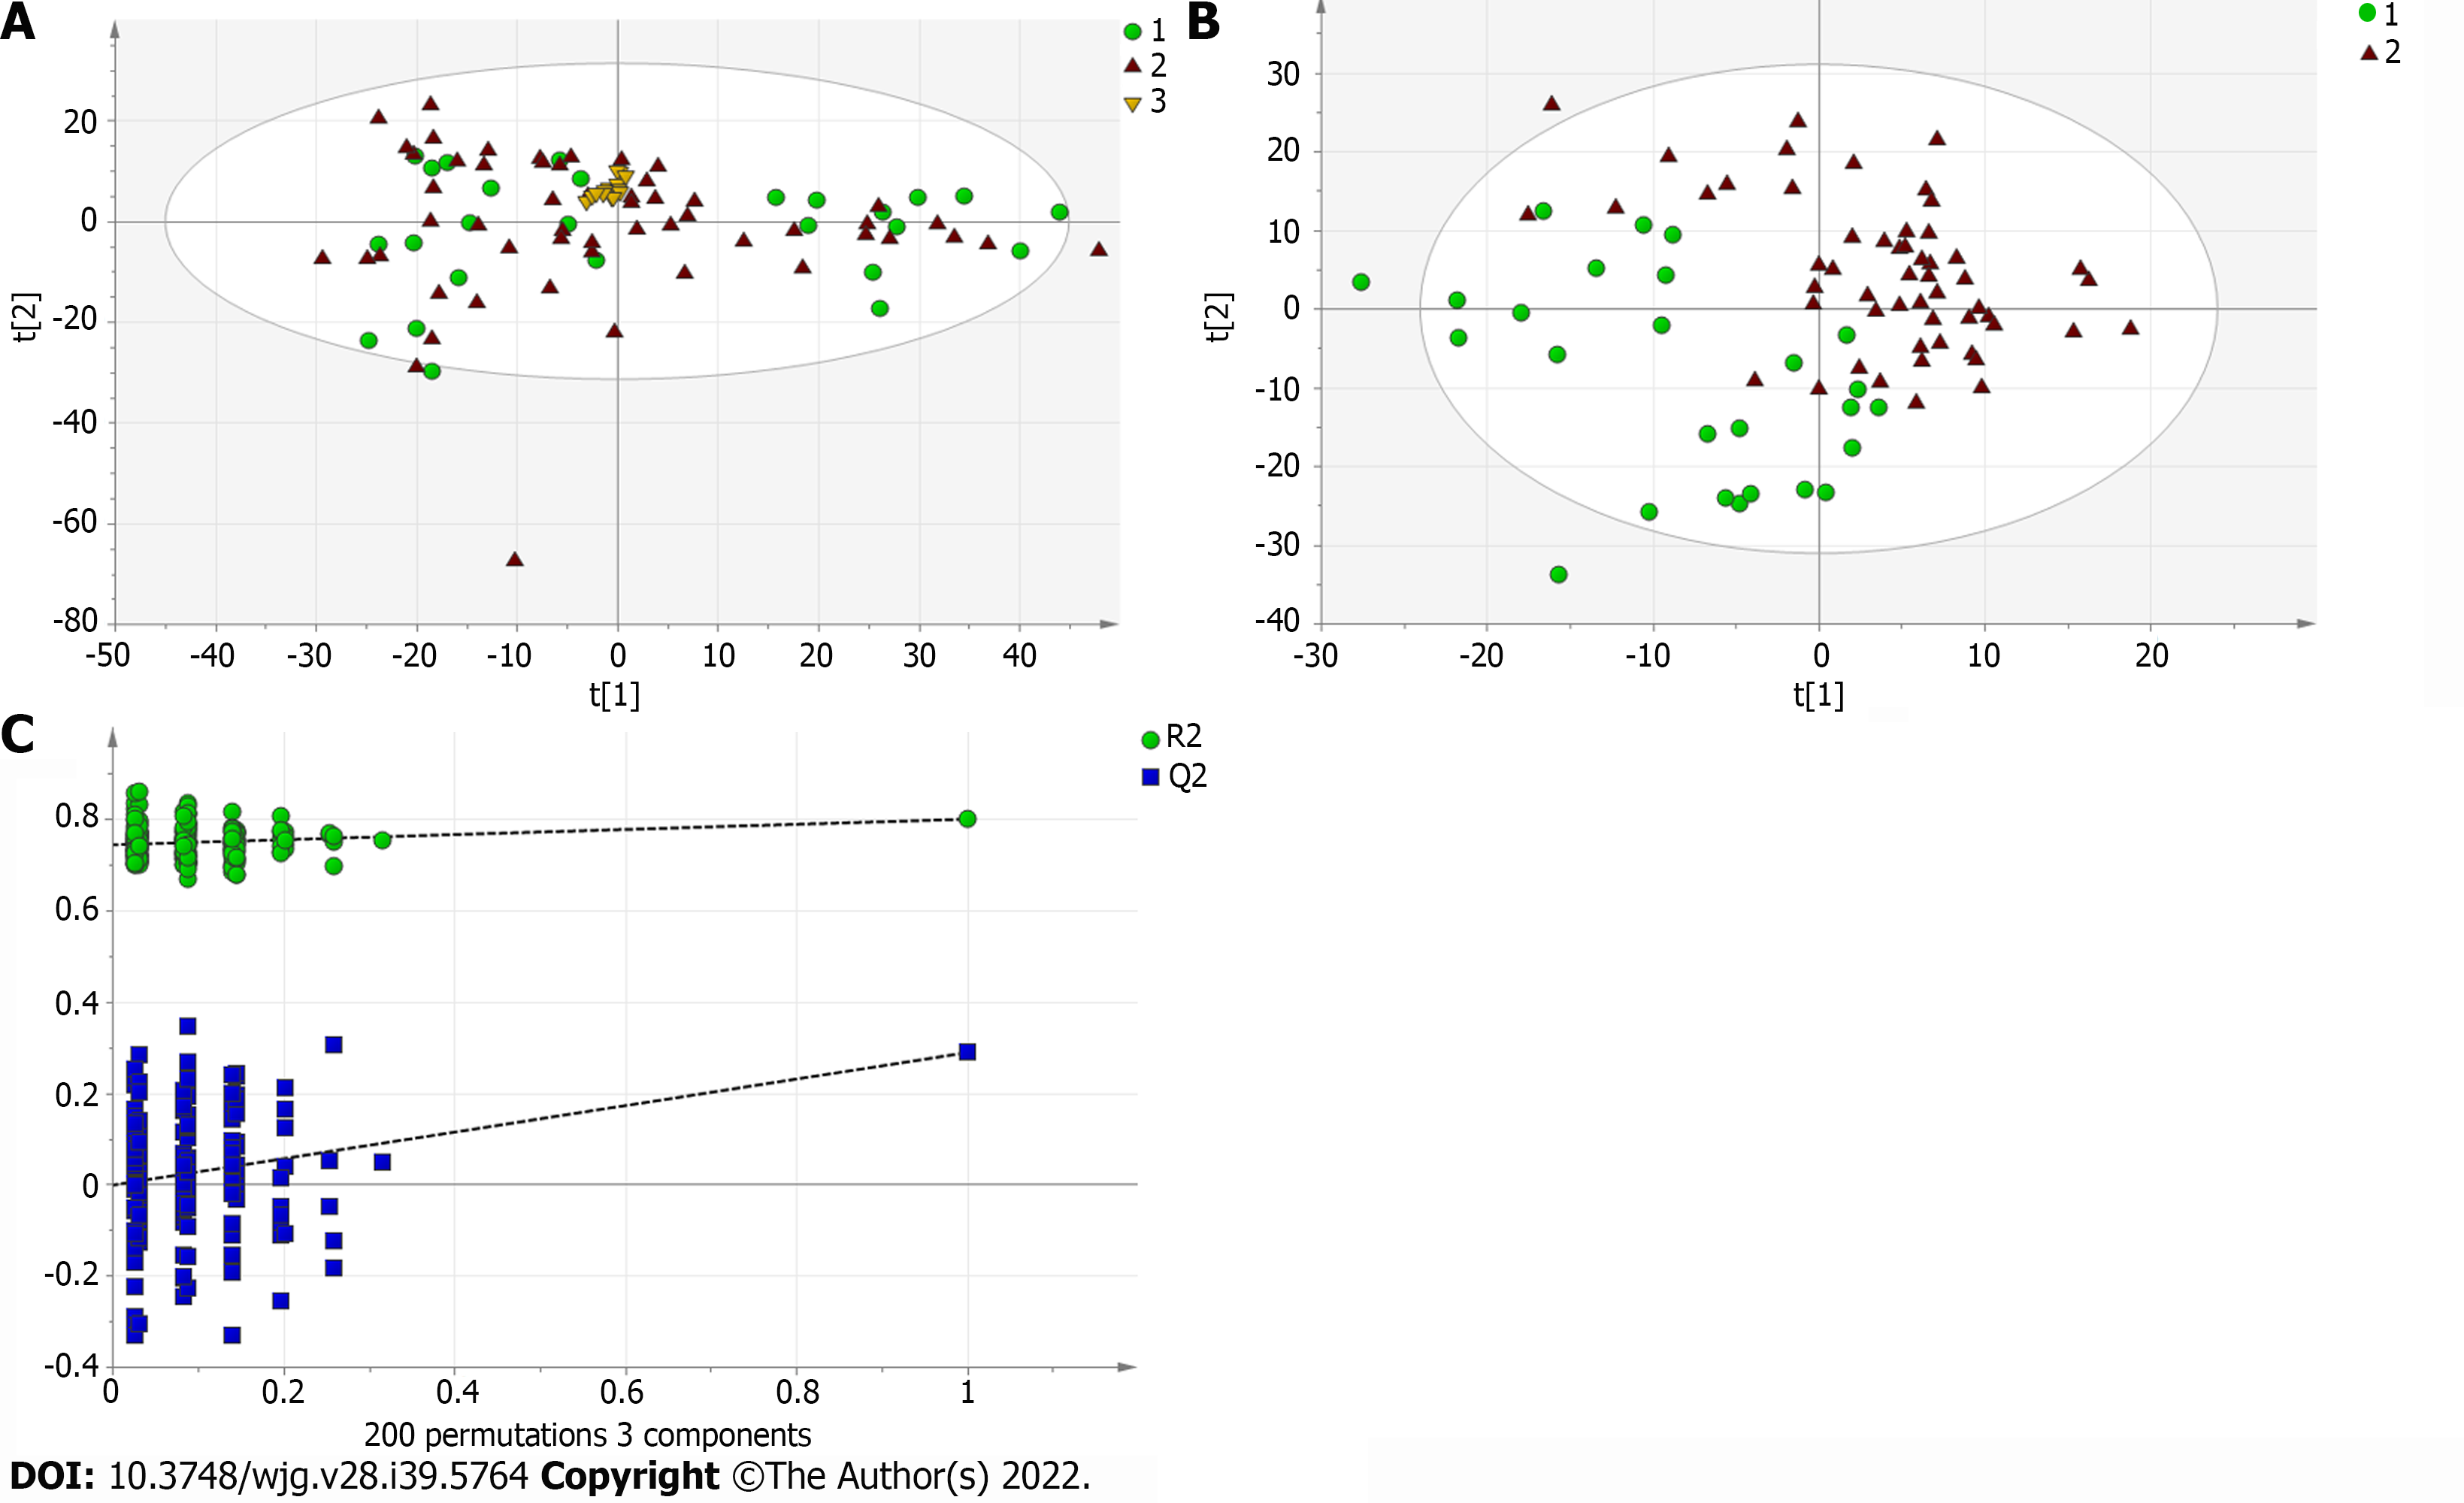
Figure 4 Multivariate statistical analysis on serum profiling data in negative ions between primary biliary cholangitis and control.
A: Plots of principal component analysis in negative ion mode. (1) Primary biliary cholangitis (PBC); (2) Control; and (3) Quality control (QC); B: Scatter plots of partial least squares-discriminant analysis (PLS-DA) with a negative model of serum from patients with PBC, autoimmune hepatitis and healthy controls. (1) PBC; (2) Control; and (3) QC; C: Validation plot of the original PLS-DA with a negative model, strongly indicating that the original model is valid and shows signs of overfitting. The permutation test was repeated 200 times in the cross-validation plot.
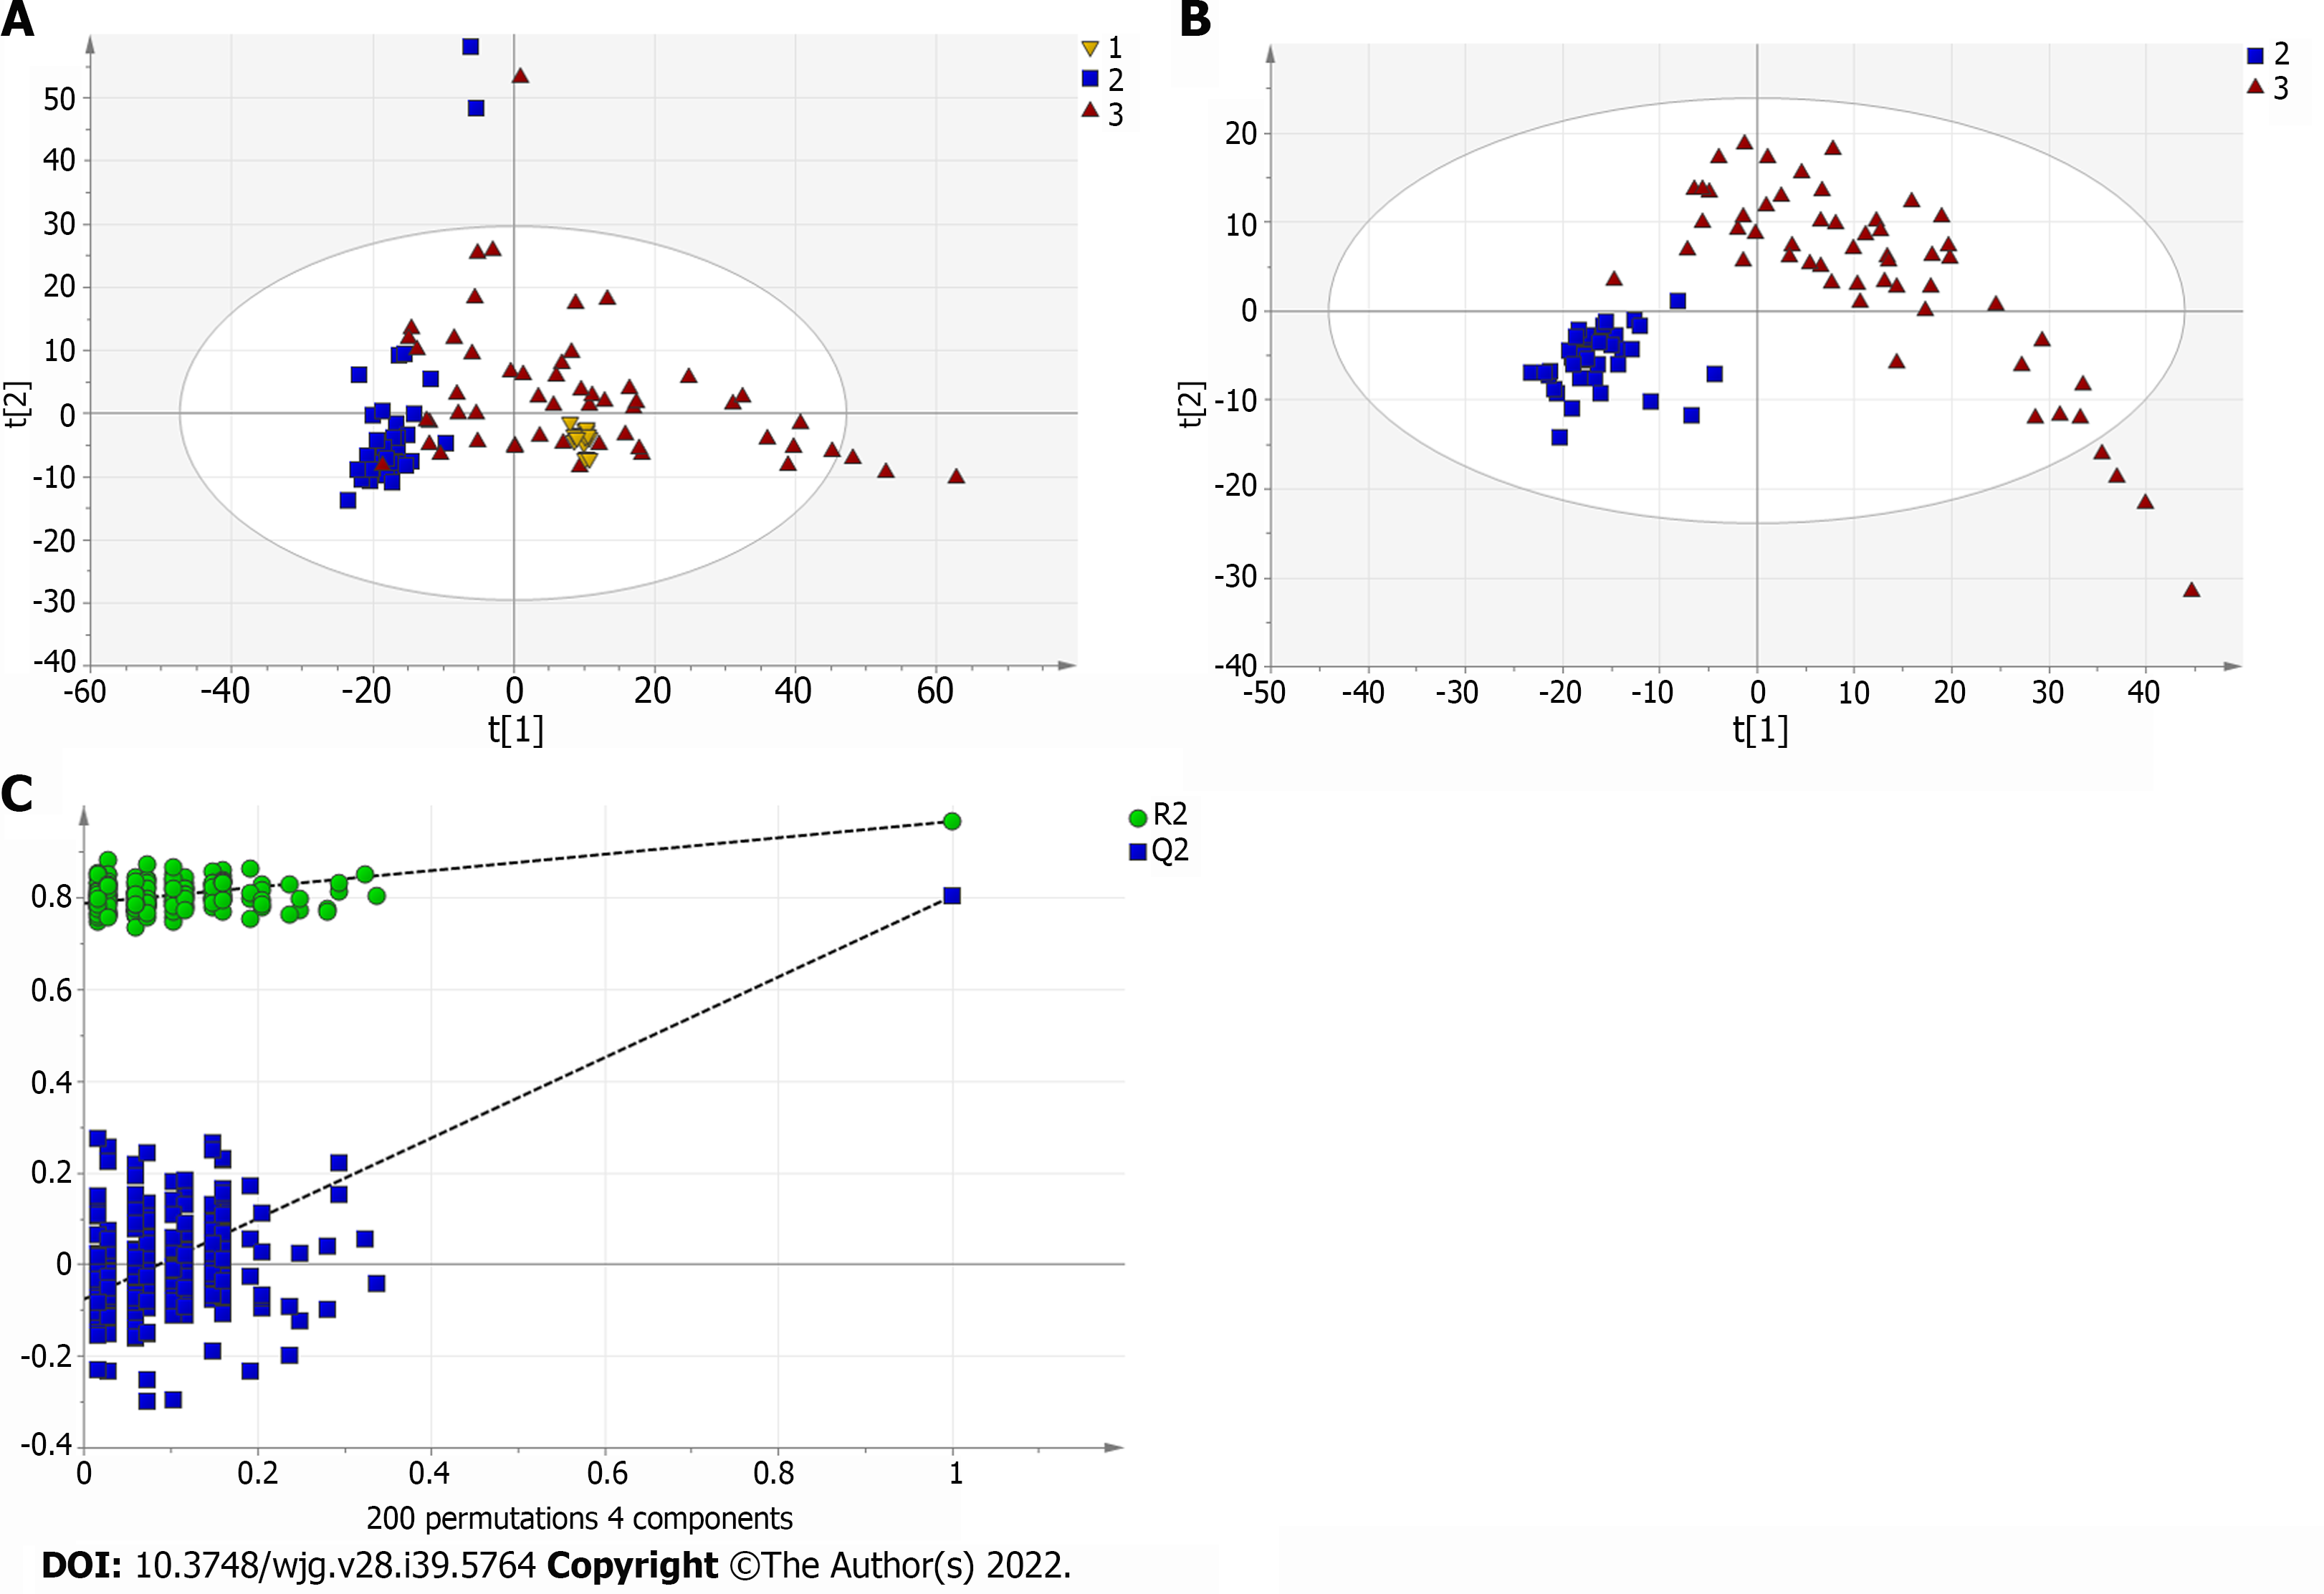
Figure 5 Multivariate statistical analysis on serum profiling data in negative ions between autoimmune hepatitis and control.
A: Plots of principal component analysis in negative ion mode. (1) Autoimmune hepatitis (AIH); (2) Control; and (3) Quality control (QC); B: Scatter plots of partial least squares-discriminant analysis (PLS-DA) with a negative model of serum from patients with Primary biliary cholangitis, AIH and healthy controls. (1) Autoimmune hepatitis (AIH); (2) Control; and (3) QC; C: Validation plot of the original PLS-DA with a negative model, strongly indicating that the original model is valid and shows signs of overfitting. The permutation test was repeated 200 times in the cross-validation plot.
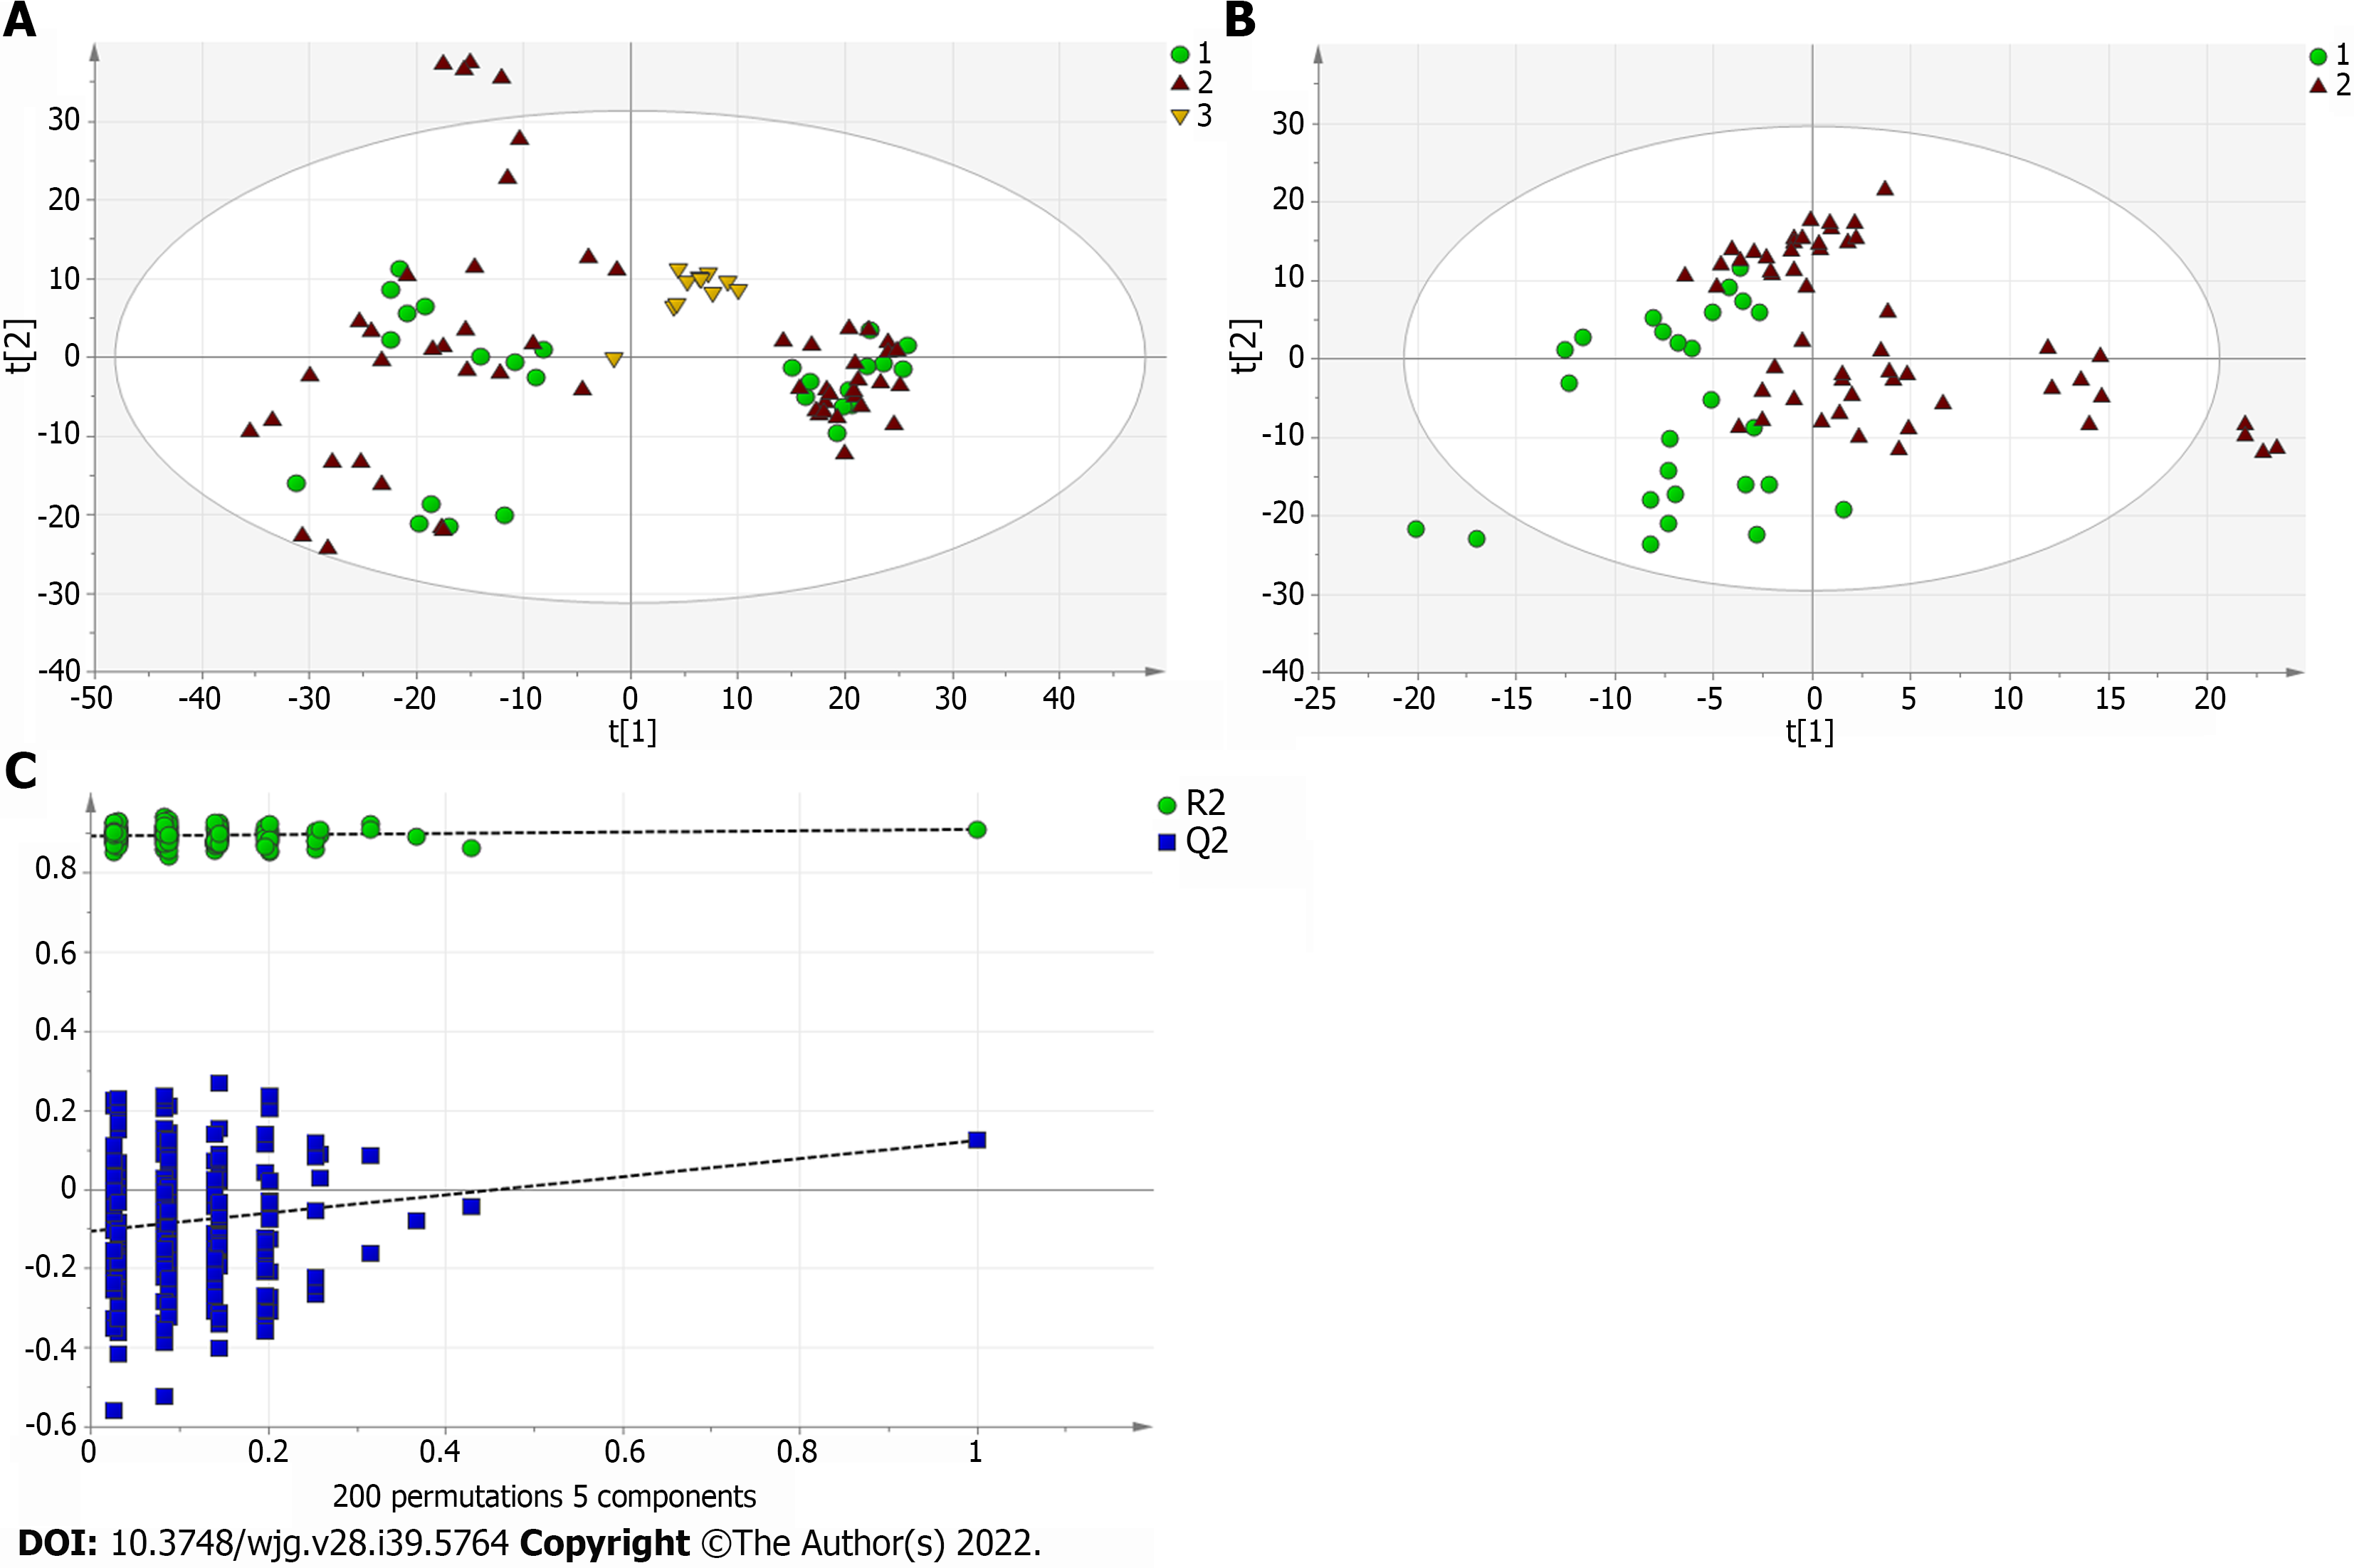
Figure 6 Multivariate statistical analysis on serum profiling data in negative ions between primary biliary cholangitis and autoimmune hepatitis.
A: Plots of principal component analysis in negative ion mode. (1) Autoimmune hepatitis (AIH); (2) Primary biliary cholangitis (PBC); and (3) Quality control; B: Scatter plots of partial least squares-discriminant analysis (PLS-DA) with a negative model of serum from patients with PBC, AIH and healthy controls. (1) AIH; and (2) PBC; C: Validation plot of the original PLS-DA with a negative model, strongly indicating that the original model is valid and shows signs of overfitting. The permutation test was repeated 200 times in the cross-validation plot.
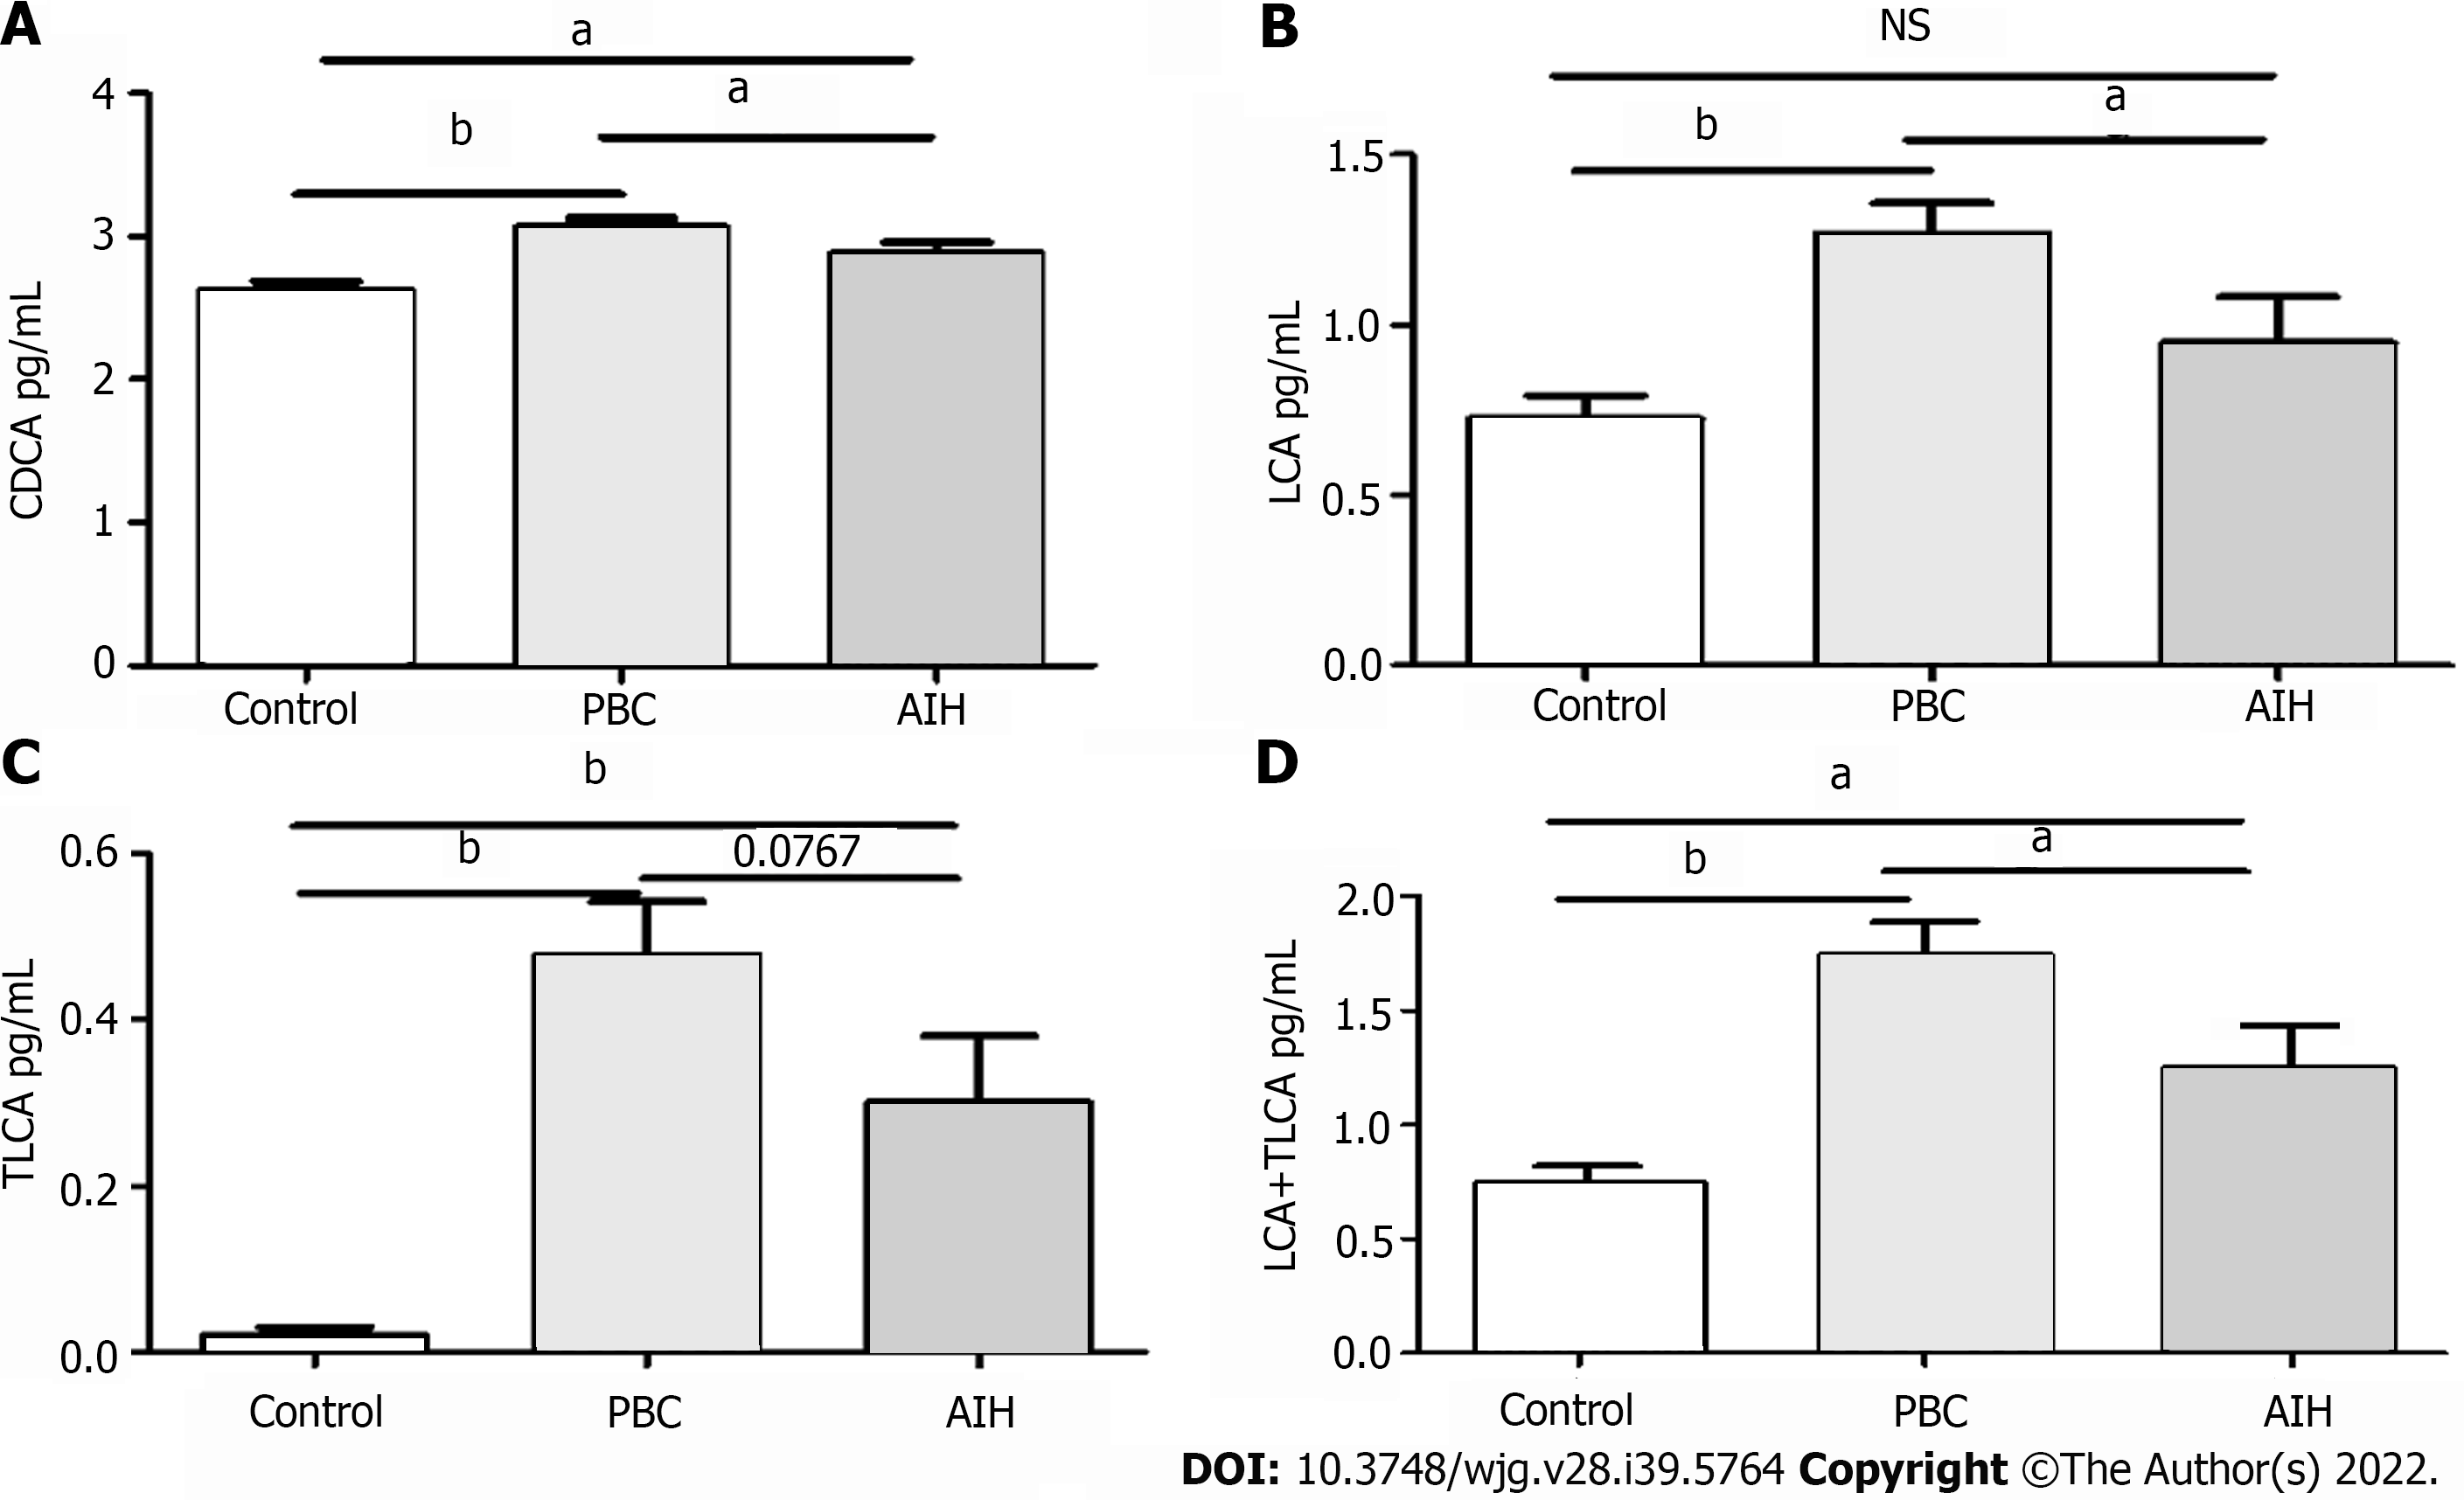
Figure 7 Comparative analysis of alterations in serum bile acid levels in patients in the mild and severe injury groups, and in healthy controls.
A: Chenodeoxycholic acid; B: Lithocholic acid (LCA); C: Taurolithocholic acid (TLCA); D: LCA + TLCA; aP < 0.05; bP < 0.0001; NS: Not significant.
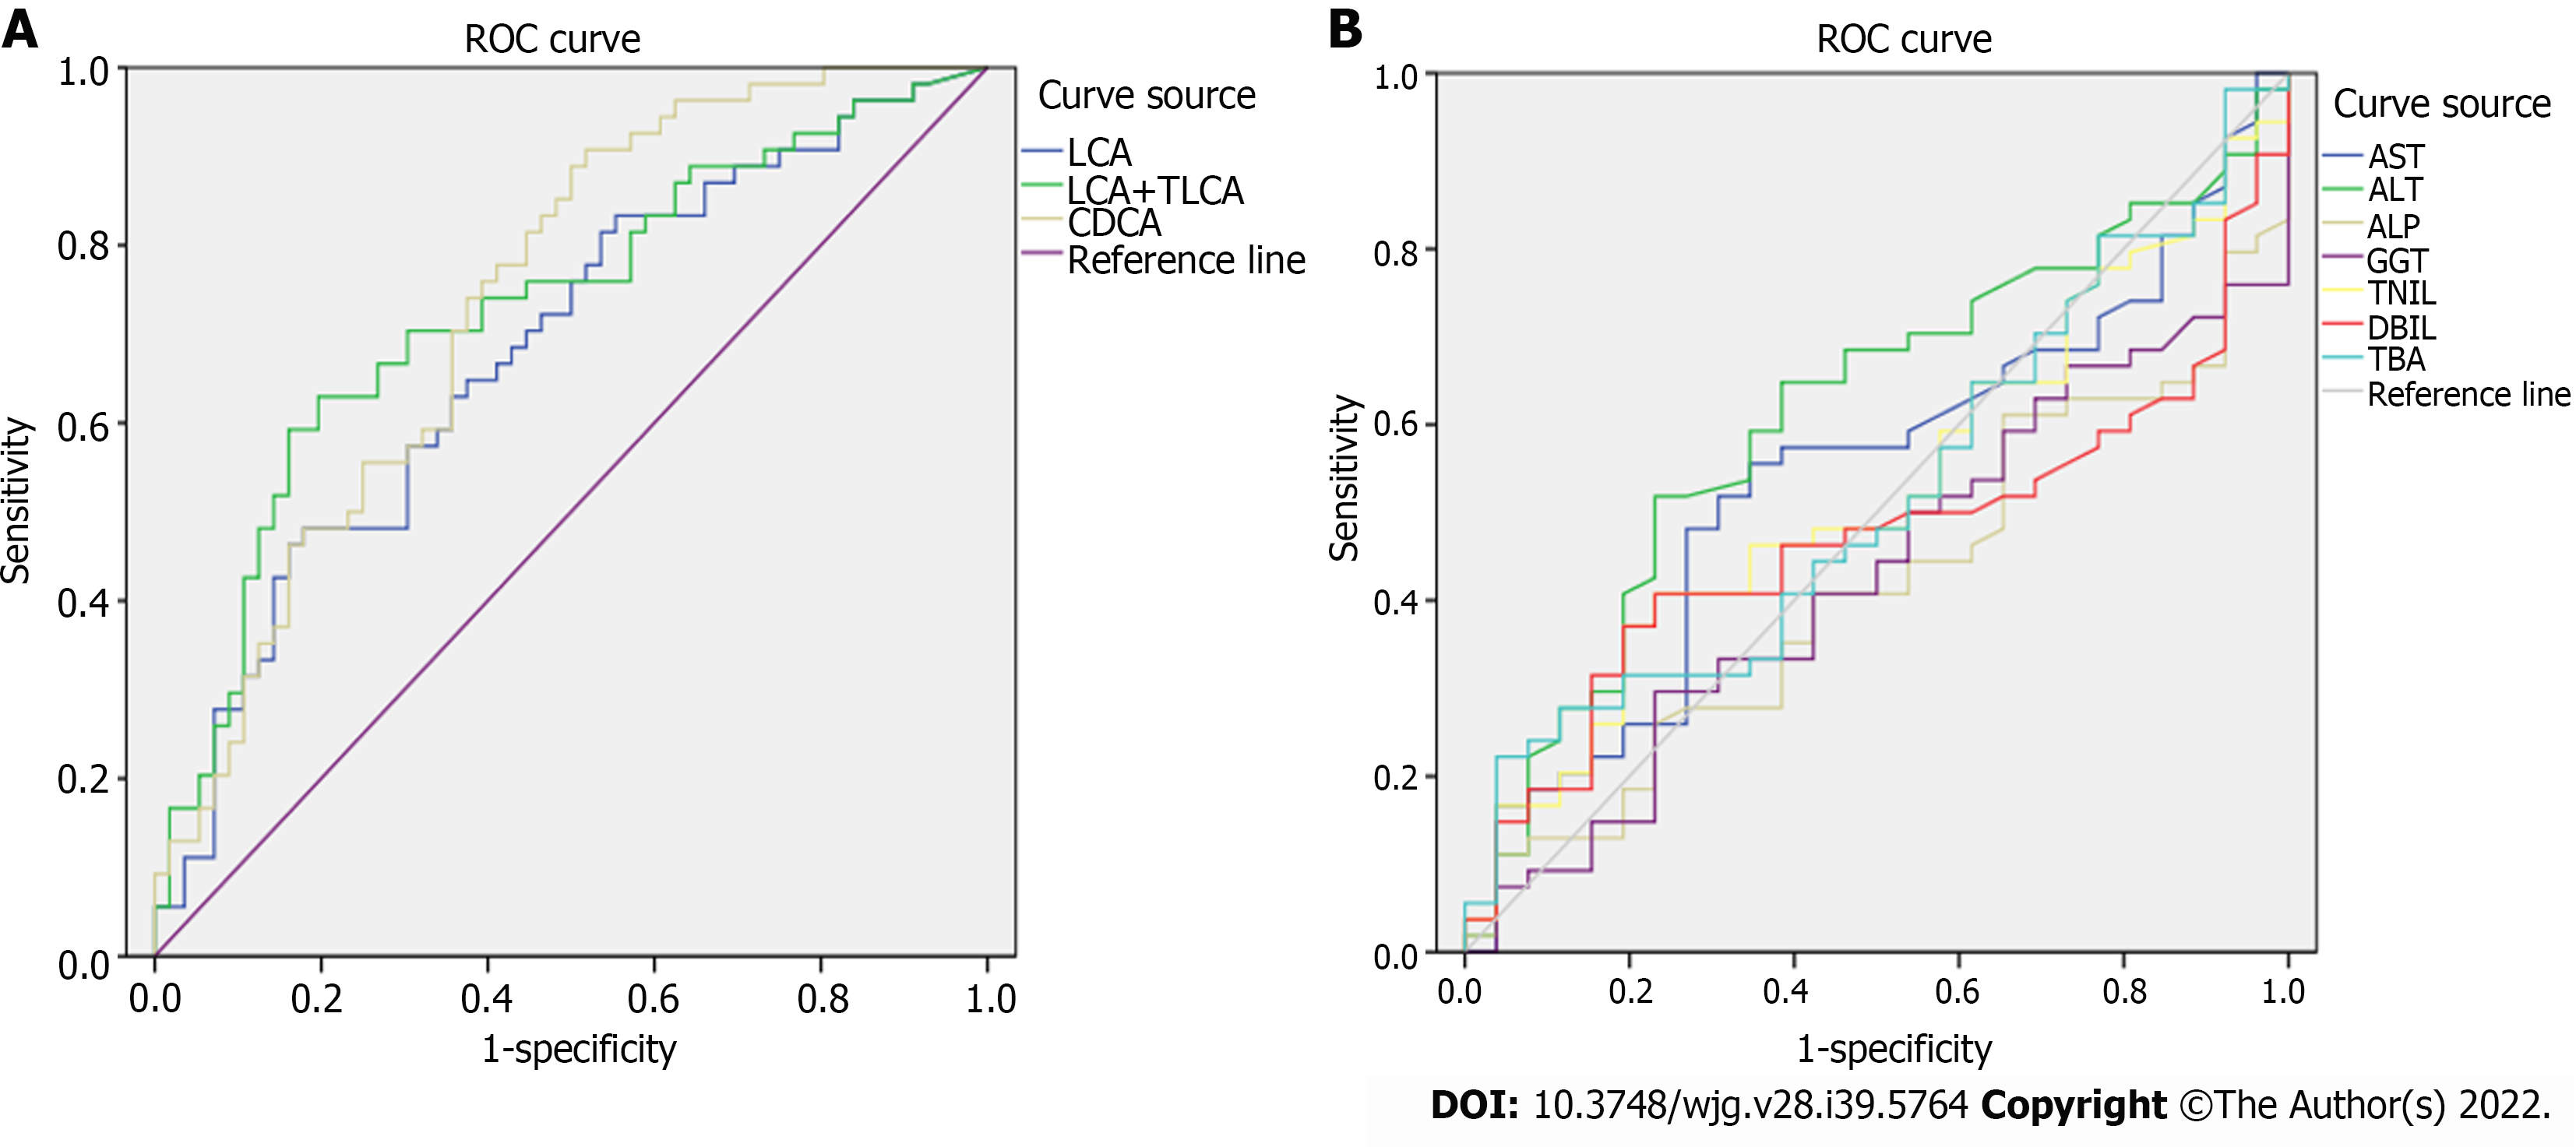
Figure 8 Receiver operating characteristic curve analysis.
A: Lithocholic acid (LCA), sum of LCA and taurolithocholic acid, chenodeoxycholic acid; B: Common clinical biochemical indicators.
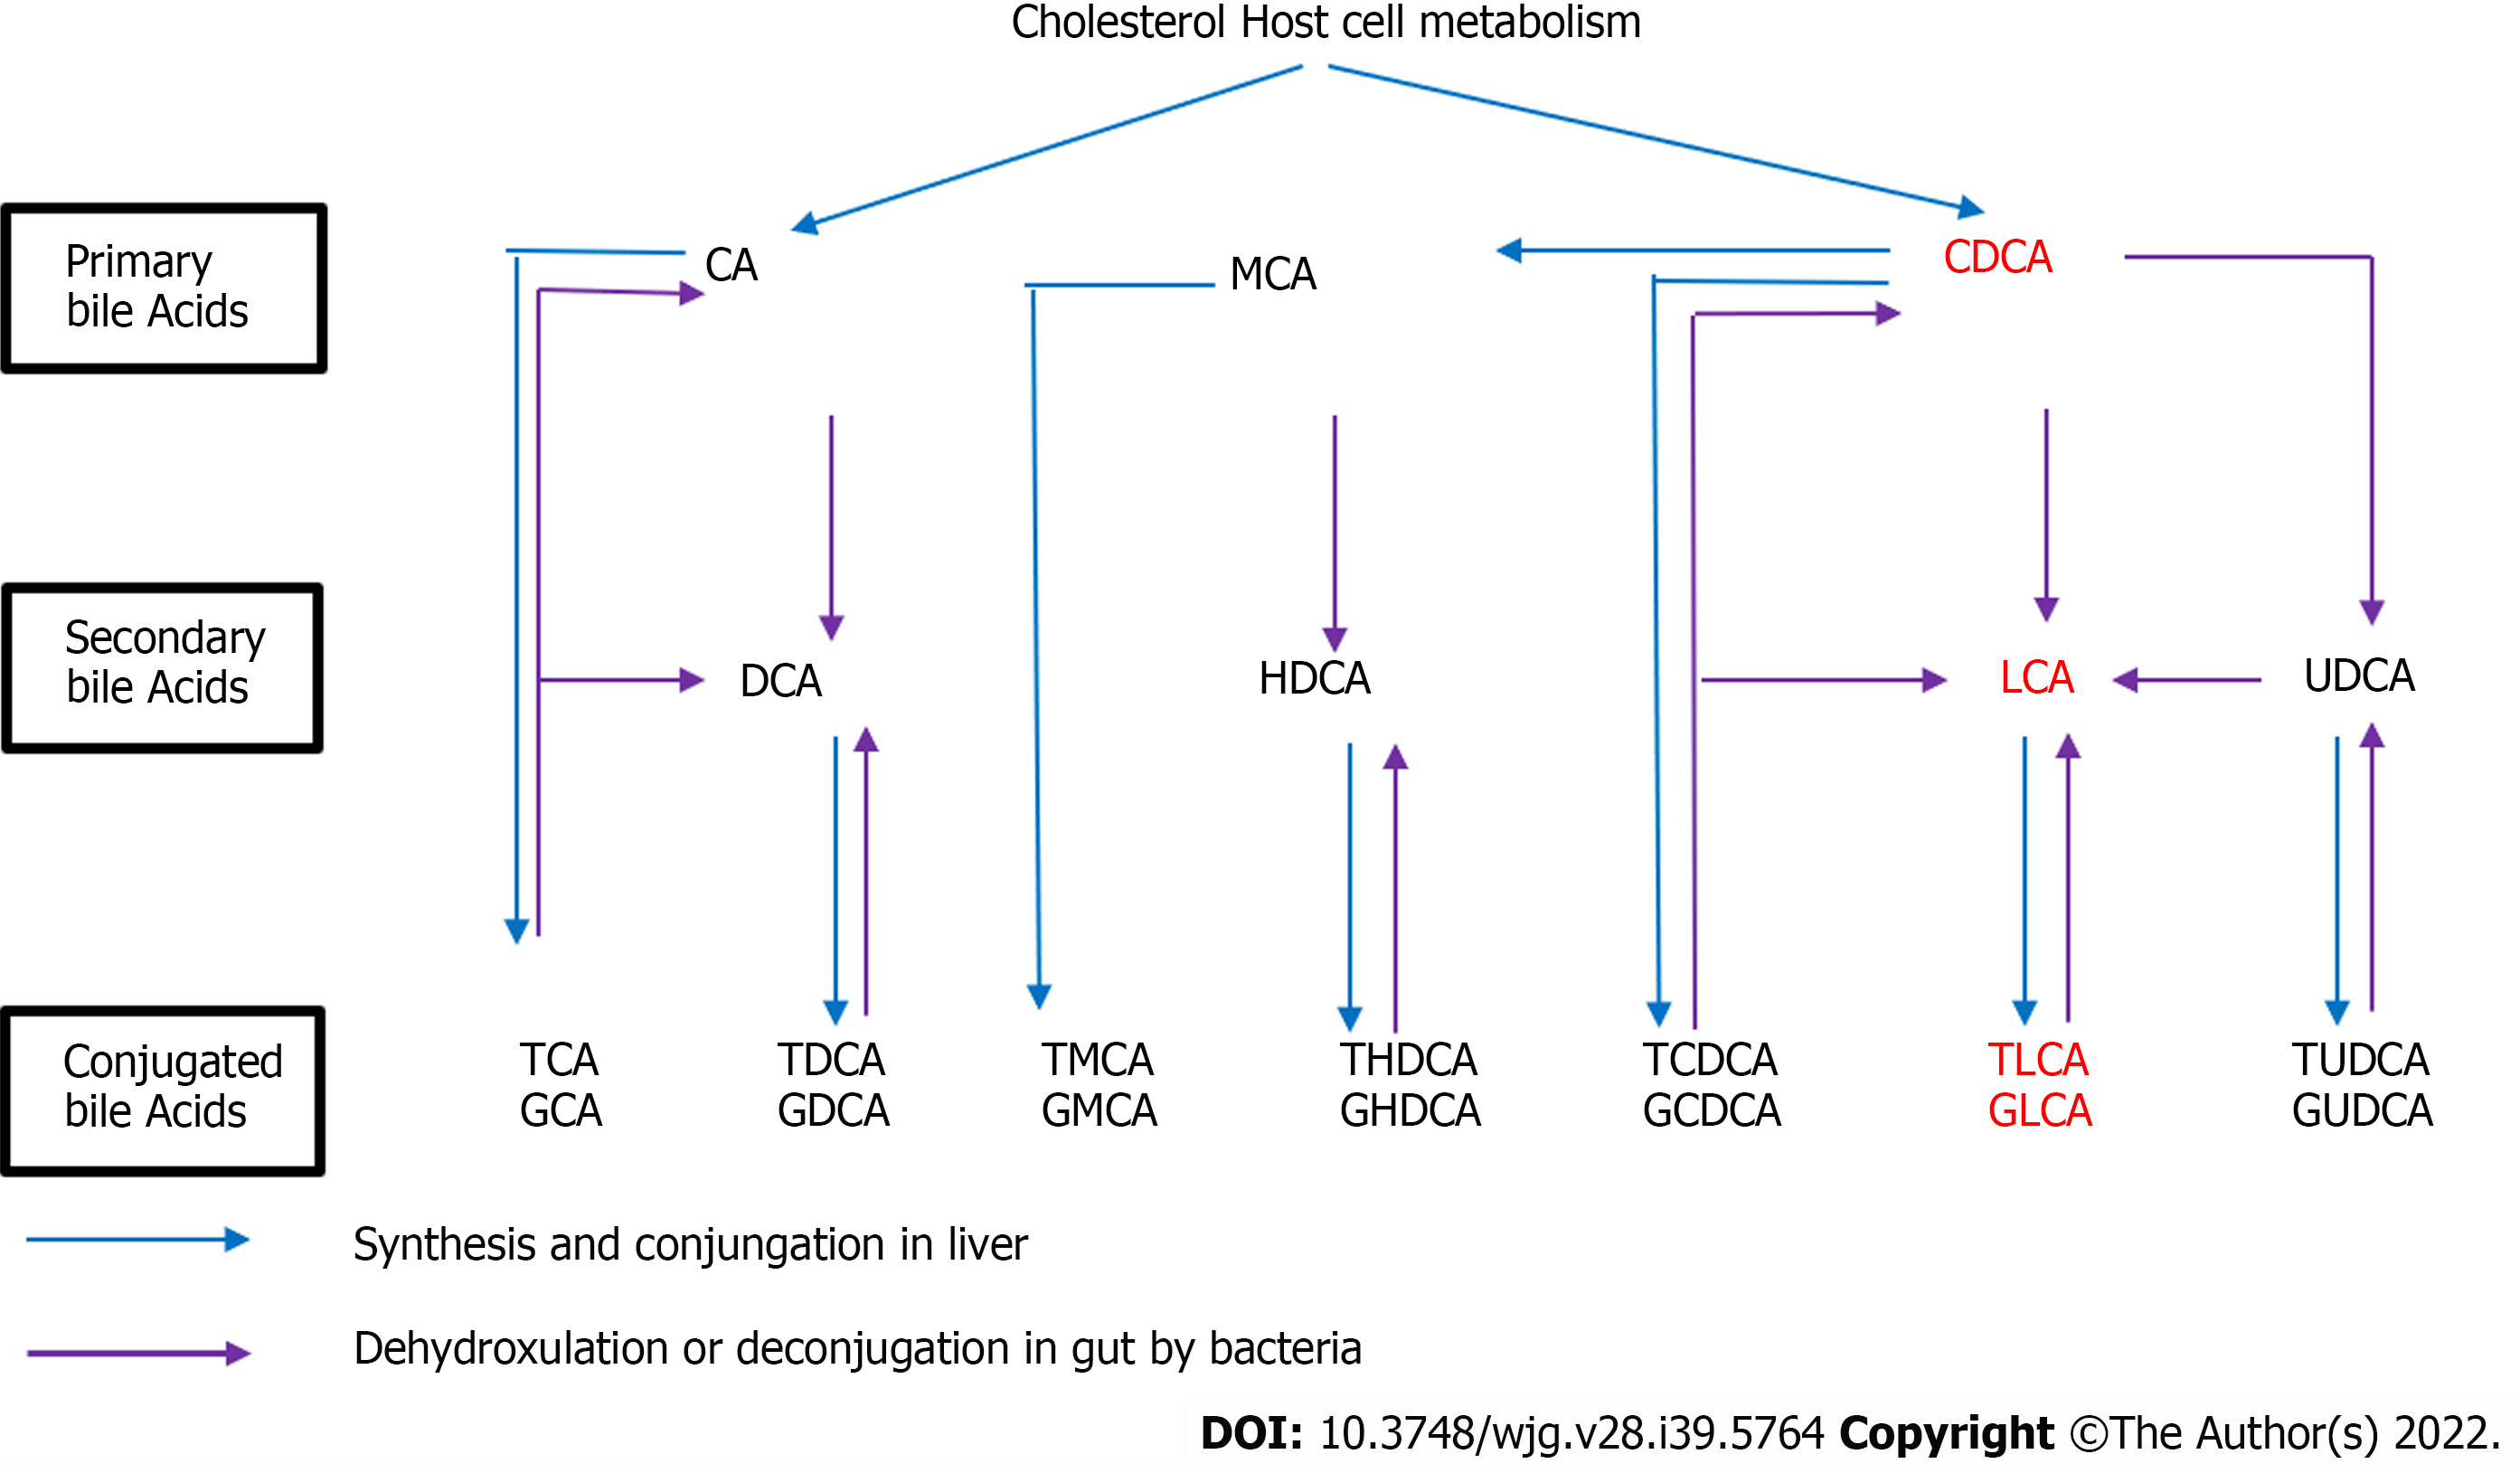
Figure 9 Cholesterol host cell metabolism.
CA: Cholic acid; CDCA: Chenodeoxycholic acid; DCA: Deoxycholic acid; TCA: Taurocholic acid; GCA: Glycocholic acid; TDCA: Taurodeoxycholic acid; GDCA: Glycodeoxycholic acid; TCDCA: Taurochenodeoxycholic acid; TLCA: Taurolithocholic acid; TUDCA: Tauroursodeoxycholic acid.
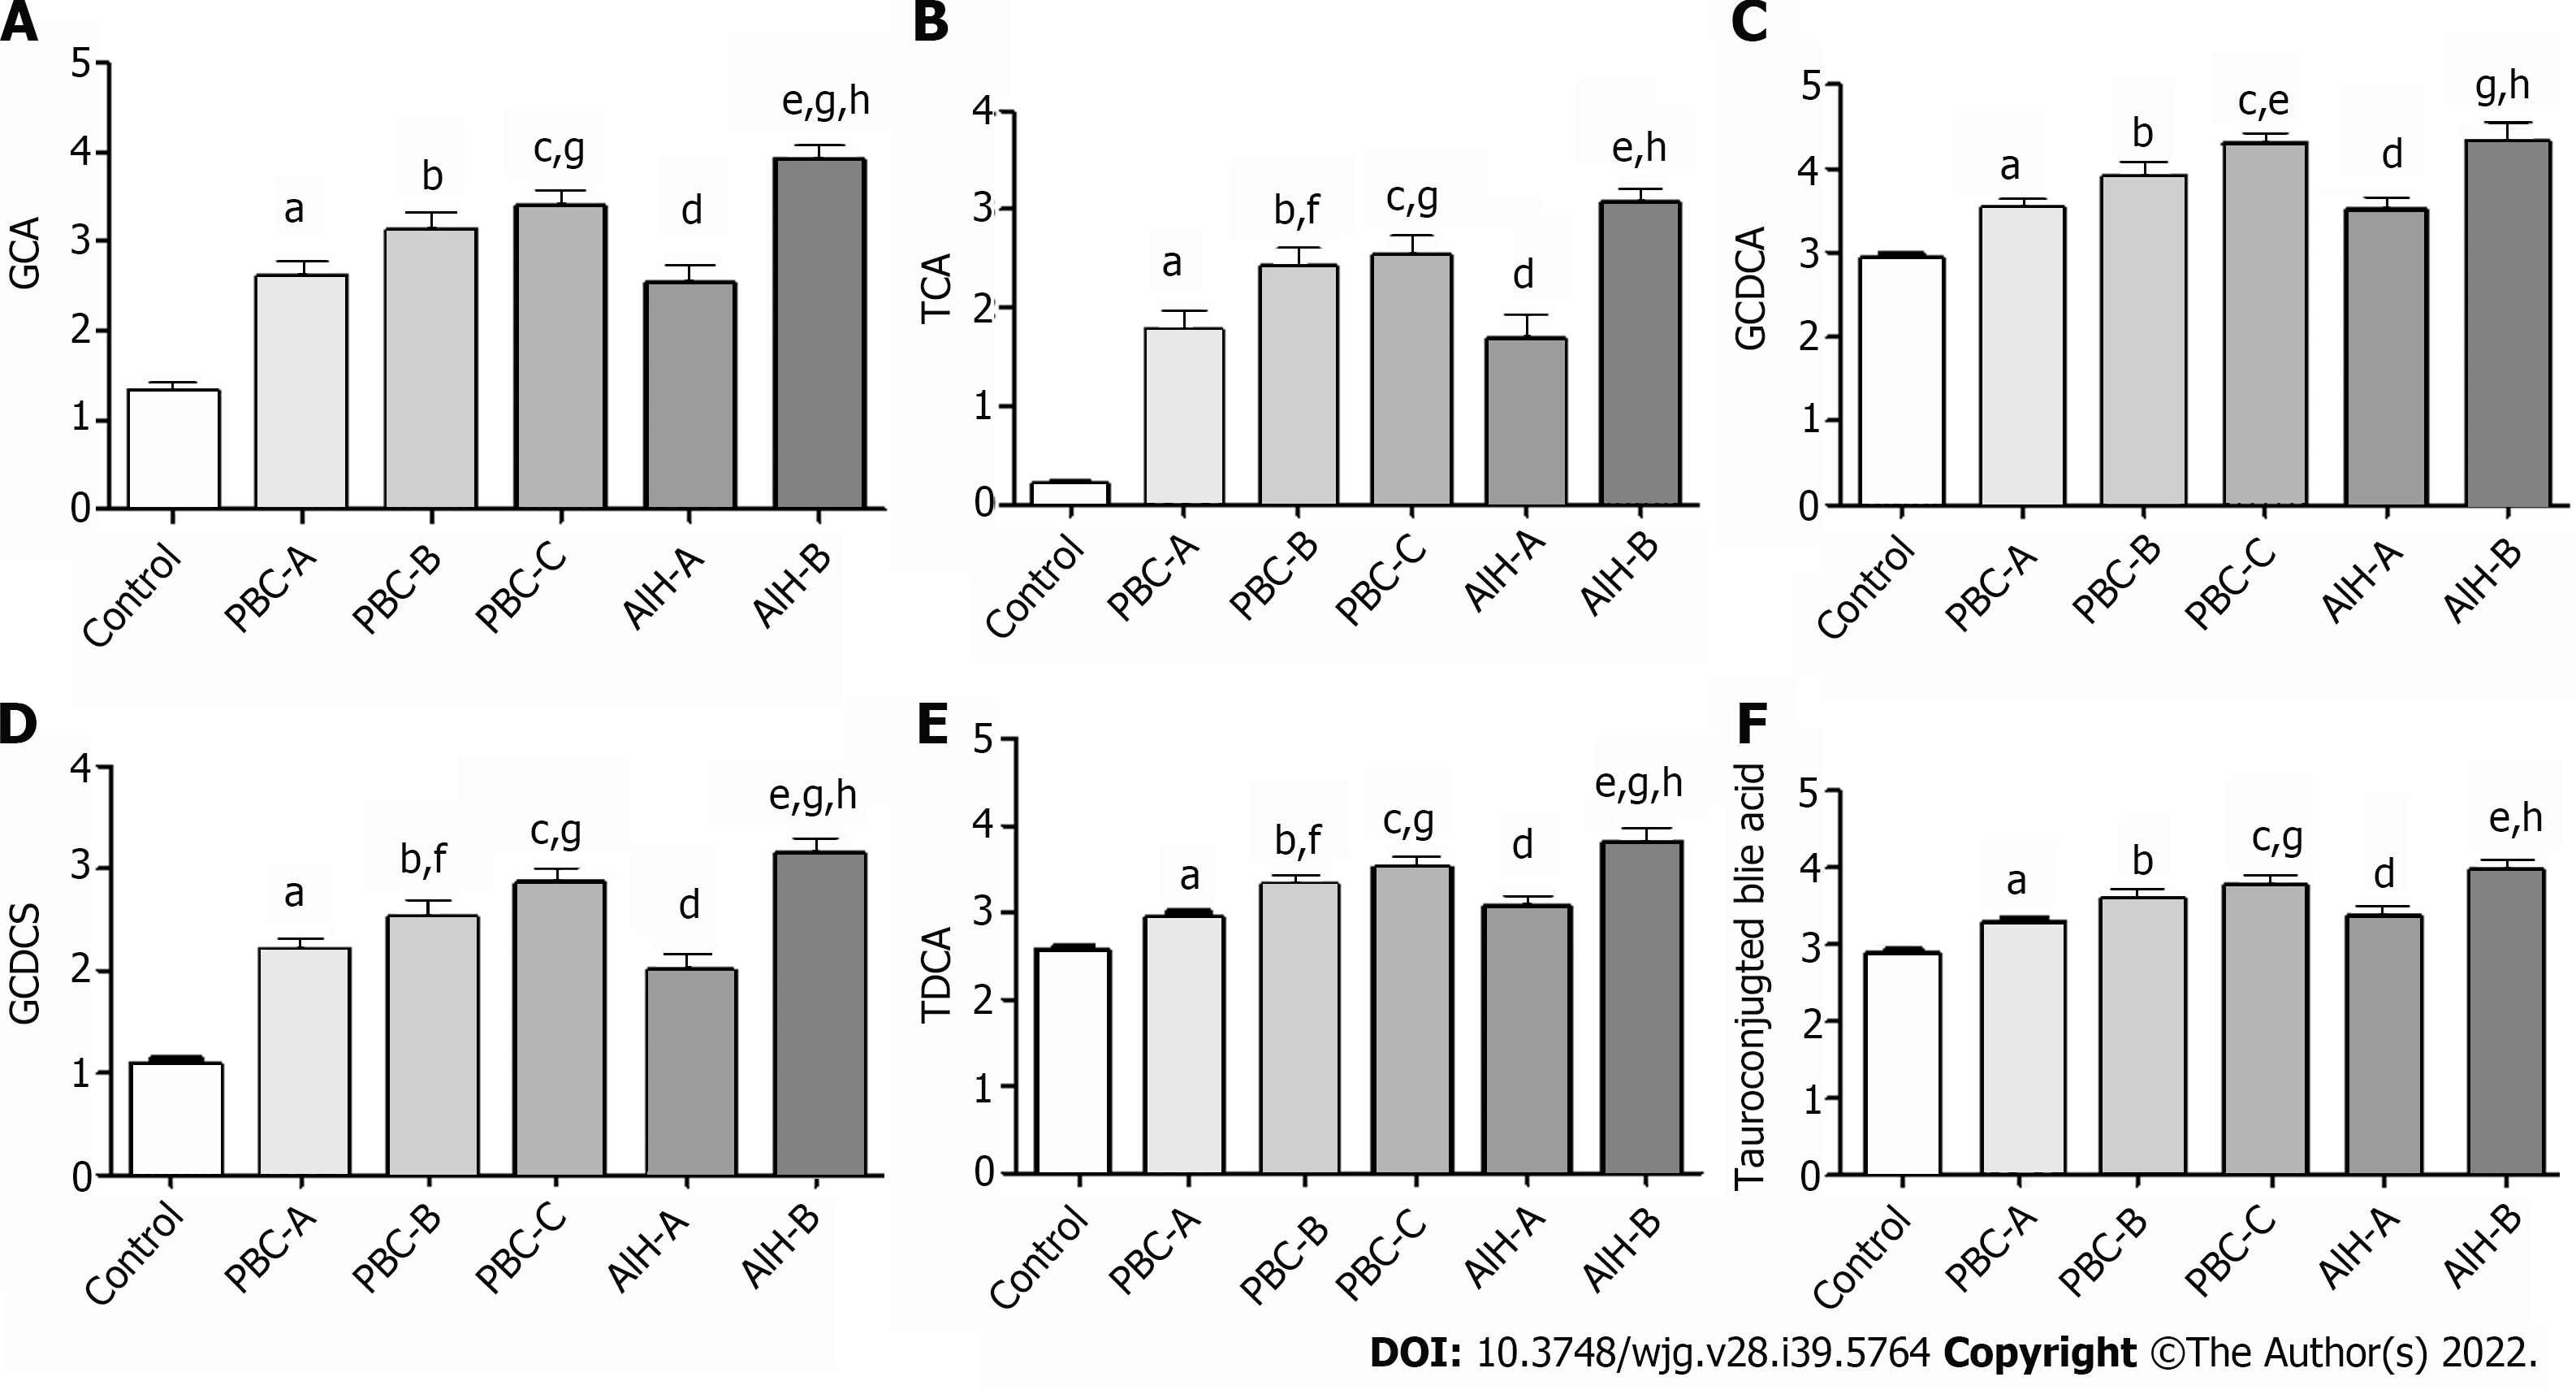
Figure 10 Bile acid levels are expressed in log10 concentrations.
Statistically significant differences in bile acid concentrations between controls and patients were determined by the rank sums Mann-Whitney test. Primary biliary cholangitis (PBC)-A vs control, aP < 0.05; PBC-B vs control, bP < 0.05; PBC-C vs control, cP < 0.05; autoimmune hepatitis (AIH)-A vs control, dP < 0.05; AIH-B vs control, eP < 0.05; PBC-A vs PBC-B, fP < 0.05; PBC-A vs PBC-C, gP < 0.05; AIH-A vs AIH-B, hP < 0.05; PBC-A vs AIH-A. A: Glycocholic acid; B: Taurocholic acid; C: Glycochenodeoxycholic acid; D: Glycochenodeoxycholic sulfate; E: Taurodeoxycholic acid; F: Tauroconjugted bile acid. GCDCA: Glycochenodeoxycholic acid; GCDCS: Glycochenodeoxycholic sulfate; TDCA: Taurodeoxycholic acid; GCA: Glycocholic acid; TCA: Taurocholic acid.
- Citation: Ma ZH, Wang XM, Wu RH, Hao DL, Sun LC, Li P, Niu JQ. Serum metabolic profiling of targeted bile acids reveals potentially novel biomarkers for primary biliary cholangitis and autoimmune hepatitis. World J Gastroenterol 2022; 28(39): 5764-5783
- URL: https://www.wjgnet.com/1007-9327/full/v28/i39/5764.htm
- DOI: https://dx.doi.org/10.3748/wjg.v28.i39.5764


