Copyright
©The Author(s) 2022.
World J Gastroenterol. Oct 7, 2022; 28(37): 5420-5443
Published online Oct 7, 2022. doi: 10.3748/wjg.v28.i37.5420
Published online Oct 7, 2022. doi: 10.3748/wjg.v28.i37.5420
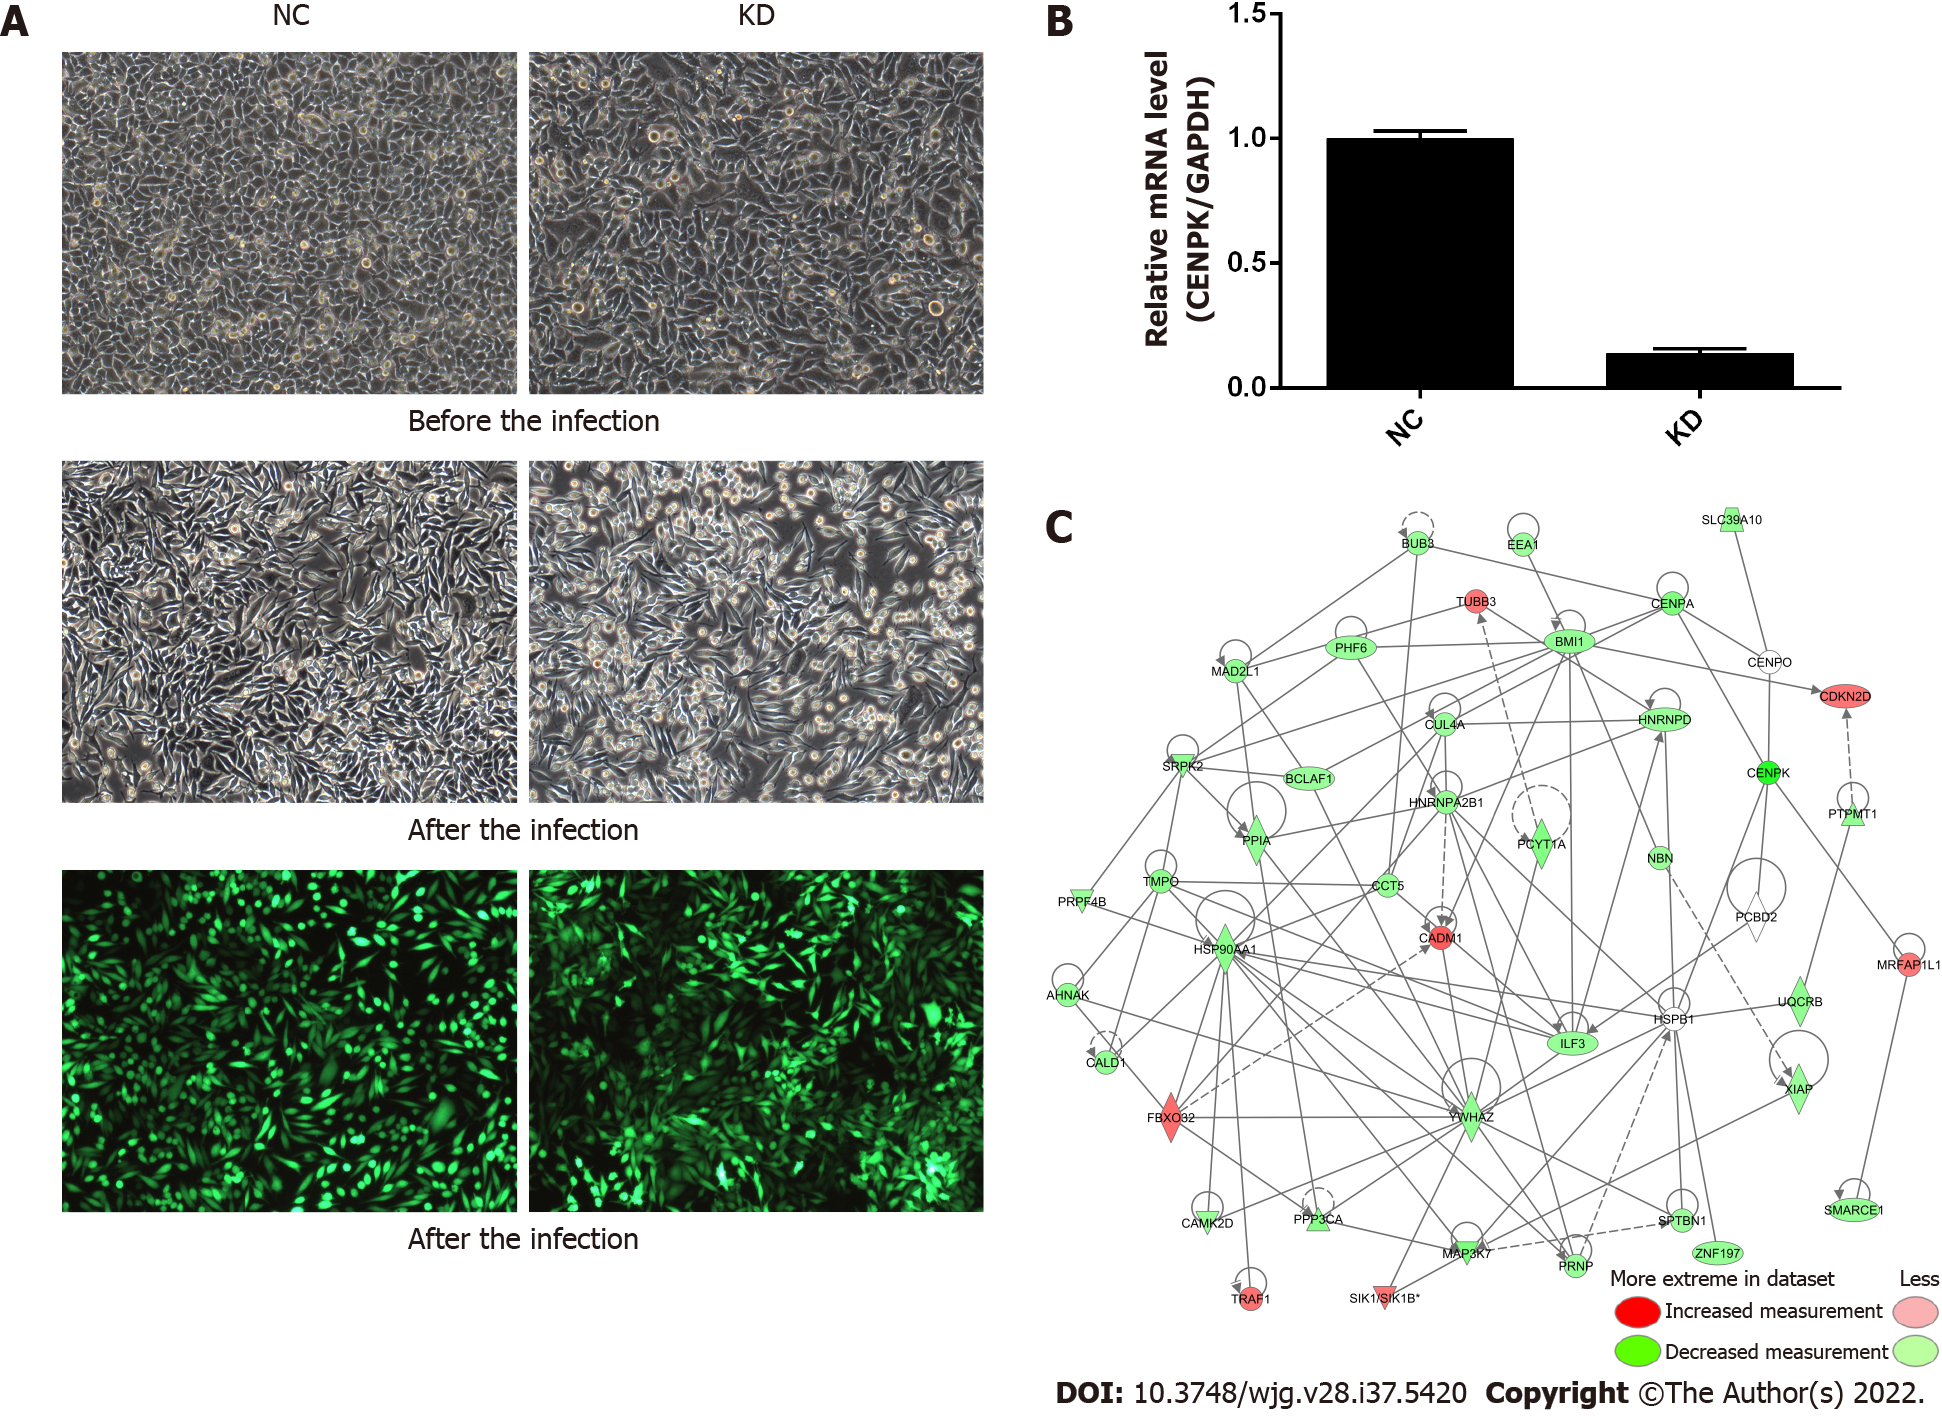
Figure 1 Centromere protein K affects the proliferation and invasion of colorectal cancer cells by acting on downstream genes.
A: Morphology of RKO cells in NC and KD groups before and after lentivirus infection as well as infection efficiency assessed using fluorescence microscopy (× 100 magnification); B: Relative expression level of centromere protein K by quantitative polymerase chain reaction in NC and KD groups; C: Gene interaction network diagram. Genes, proteins, and chemicals are represented by different shapes; color labeling of molecules is shown in the illustration. NC: RKO cells infected with centromere protein K negative control virus; KD: RKO cells with lentivirus-mediated short hairpin RNA interference of centromere protein K; CENPK: Centromere protein K.
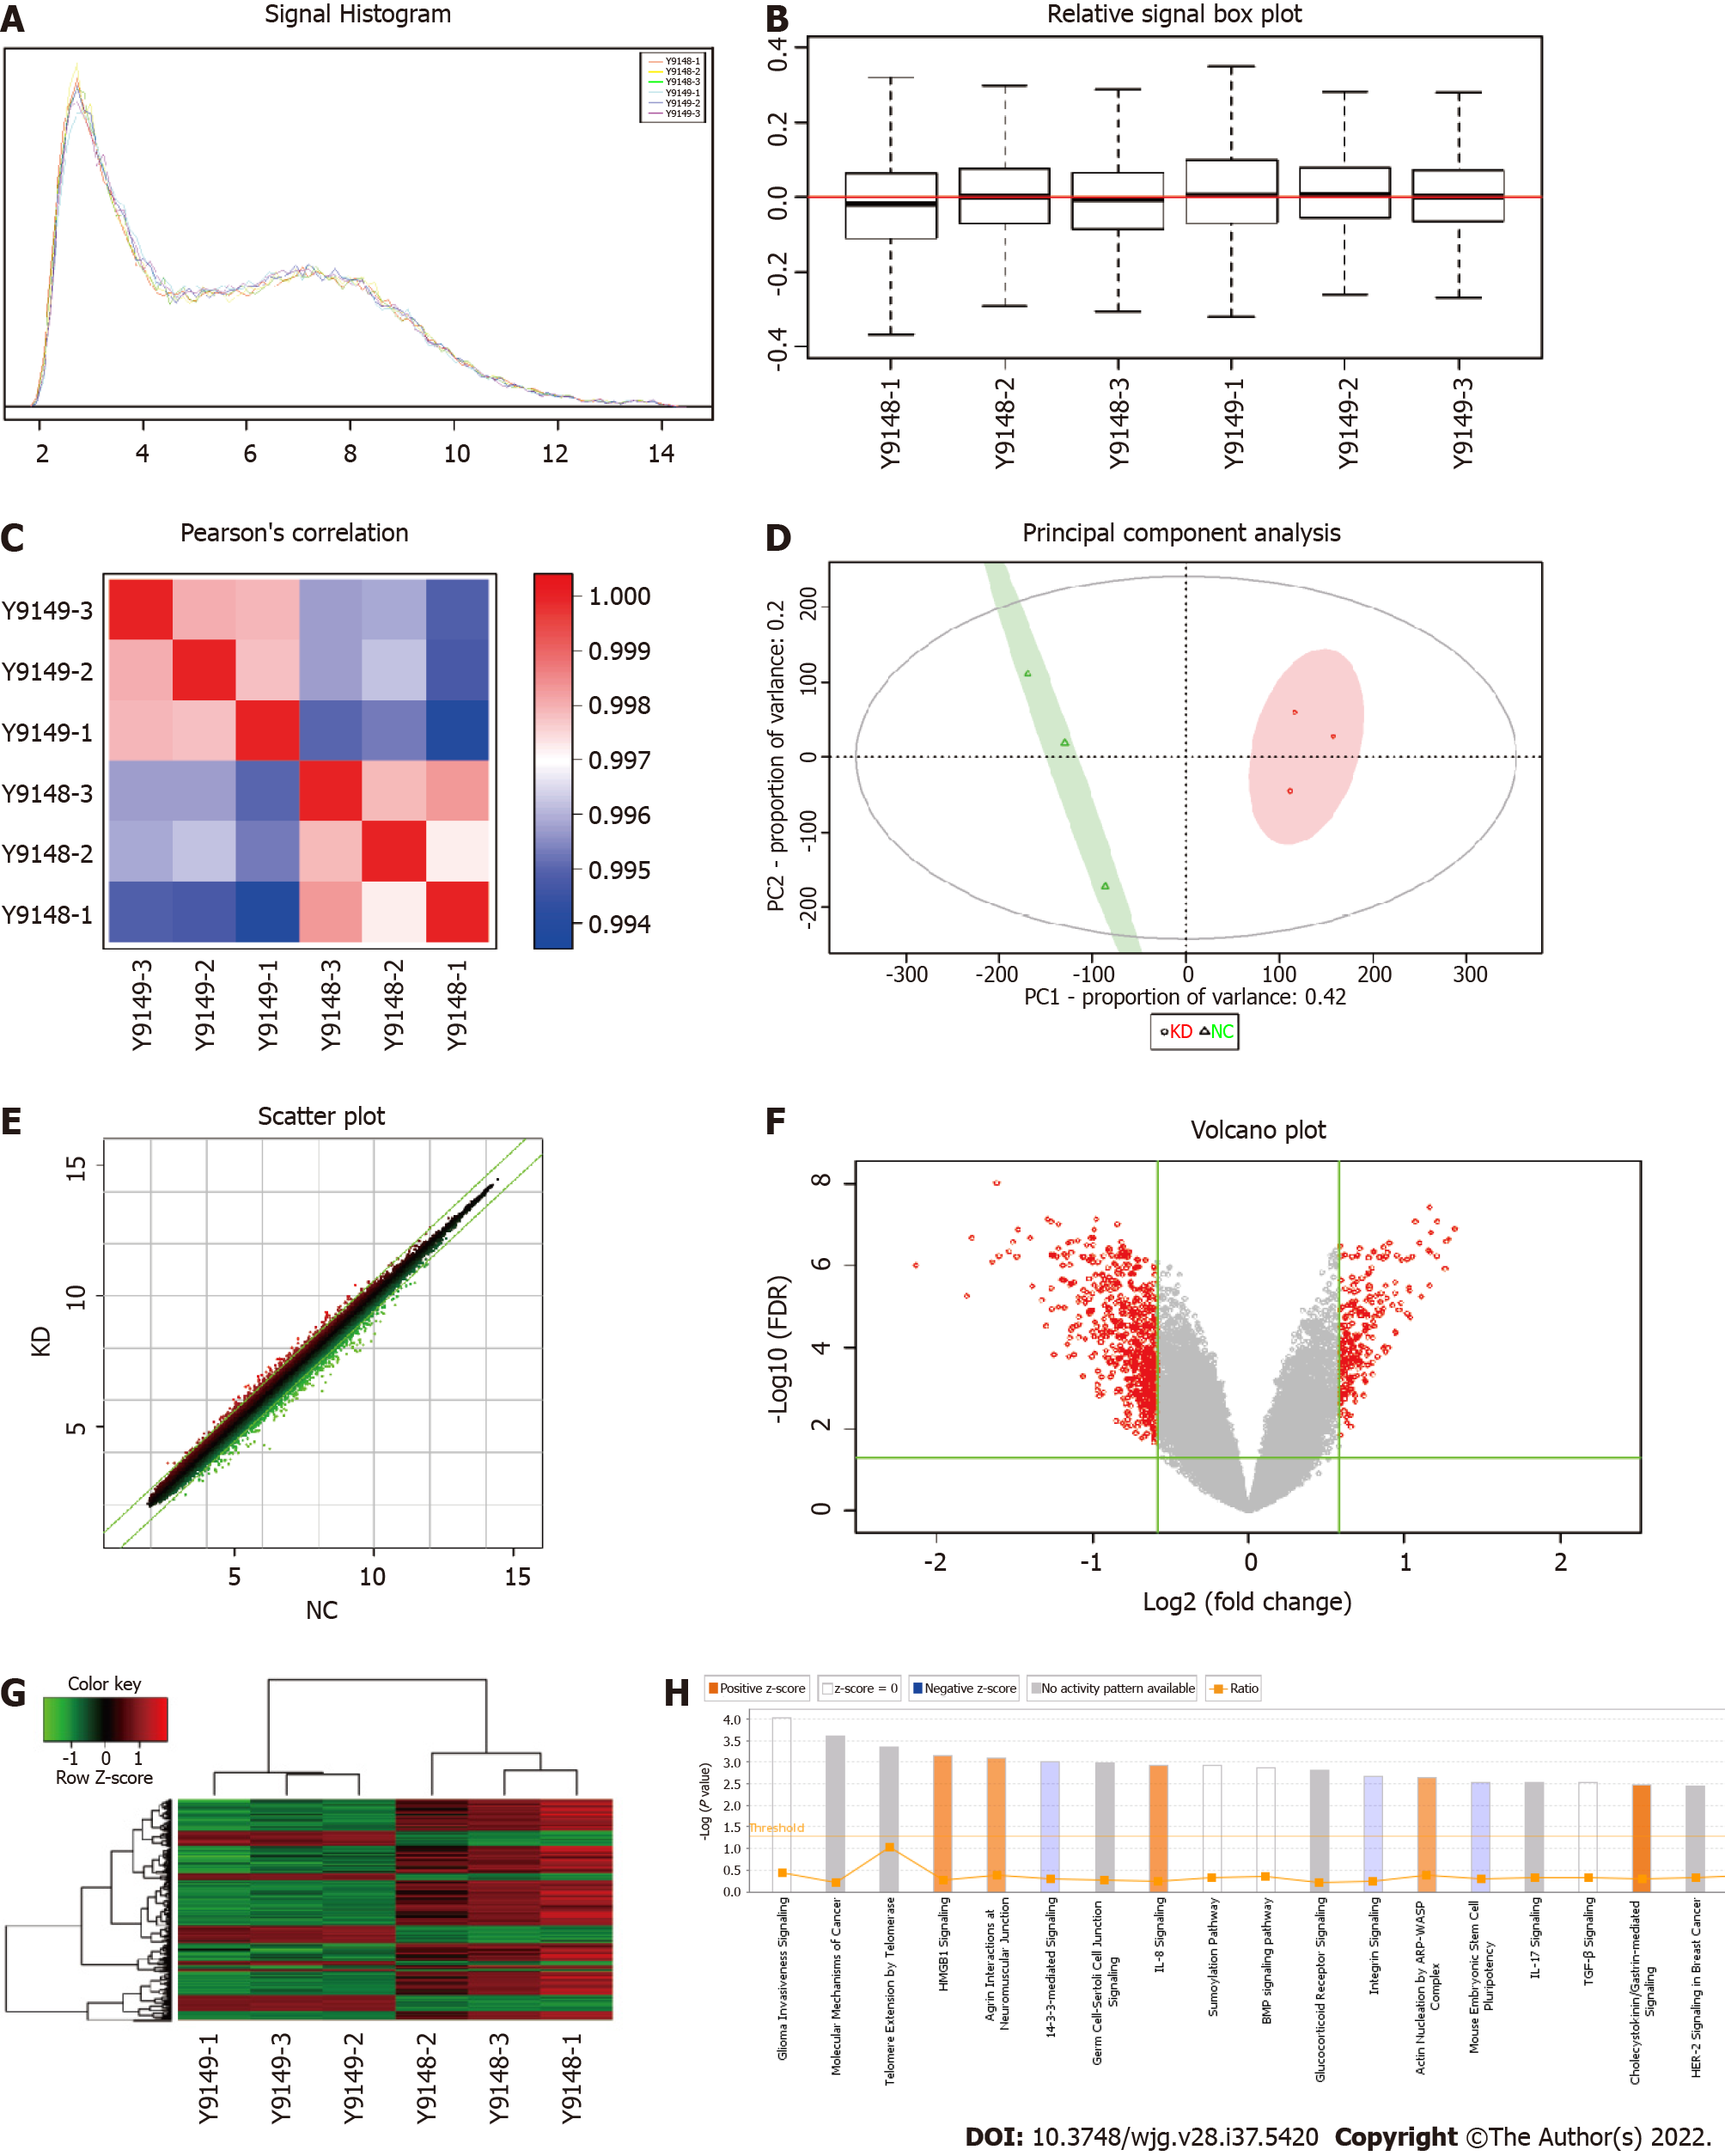
Figure 2 Screening of target genes by chip detection.
A: Signal strength distribution curve diagram, with the cross coordinates representing the probe signal strength range and the longitudinal coordinates representing the number of probe sets within the signal strength range; B: Relative line ram of the logarithmic signal strength, with the horizontal coordinate representing the sample name, the vertical coordinate indicating the relative logarithmic signal strength, the red line in the middle representing the average of the relative logarithmic signal strength of all samples, and the upper and lower horizontal lines representing the 90% confidence interval. The upper and lower edges represent the upper and lower quartiles, and the black line in the middle represents the median; C: Distribution diagram of the Pearson correlation coefficient among samples. The correlation coefficient indicates a positive correlation of the expression mode of genes in two subjects, and a negative value indicates an expression mode with a negative correlation. As the absolute value of the correlation coefficient approaches 1.0, the correlation increases; D: Principal component analysis. Red dots represent normal purpose cells with centromere protein K (CENPK) gene short hairpin RNA virus infection (KD) samples, and green dots represent normal purpose cells infected with CENPK negative control virus (NC) samples; E: Scatter diagram. The cross coordinate represents the NC group, and the vertical coordinate represents the KD group; F: Volcano map, where the cross coordinate is a difference multiple (the logarithmic change in the bottom 2); longitudinal significance false discovery rate (FDR) (of the difference in the bottom 10 Logarithmic change); significantly different genes screened by |fold change| ≥ 1.5 and FDR < 0.05 in red, and other genes with no significant difference in gray; G: Cluster analysis results. Each column represents a sample, and each row represents a differentially expressed gene; H: Statistics for the classical pathway enrichment analysis. The transverse coordinate is the path name and the longitudinal significance level of enrichment (negative logarithmic transformation in the bottom 10).
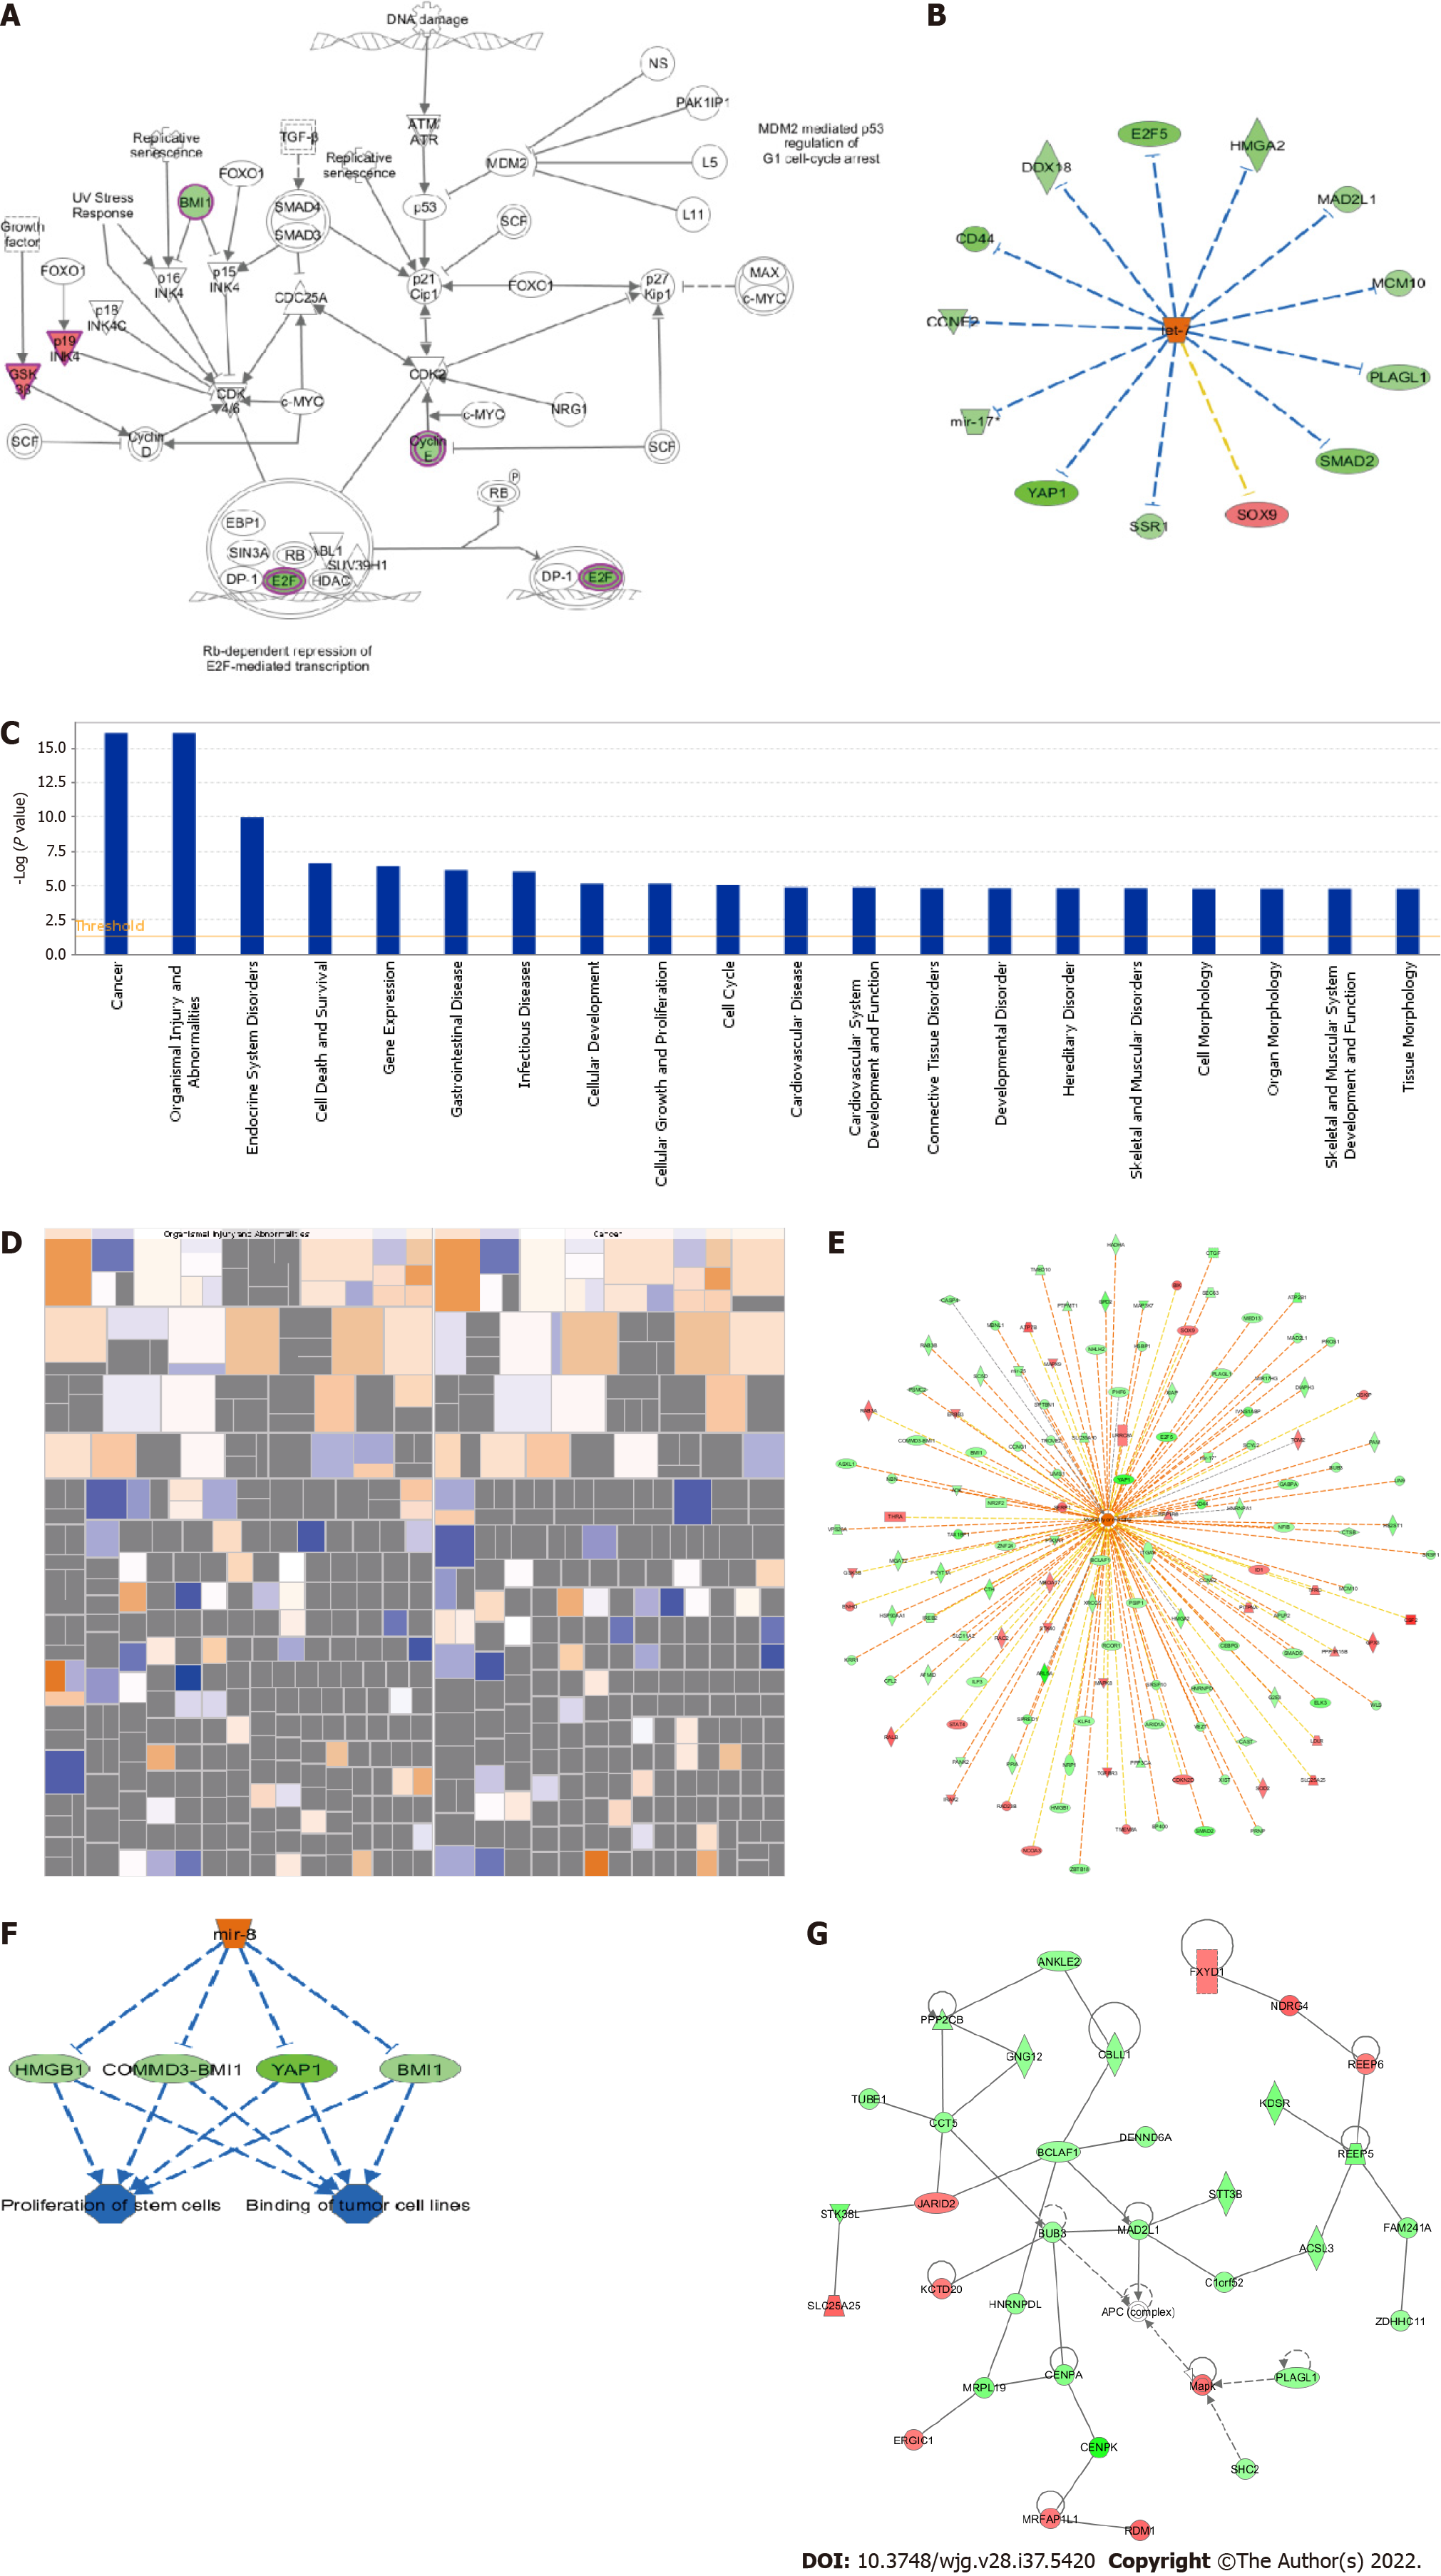
Figure 3 Centromere protein K functions in colon cancer by regulating the expression of related genes.
A: Trend of molecules in the experimental results in the classical pathway; B: Upstream regulator network diagram (the orange line indicates consistent activation of upstream regulators and genes, the blue line indicates consistent upstream regulators and gene inhibition, the yellow line indicates inconsistent expression trends between upstream regulators and genes, and the gray line indicates that there is no prediction information related to the expression state in the dataset); C: Analysis and statistics of disease and functional enrichment (the transverse coordinate is the path name and the longitudinal coordinate is significance level of enrichment (negative logarithmic transformation in the bottom 10); D: Disease and functional heatmap of the effect of disease and functional changes at gene expression levels; E: Activation and inhibition relationship between genes and disease or function; F: Interplay between genes and regulators and function in the dataset; G: Network of interaction relationships between molecules of a disease or function-related relationship. TGF-β: Transforming growth factor beta; FOXO: Forkhead box O; SMAD: Suppressor of mothers against decapentaplegic; MDM: Mouse double minute; ATM: Ataxia telangiectasia mutated; ATR: Ataxia telangiectasia and Rad3 related; PAK: p21 activated kinases; NS: Non-structural; MAX: MYC associated factor X; c-MYC: Cellular myelocytomatosis oncogene; SCF: Stem cell factor; INK: CDKN2A, cyclin dependent kinase inhibitor 2A; BMI 1: BMI1 proto-oncogene; GSK: Guanosine kinase; CDK: Cyclin-dependent kinase; NRG: Neuregulin; EBP1: ErbB3-binding protein 1; SIN3A: Suppressor interacting 3a; SUV39H1: SUV39H1 histone lysine methyltransferase; DP-1: Dodeca-satellite-binding protein 1; E2F: Early region 2 binding factor; RB: Retinoblastoma; HDAC: Histone deacetylase; CD44: Cluster of differentiation-44; DDX18: DEAD-box helicase 18; HMGA: High mobility group A; MAD2L1: Mitotic arrest deficient 2 like 1; MCM: Mei-mini-chromosome maintenance; PLAGL: Pleiomorphic adenoma gene-like; SOX: SRY-box transcription factor; SSR: Signal sequence receptor subunit; YAP1: Yes1 associated transcriptional regulator; CCNE2: Cyclin E2; COMMD3: COMM domain containing 3.
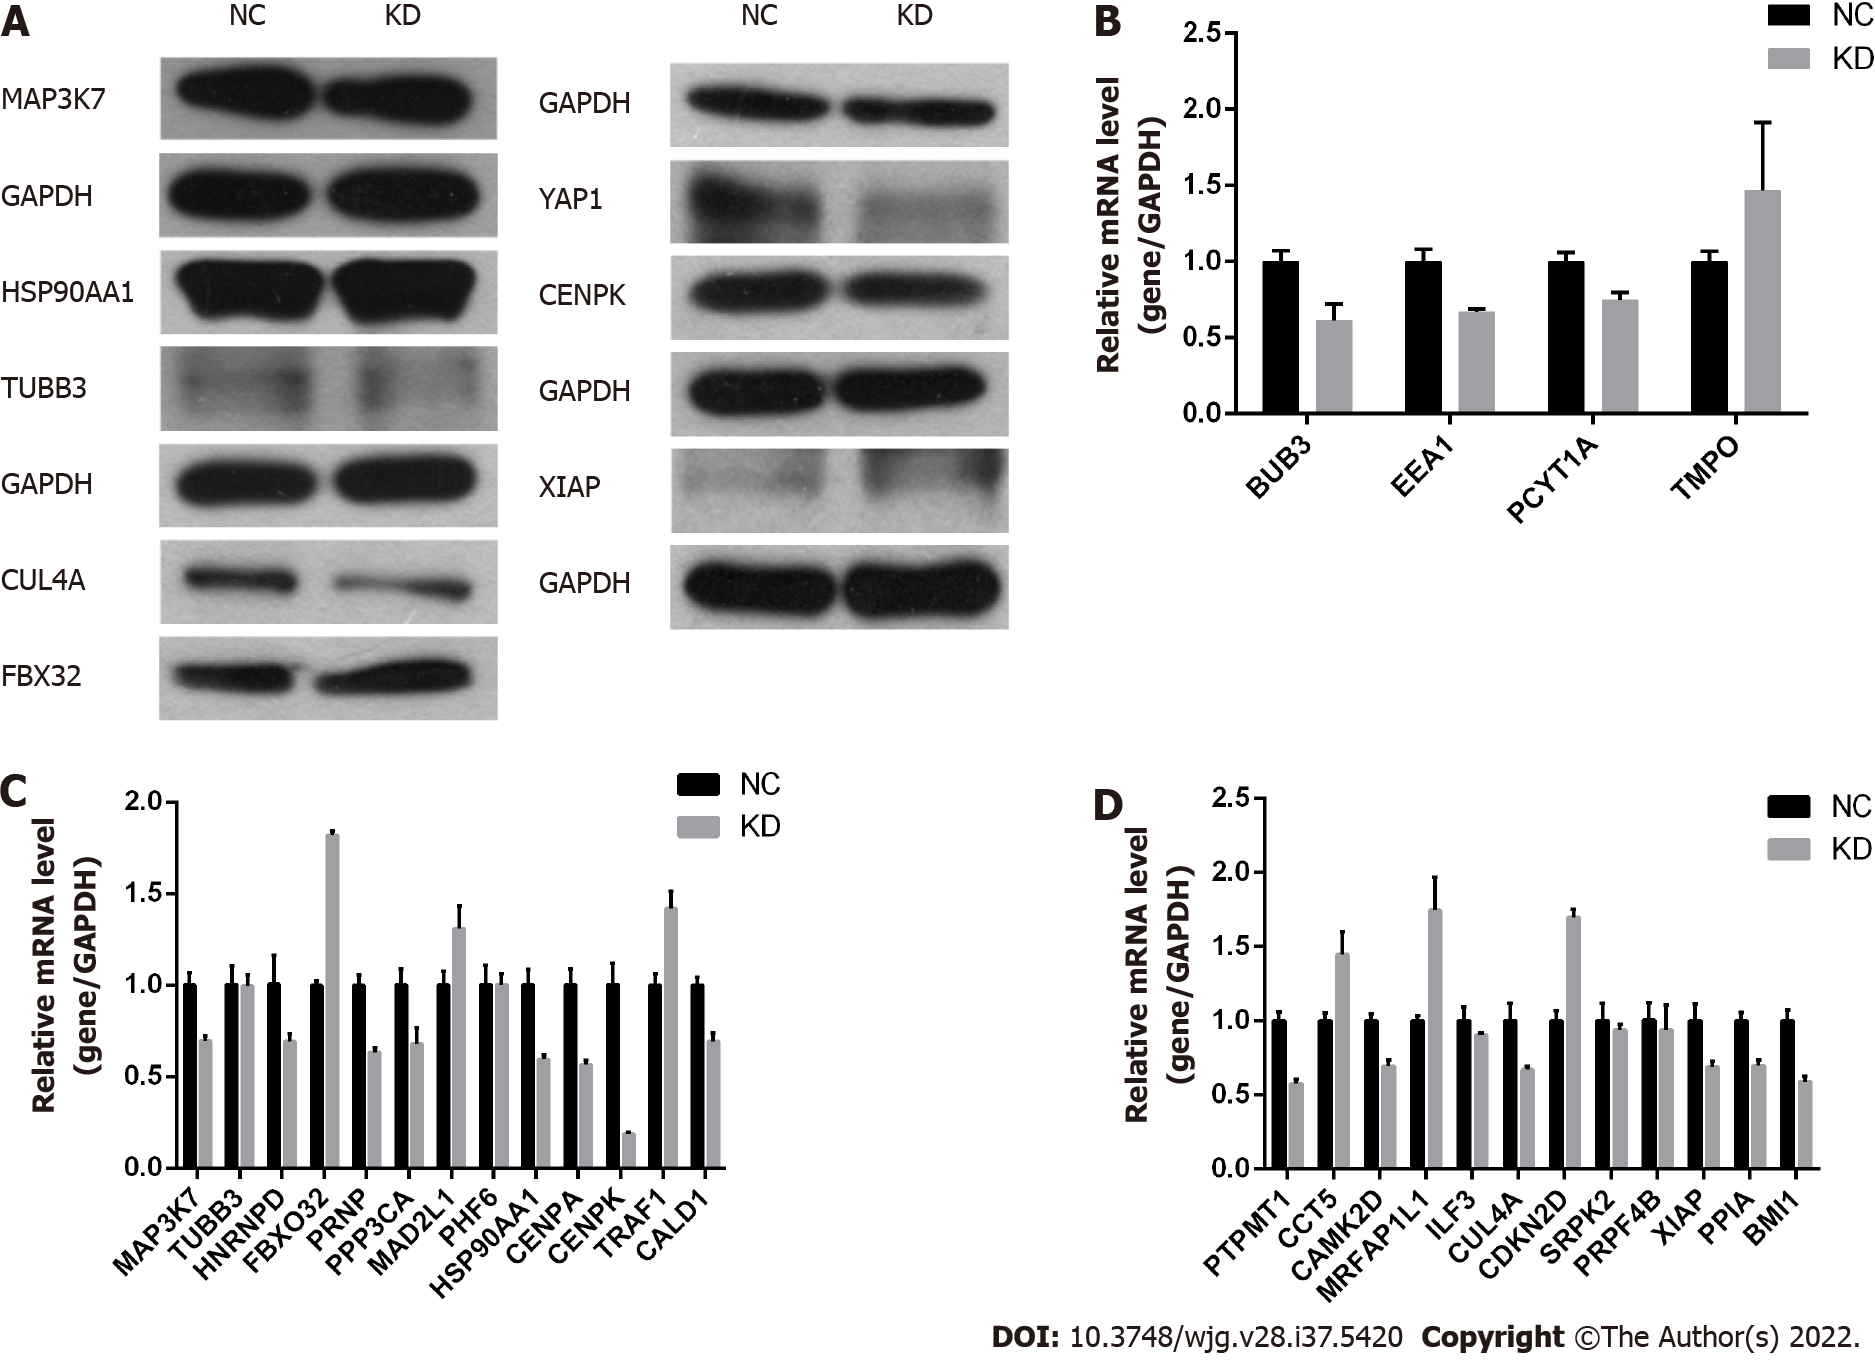
Figure 4 Centromere protein K plays a role by regulating F-box protein 32, Cullin 4A, Yes-associated protein isoform 1, and other genes in RKO cells.
A: Downstream gene (Yes-associated protein isoform 1, centromere protein K, Cullin 4A, F-box protein 32, X chromosome-linked inhibitor of apoptosis, heat shock protein 90 alpha family class A member 1, class III-tubulin, and mitogen-activated protein kinase kinase kinase 7) testing using western blot analysis in NC and KD groups; B-D: Relative gene expression detected using quantitative polymerase chain reaction in NC and KD groups. F-box protein 32 was upregulated, while Cullin 4A and Yes-associated protein isoform 1 were downregulated. FBX32: F-box protein 32; YAP1: Yes-associated protein isoform 1; CENPK: Centromere protein K; CUL4A: Cullin 4A; XIAP: X chromosome-linked inhibitor of apoptosis; HSP90AA1: Heat shock protein 90 alpha family class A member 1; TUBB3: Class III-tubulin; MAP3K7: Mitogen-activated protein kinase kinase kinase 7; BUB3: BUB3 mitotic checkpoint protein; EEA1: Early endosomal antigen 1; PCYT1A: Phosphate cytidylyltransferase 1A; TMPO: Thymopoietin; HNRNPD: Heterogeneous nuclear ribonucleoprotein D; PRNP: Prion protein; PPP3CA: Protein phosphatase 3 catalytic subunit alpha; MAD2L1: Mitotic arrest deficient 2 like 1; PHF6: PHD finger protein 6; CENPA: Centromere protein A; TRAF1: TNF receptor associated factor 1; CALD1: Caldesmon 1; PTPMT1: Protein tyrosine phosphatase mitochondrial 1; CCT5: Chaperonin containing TCP1 subunit 5; CAMK2D: Calcium/calmodulin dependent protein kinase II delta; MRFAP1L1: Morf4 family associated protein 1 like 1; ILF3: Interleukin enhancer binding factor 3; CDKN2D: Cyclin dependent kinase inhibitor 2D; SRPK2: SRSF protein kinase 2; PRPF4B: Pre-mRNA processing factor 4B; PPIA: Peptidylprolyl isomerase A; BMI1: BMI1 proto-oncogene; GAPDH: Glyceraldehyde-3-phosphate dehydrogenase. NC: RKO cells infected with CENPK negative control virus; KD: RKO cells with lentivirus-mediated short hairpin RNA interference of CENPK.
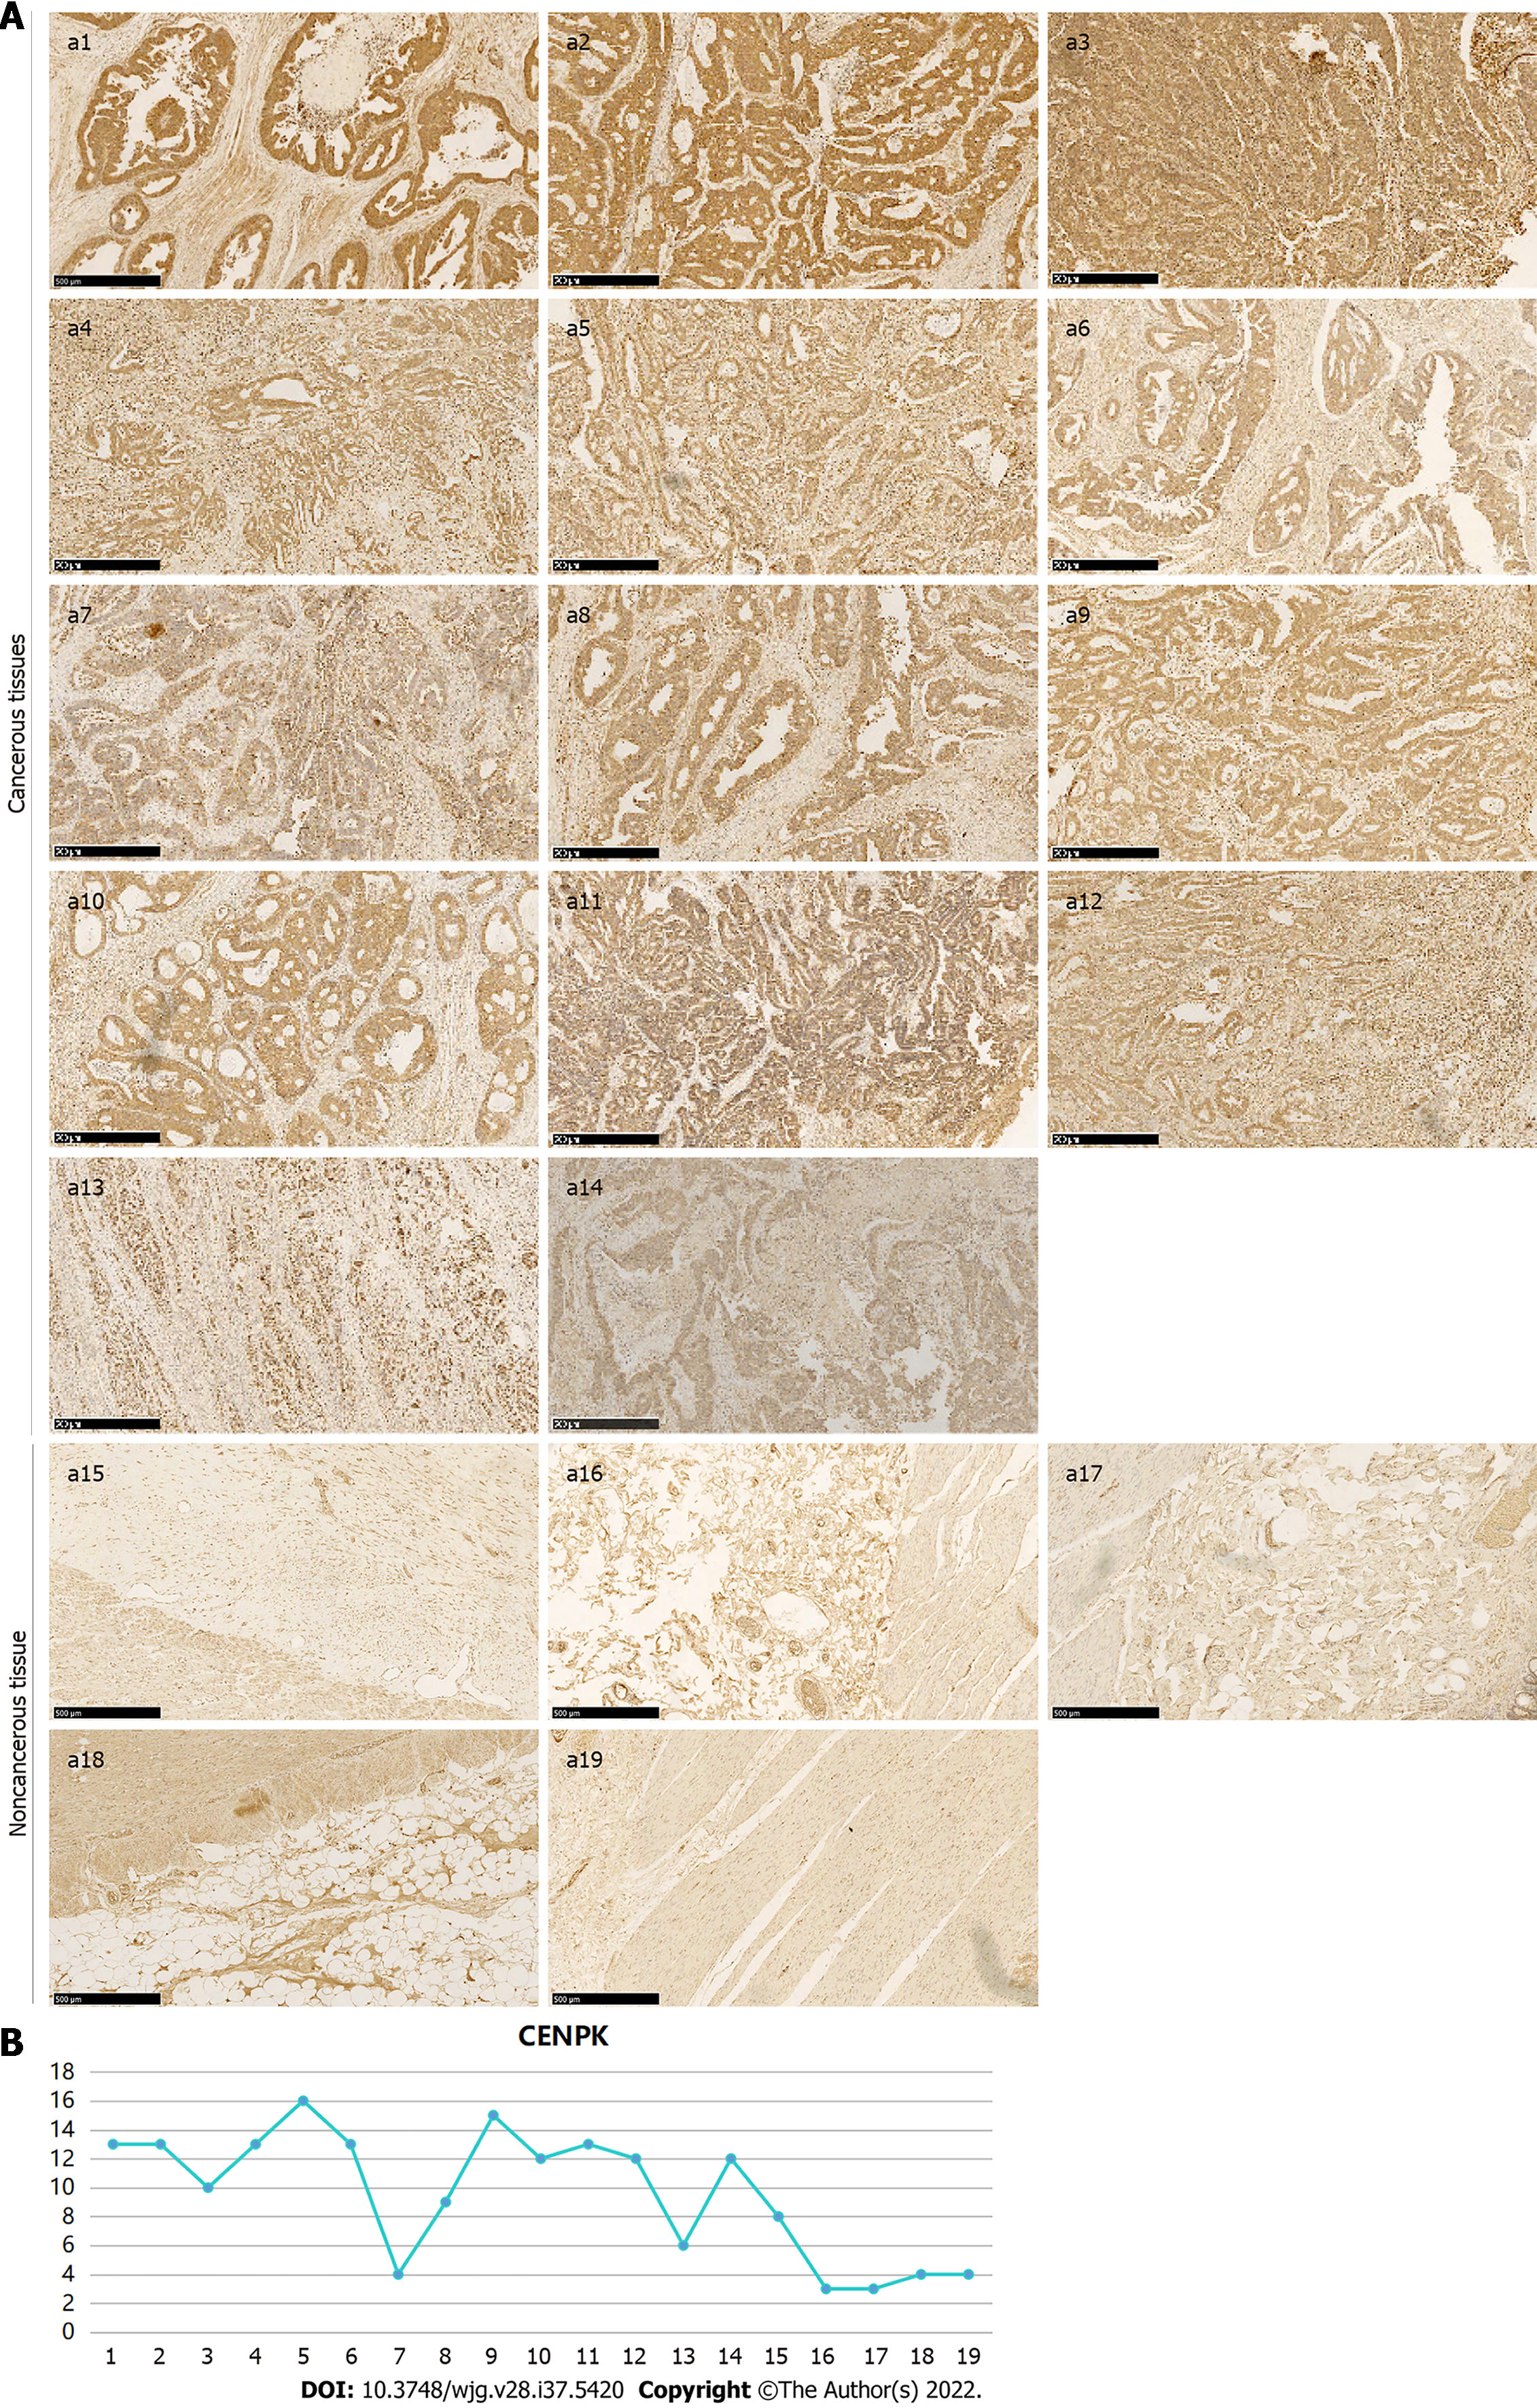
Figure 5 Expression of centromere protein K in colon cancer tissue and noncancerous tissue detected using immunohistochemistry.
A: Centromere protein K (CENPK) expression in cancerous (a1-a14) and noncancerous tissue (a15-a19) using immunohistochemistry (Scale bar: 500 μm) with VULCAN FAST RED CHROMOGEN kit 2; B: Positive expression of CENPK in cancerous and noncancerous tissues. CENPK: Centromere protein K.
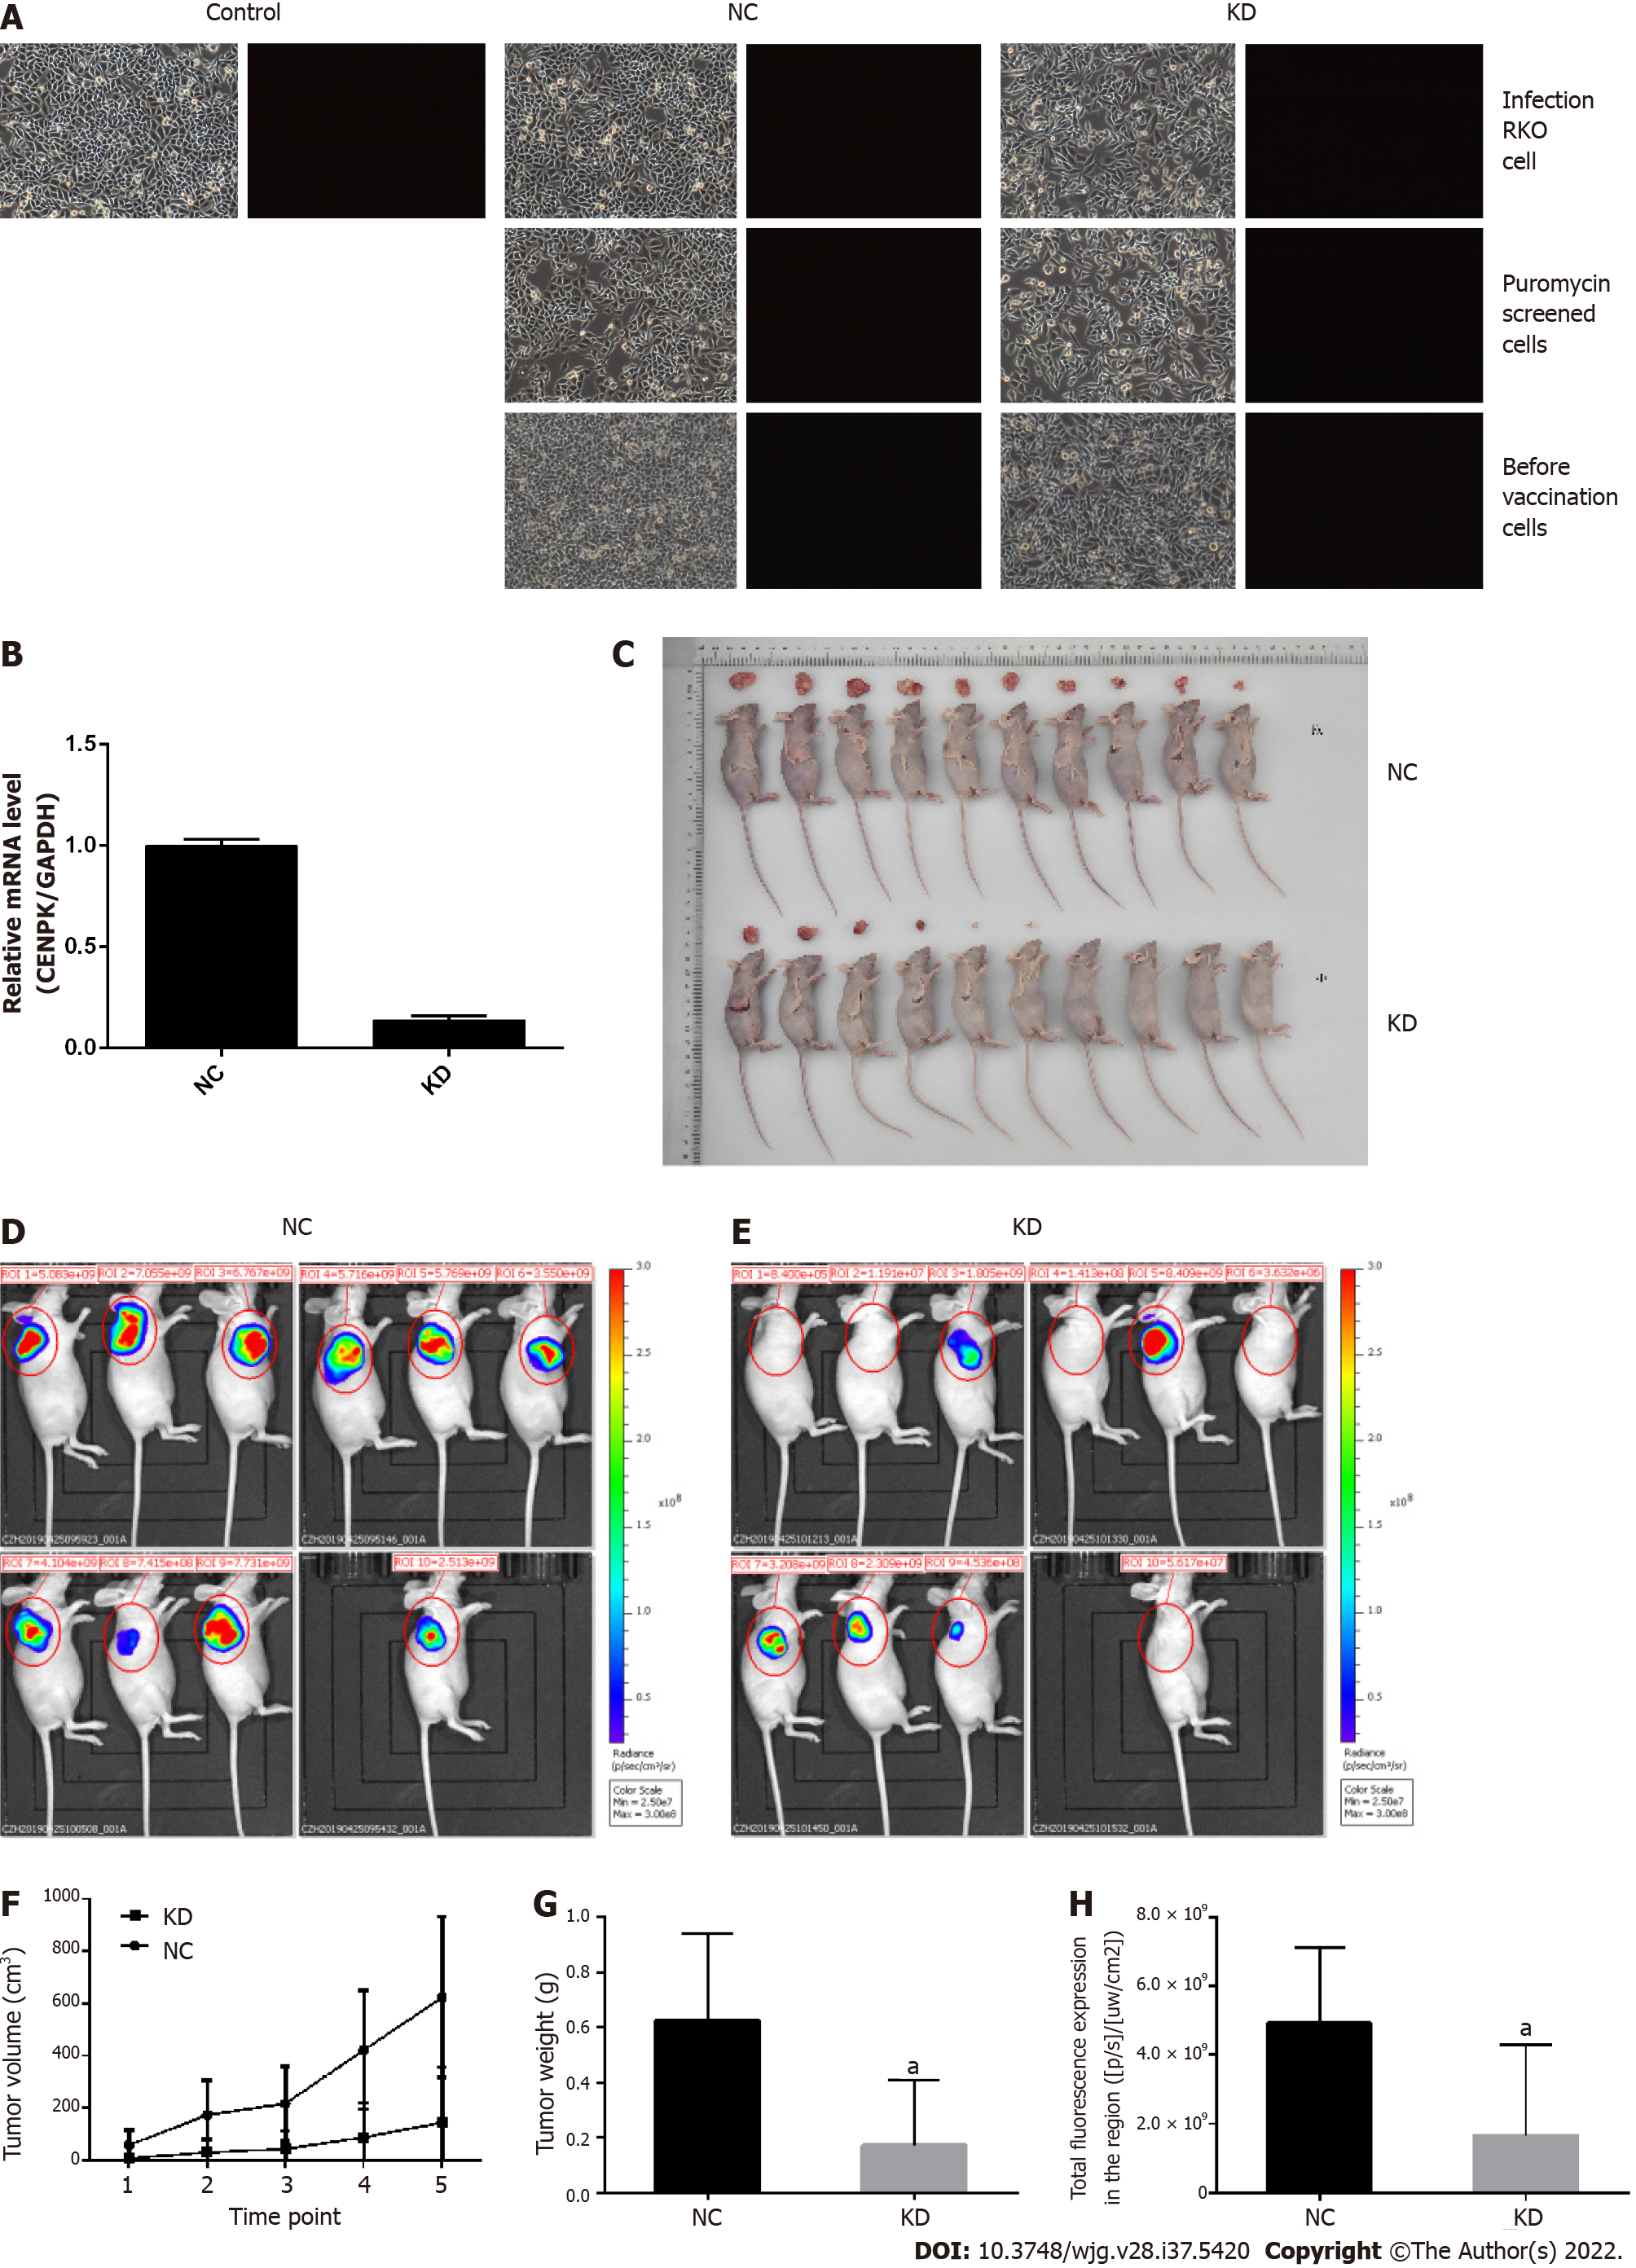
Figure 6 Analysis of tumor growth in nude mice subcutaneously injected with lentivirus-infected RKO cells.
A: Control lentivirus-infected RKO cells, RKO cells infected with centromere protein K (CENPK) negative control virus (NC), and RKO cells with CENPK gene short hairpin RNA virus infection (KD); puromycin-screened cells in the NC and KD groups; and RKO cells in the NC and KD groups before inoculation are shown (× 100 magnification). On the left and right are bright field and fluorescence images, respectively; B: Real-time polymerase chain reaction detection of CENPK mRNA expression in RKO cells; C: Tumor status in nude mice subcutaneously injected with lentivirus-infected RKO cells in the NC and KD groups. D: Isoflurane gas anesthesia was applied for live imaging under a live imager in the NC group; E: Isoflurane gas anesthesia was applied for live imaging under a live imager in the KD group; F: Tumor volume of lentivirus-infected RKO cells examined in nude mice in the NC and KD groups; G: Tumor weight of lentivirus-infected RKO cells were examined in nude mice in the NC and KD groups; H: Regional total fluorescence expression in the NC and KD groups. aP < 0.05, compared with RKO cells infected with centromere protein K negative control virus. CENPK: Centromere protein K; NC: RKO cells infected with centromere protein K negative control virus; KD: RKO cells with lentivirus-mediated short hairpin RNA interference of centromere protein K.
Figure 7 Effects of centromere protein K on proliferation of RKO cells.
A: Expression of the centromere protein K (CENPK) gene in colon cancer cells; B and C: CENPK mRNA level reduction in RKO and HCT116 cells; D: Exogenous expression of CENPK protein in RKO cells (a), 293T cells (b), and HCT116 cells (c); E and F: Effects of CENPK gene reduction on RKO cell proliferation by Celigo detection; G: Effects of CENPK gene reduction on RKO and HCT116 cell proliferation detected by MTT assay; H: Effects of CENPK gene reduction on HCT116 cell proliferation by Celigo detection; I: Effects of CENPK gene reduction on RKO and HCT116 cell apoptosis by caspases 3/7 detection; J: Effects of CENPK gene reduction on RKO and HCT116 cell apoptosis by FACS detection; K: Chemiluminescence analysis in the shCtrl and shCENPK groups. aP < 0.01, compared with shCtrl; bP < 0.05, shCtrl compared to the short hairpin RNA lentivirus treatment group; cP < 0.01, shCtrl compared to the short hairpin RNA lentivirus treatment group. CENPK: Centromere protein K.
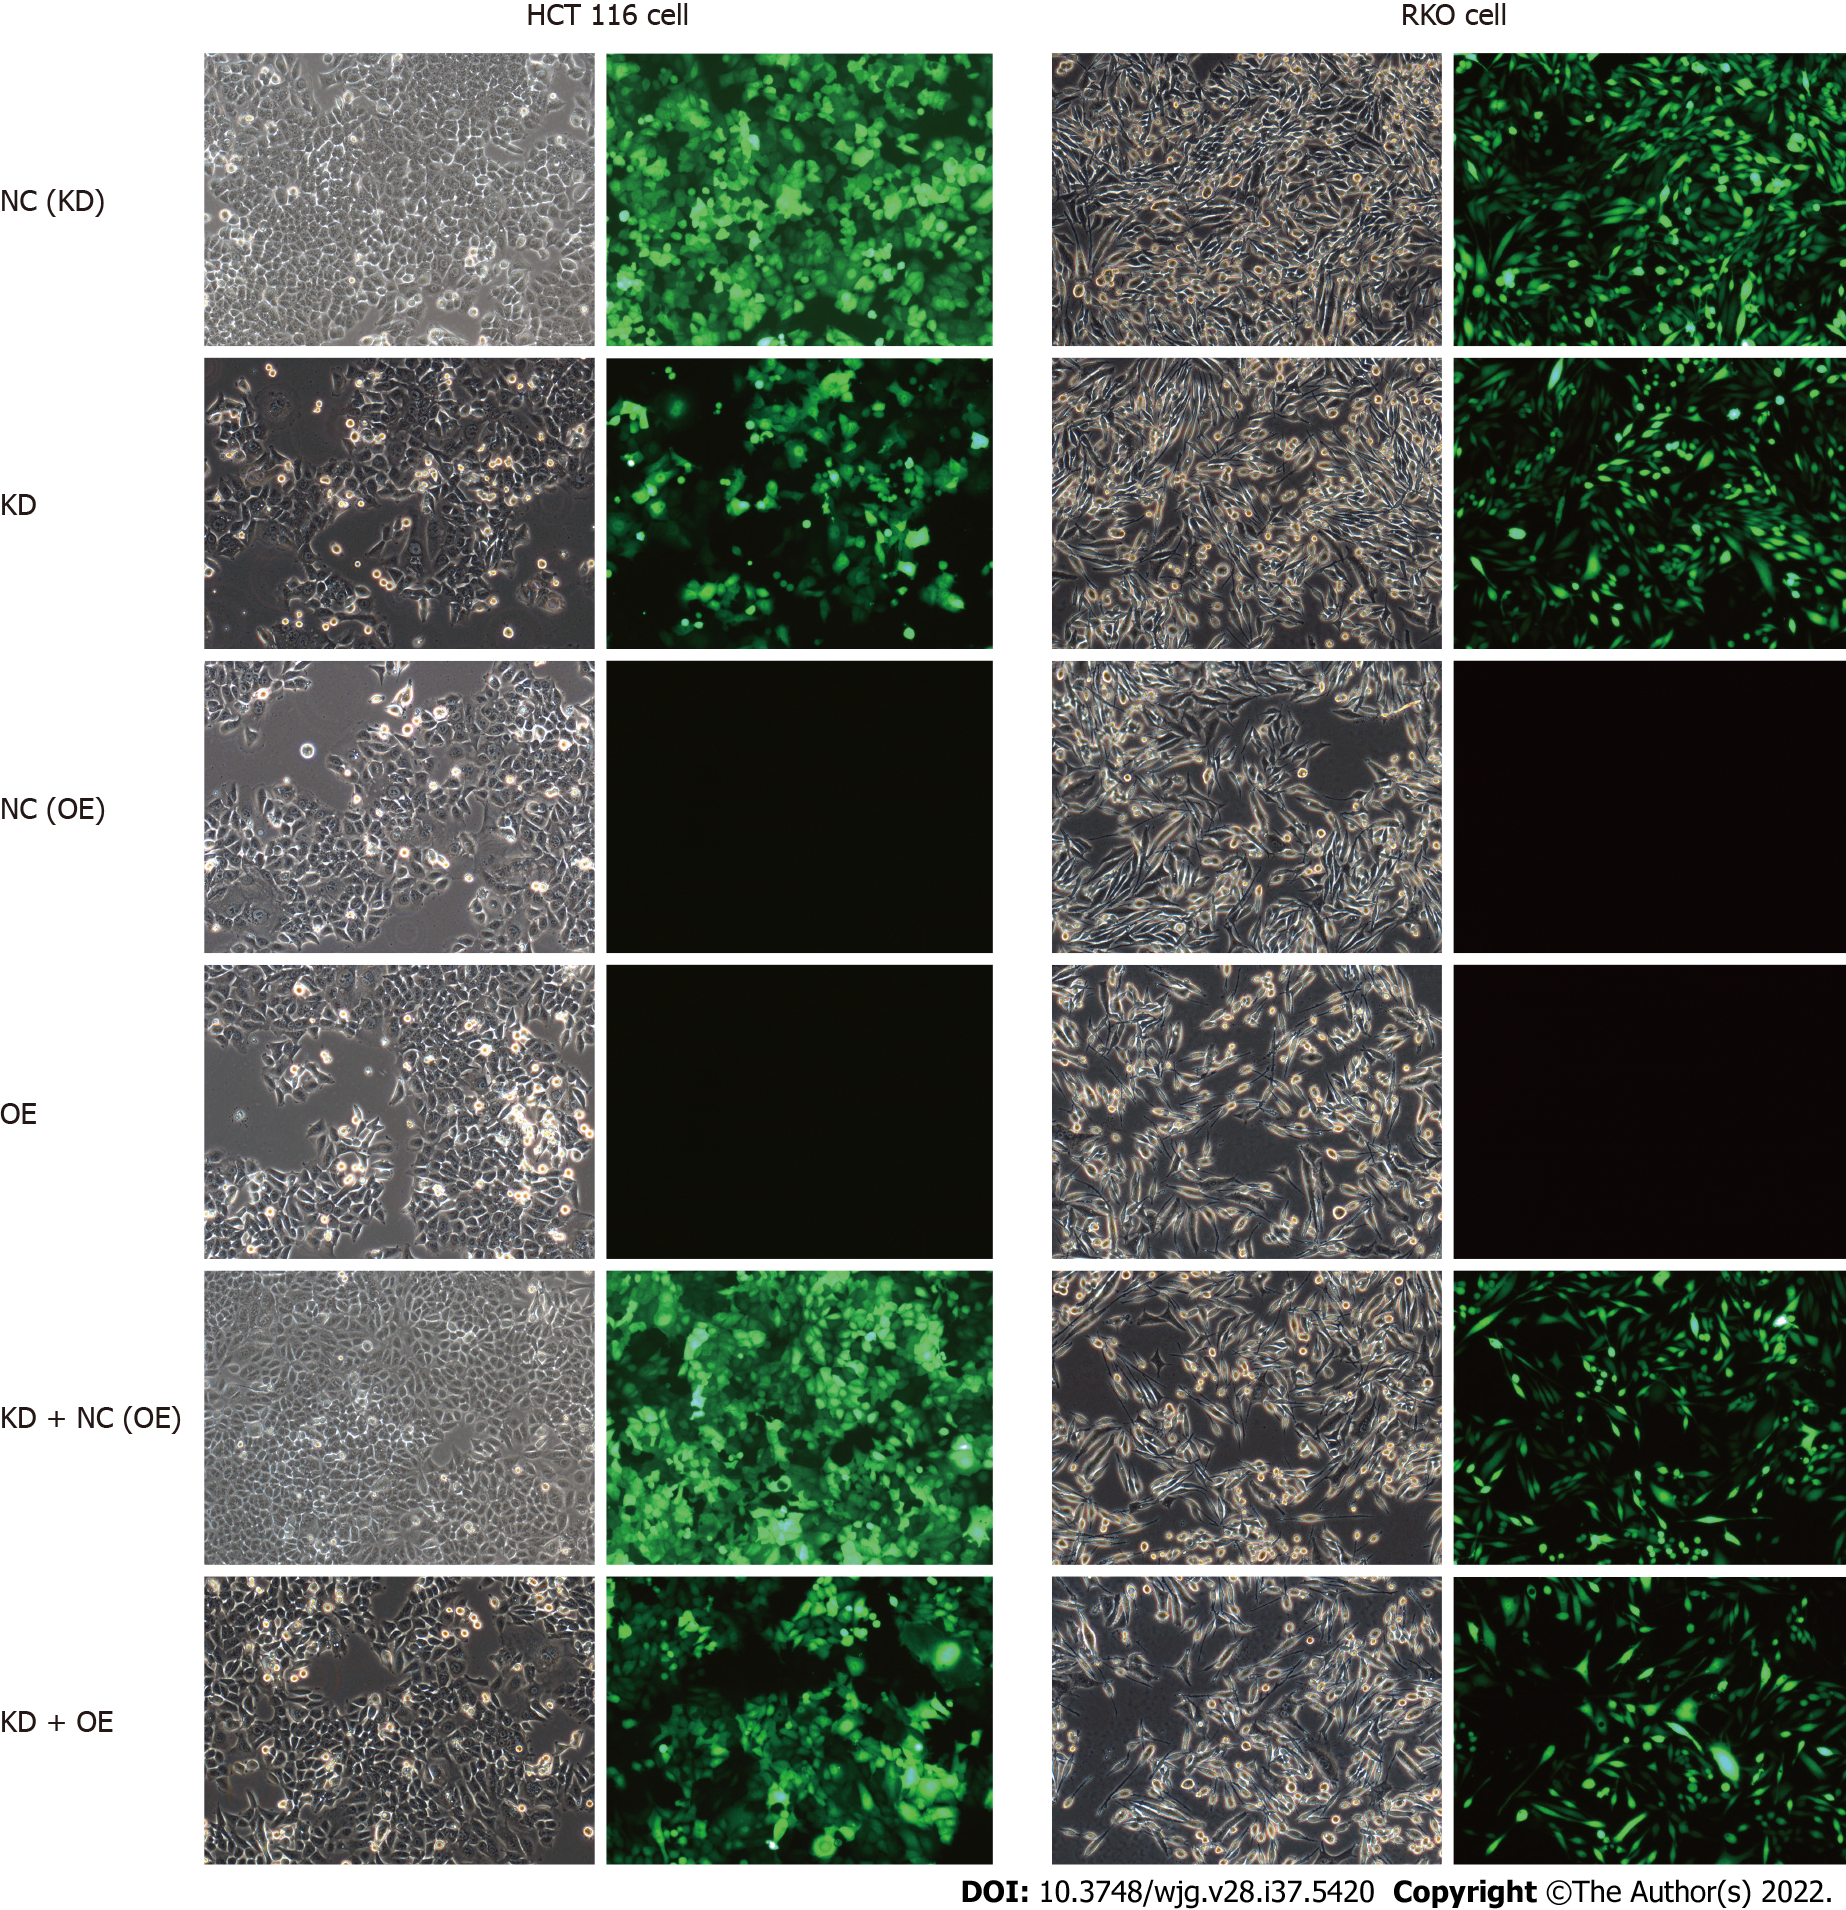
Figure 8 Lentivirus-mediated short hairpin RNA interference of centromere protein K in HCT116 and RKO cells.
Bright field (left) and fluorescence images (right) are shown. NC: RKO or HCT 116 cells infected with centromere protein K negative control virus; KD: RKO or HCT 116 cells with centromere protein K gene short hairpin RNA virus infection; OE: RKO or HCT 116 cells virally infected with Cullin 4A.
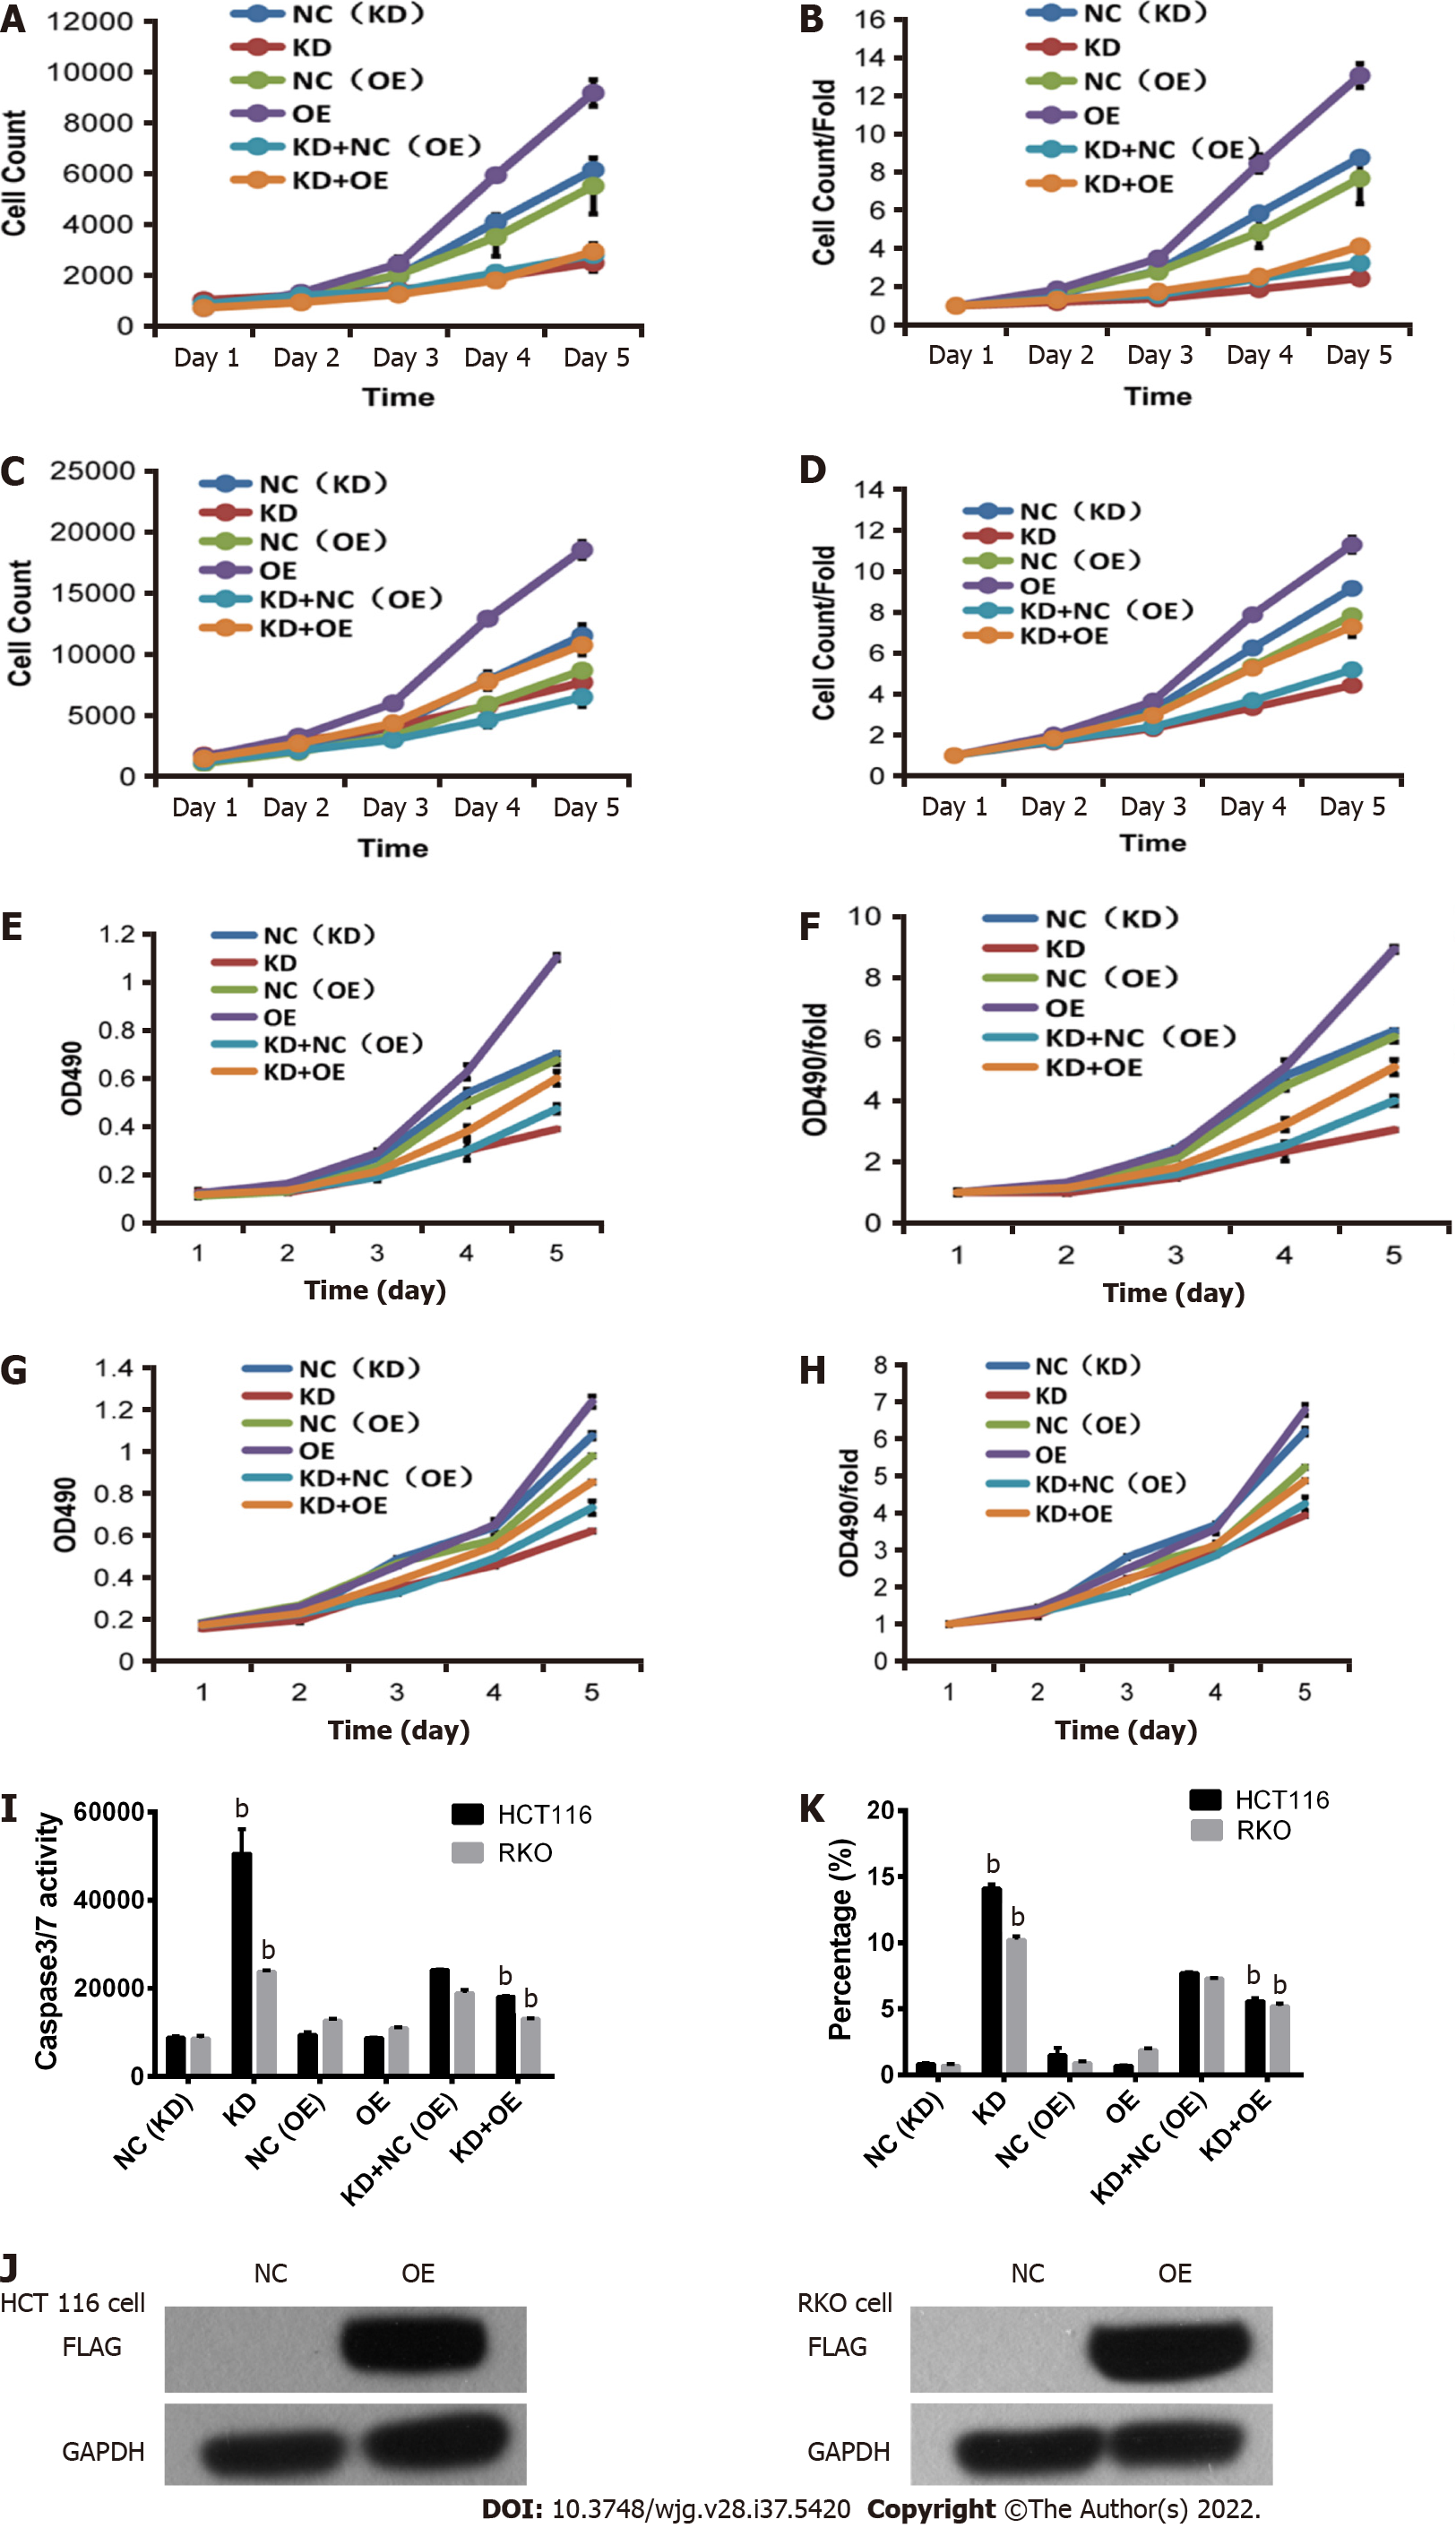
Figure 9 Inhibition of RKO and HCT116 colon cancer cells by abrogation of centromere protein K and overexpression of Cullin 4A.
A and B: Effects of centromere protein K (CENPK) knockdown and Cullin 4A (CUL4A) overexpression on HCT116 cell proliferation detected by Celigo assay; C and D: Effects of CENPK knockdown and CUL4A overexpression on RKO cell proliferation detected by Celigo assay; E and F: Effects of CENPK knockdown and CUL4A overexpression on HCT116 cell proliferation detected by MTT assay; G and H: Effects of CENPK knockdown and CUL4A overexpression on RKO cell proliferation detected by MTT assay; I: HCT116 and RKO cell apoptosis after CENPK knockdown and CUL4A overexpression detected by caspases 3/7; J: FLAG protein expression levels after CUL4A overexpression detected using western blot; K: HCT116 and RKO cell apoptosis. bP < 0.01, shCtrl compared to short hairpin RNA lentivirus treatment group. NC: RKO or HCT 116 cells infected with centromere protein K negative control virus; KD: RKO or HCT 116 cells with centromere protein K gene short hairpin RNA virus infection; OE: RKO or HCT 116 cells virally infected with Cullin 4A.
- Citation: Li X, Han YR, Xuefeng X, Ma YX, Xing GS, Yang ZW, Zhang Z, Shi L, Wu XL. Lentivirus-mediated short hairpin RNA interference of CENPK inhibits growth of colorectal cancer cells with overexpression of Cullin 4A. World J Gastroenterol 2022; 28(37): 5420-5443
- URL: https://www.wjgnet.com/1007-9327/full/v28/i37/5420.htm
- DOI: https://dx.doi.org/10.3748/wjg.v28.i37.5420


