Copyright
©The Author(s) 2022.
World J Gastroenterol. Sep 28, 2022; 28(36): 5324-5337
Published online Sep 28, 2022. doi: 10.3748/wjg.v28.i36.5324
Published online Sep 28, 2022. doi: 10.3748/wjg.v28.i36.5324
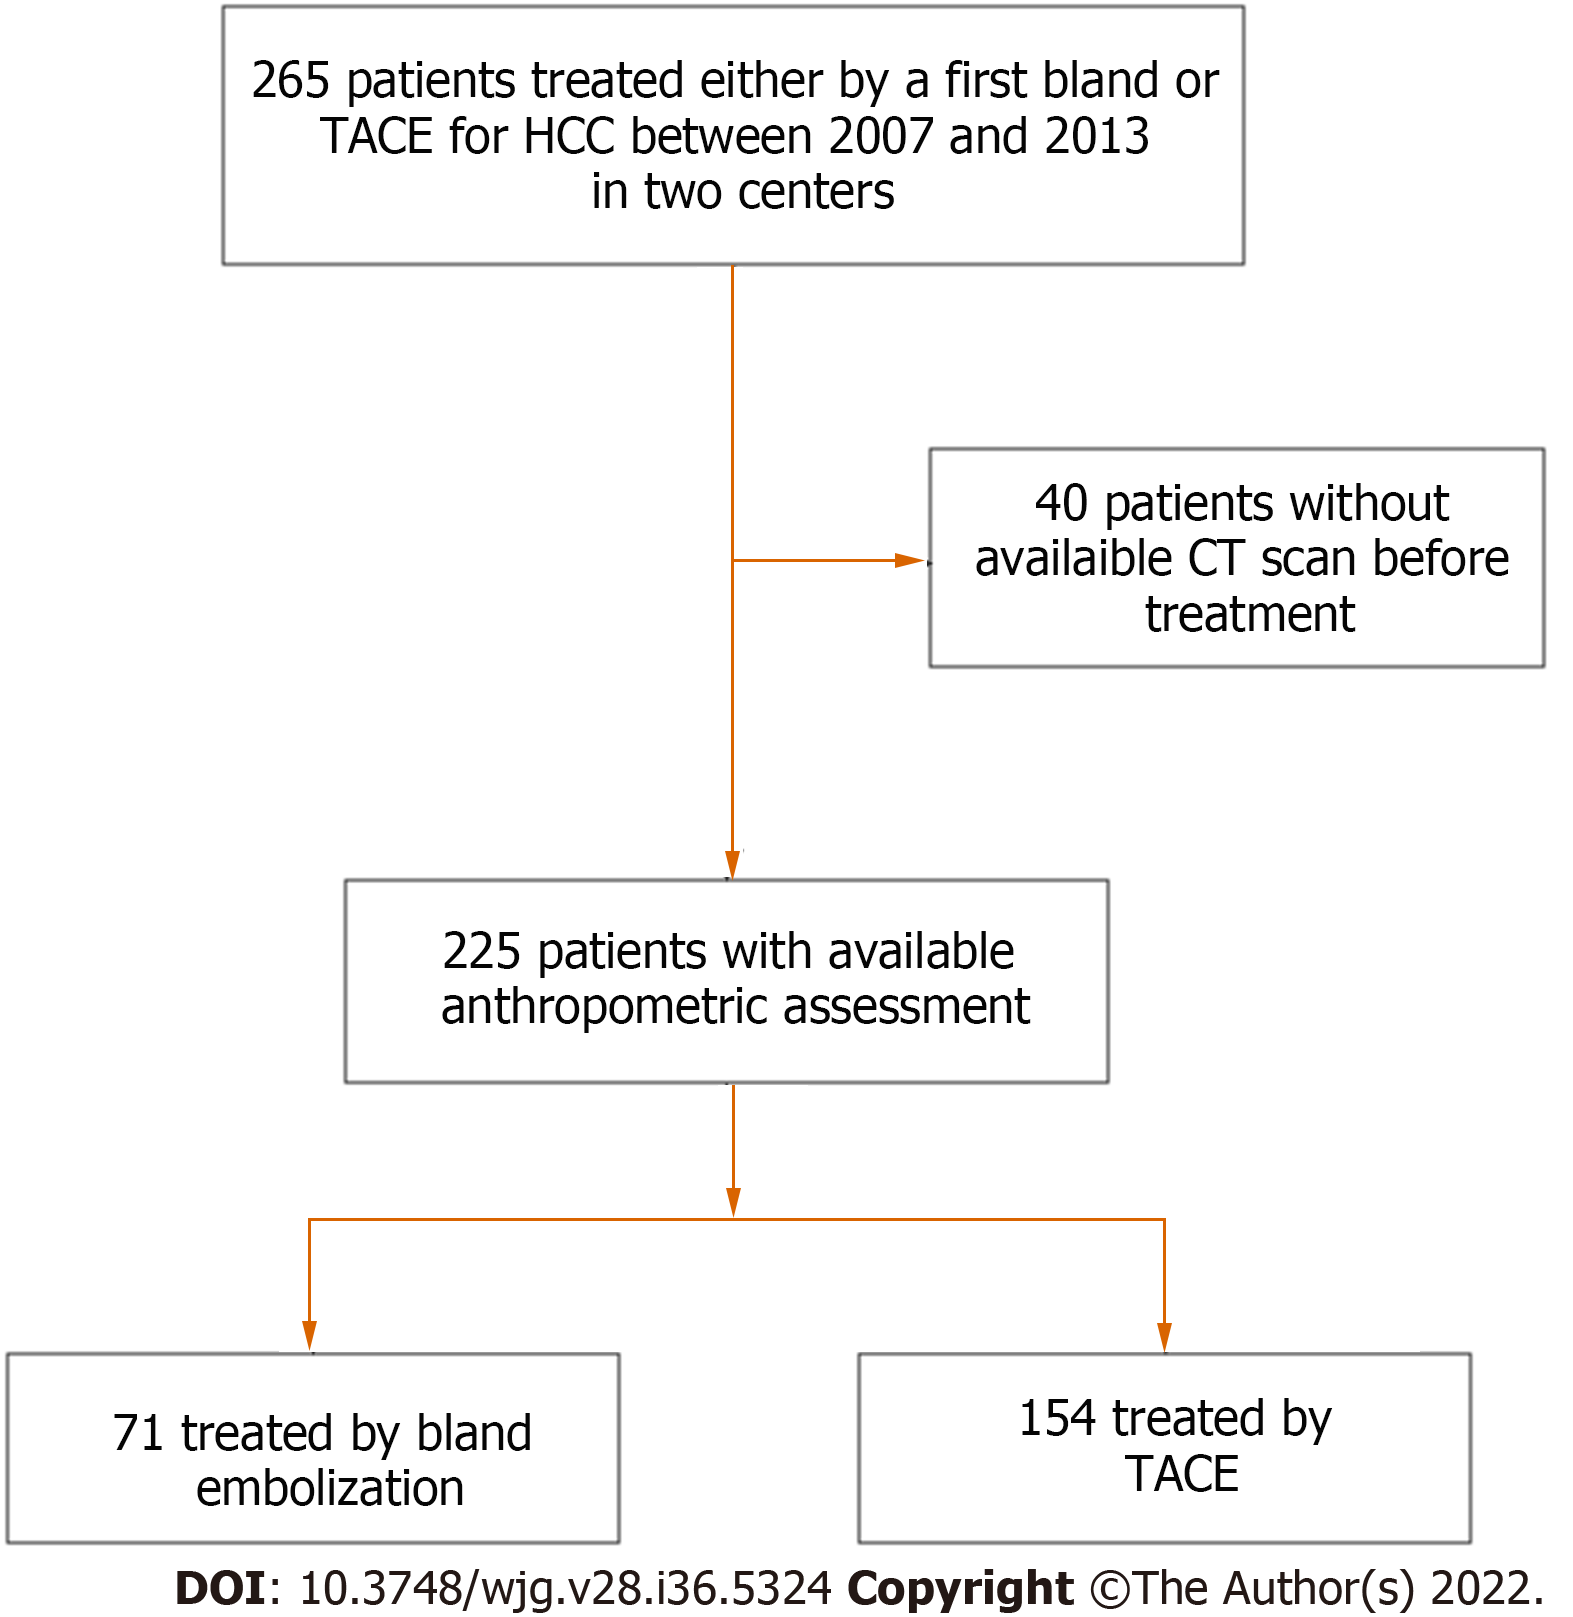
Figure 1 Flowchart of the study.
TACE: Transarterial chemoembolization; CT: Computed tomography; HCC: Hepatocellular carcinoma.
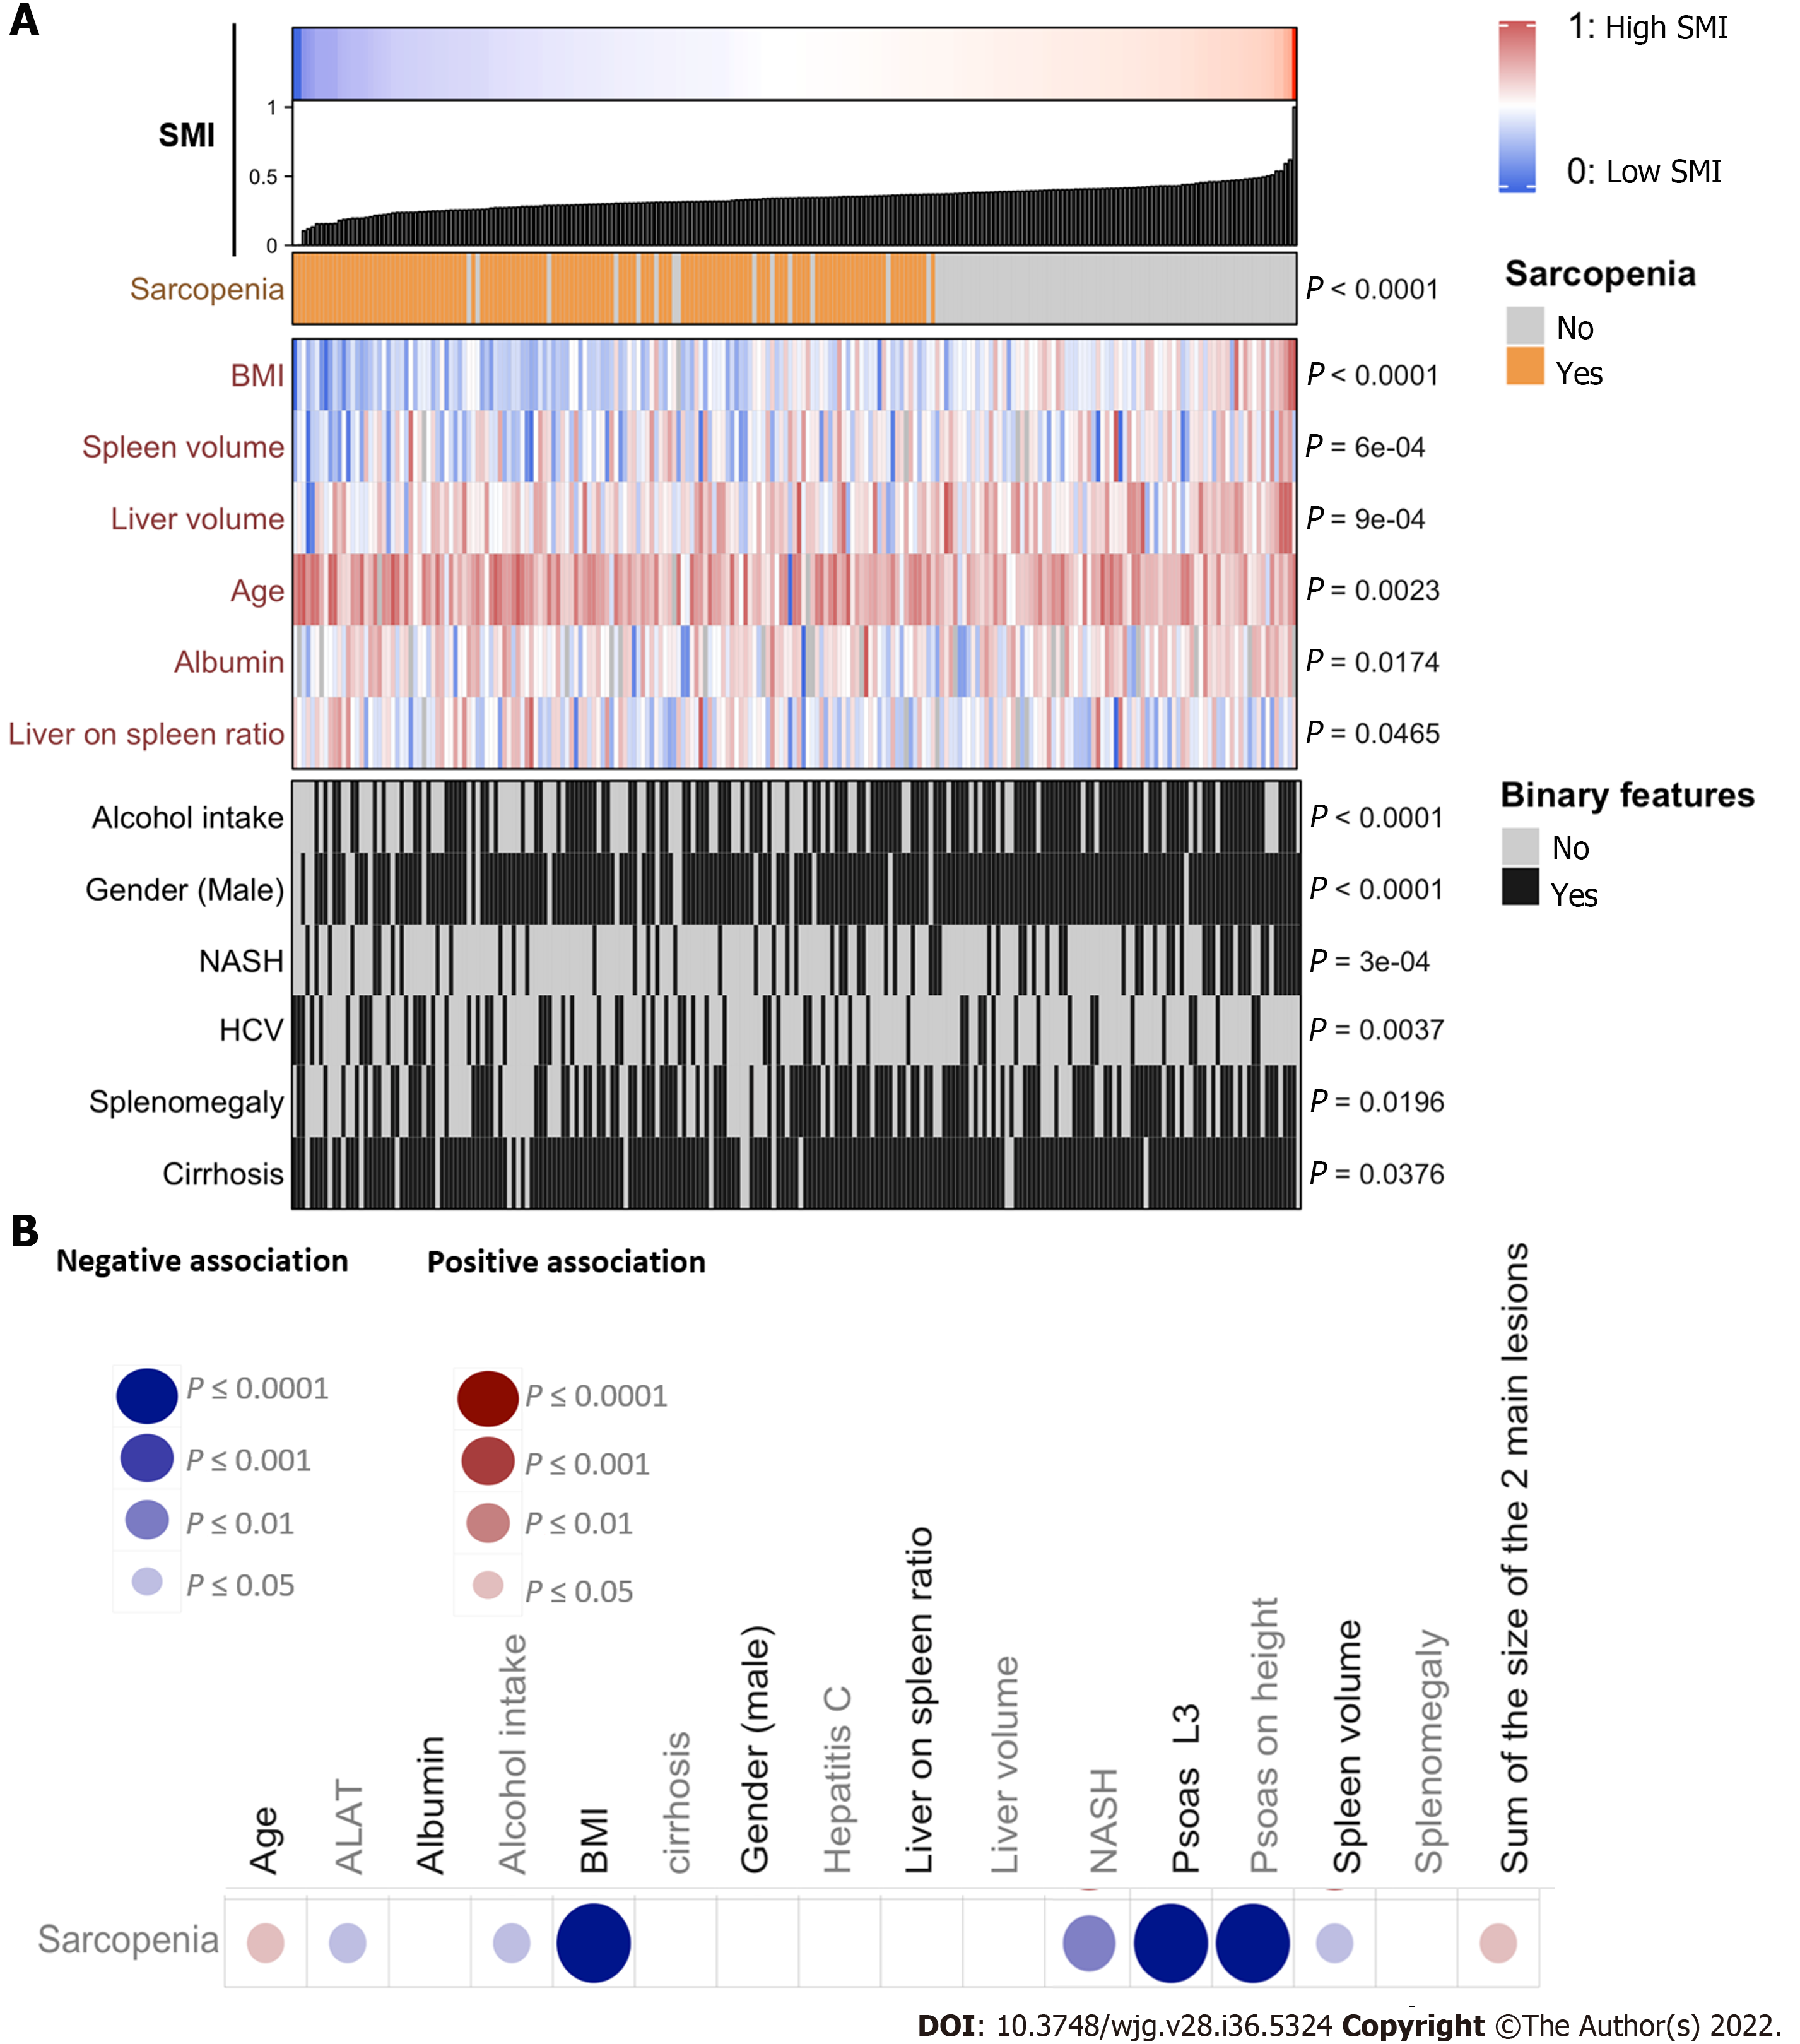
Figure 2 Correlation of biological and clinical features with sarcopenia.
A: Association of clinical, biological, and radiological features with skeletal muscle index expressed as a continuous variable; B: Association of clinical, biological, and radiological features with the presence or not of sarcopenia. Comparison of a continuous variable in two or more than two groups was performed using Wilcoxon signed-rank test or Kruskal-Wallis test, respectively. Qualitative data were compared using the Fisher’s exact test. Correlation analysis between continuous variables was performed using Spearman's rank-order correlation. All tests were two-tailed and a P-value < 0.05 was considered significant. BMI: Body mass index; HCV: Hepatitis C virus; NASH: Non-alcoholic steatohepatitis; SMI: Skeletal muscle index.
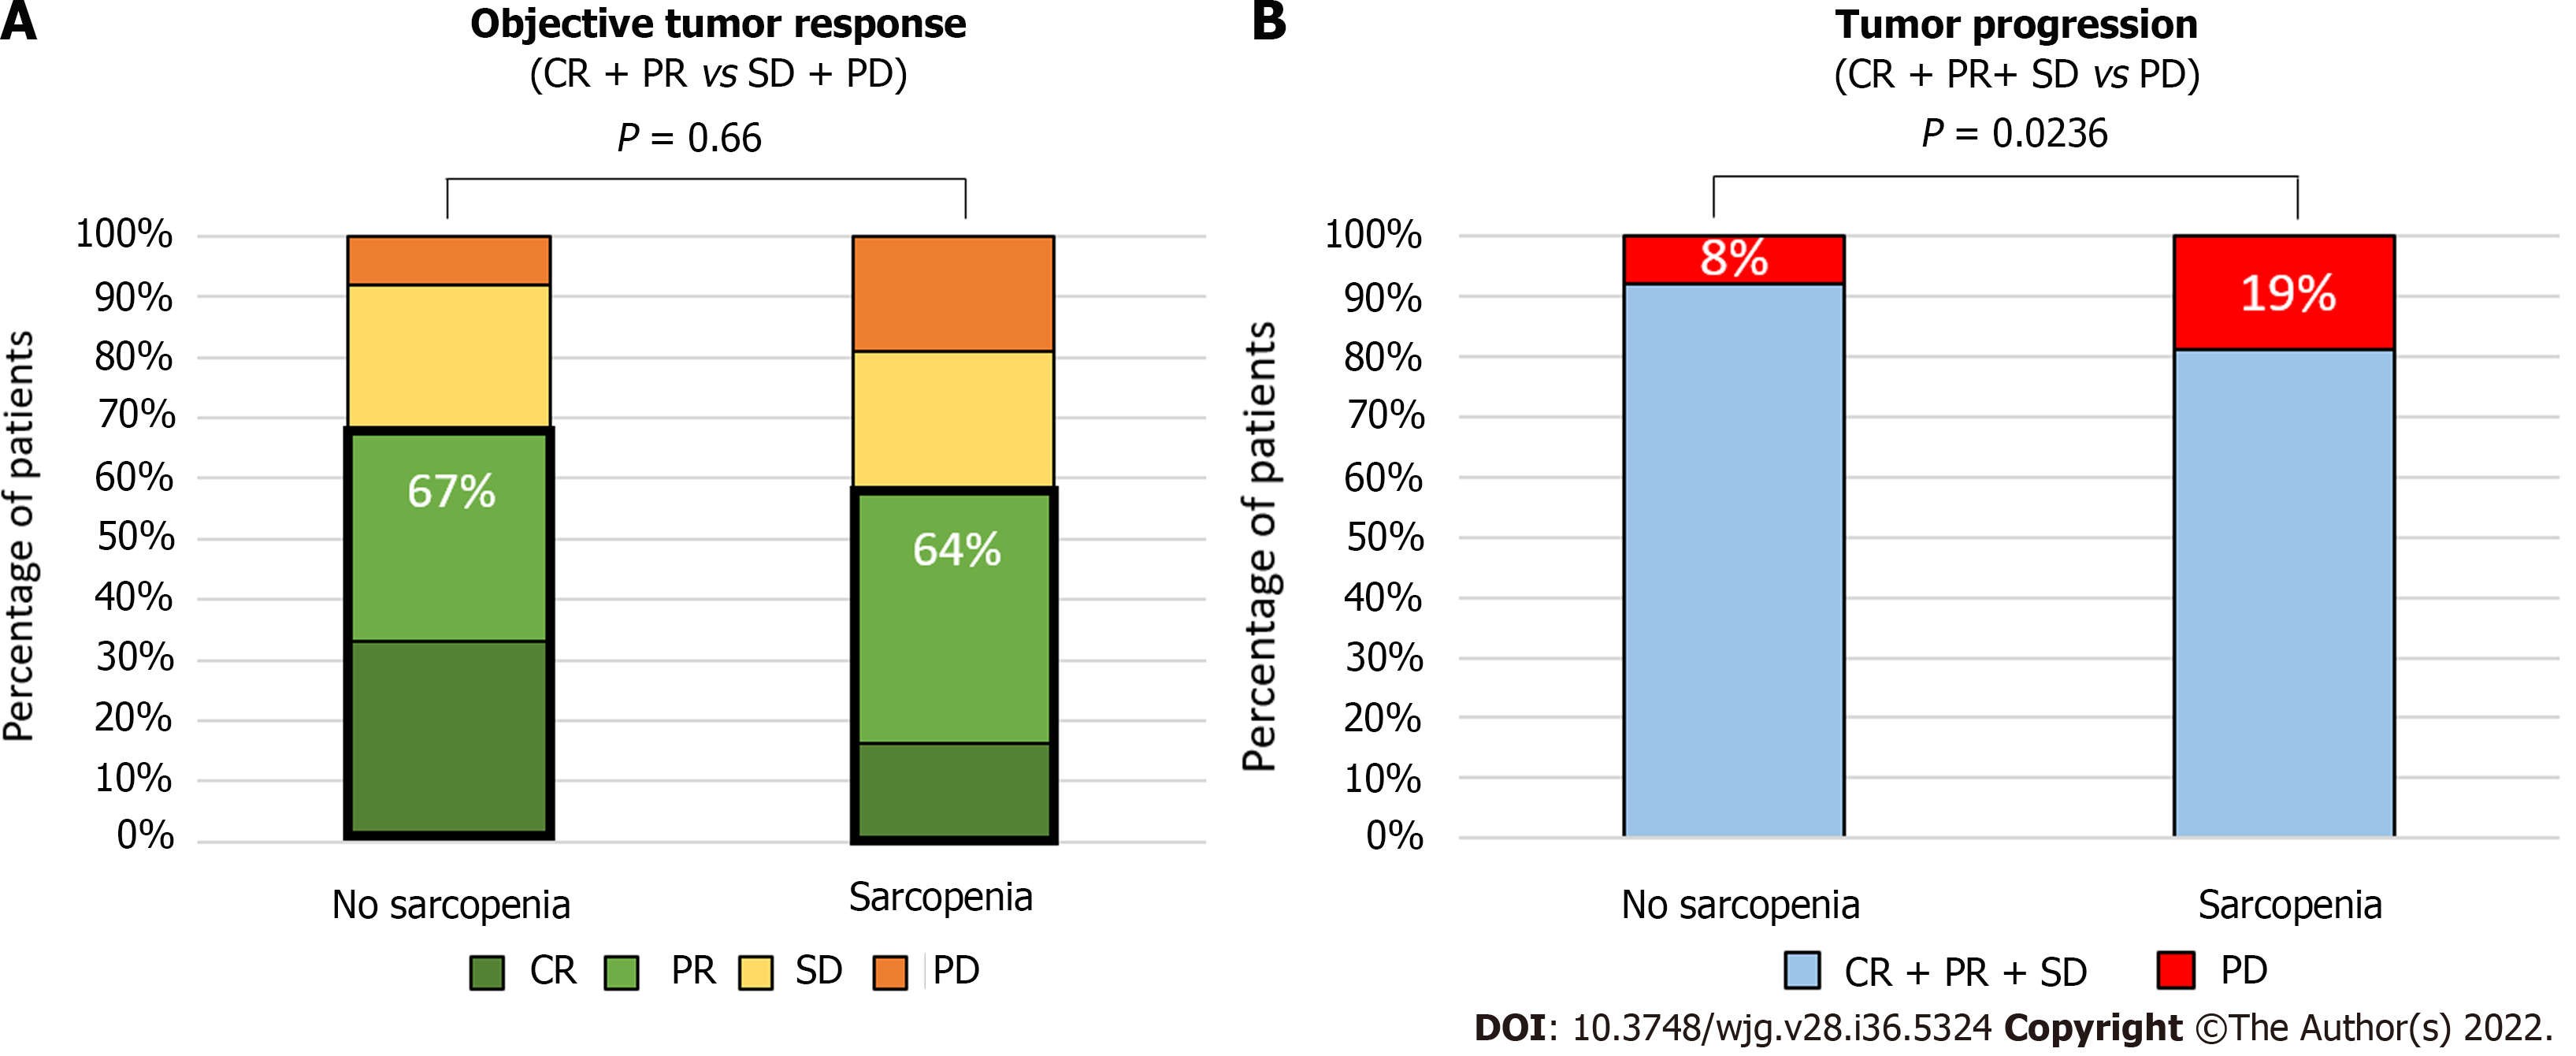
Figure 3 Radiological response according to presence of sarcopenia.
A: Complete response vs partial response vs stable disease vs progressive disease assessed using the mRECIST criteria after the first session of treatment; B: Complete and partial response and stable disease vs progressive disease assessed using the mRECIST criteria after the first session of treatment. Statistical analysis was performed using the chi square test. CR: Complete response; PR: Partial response; SD: Stable disease; PD: Progressive disease; TACE: Trans-arterial chemoembolization.
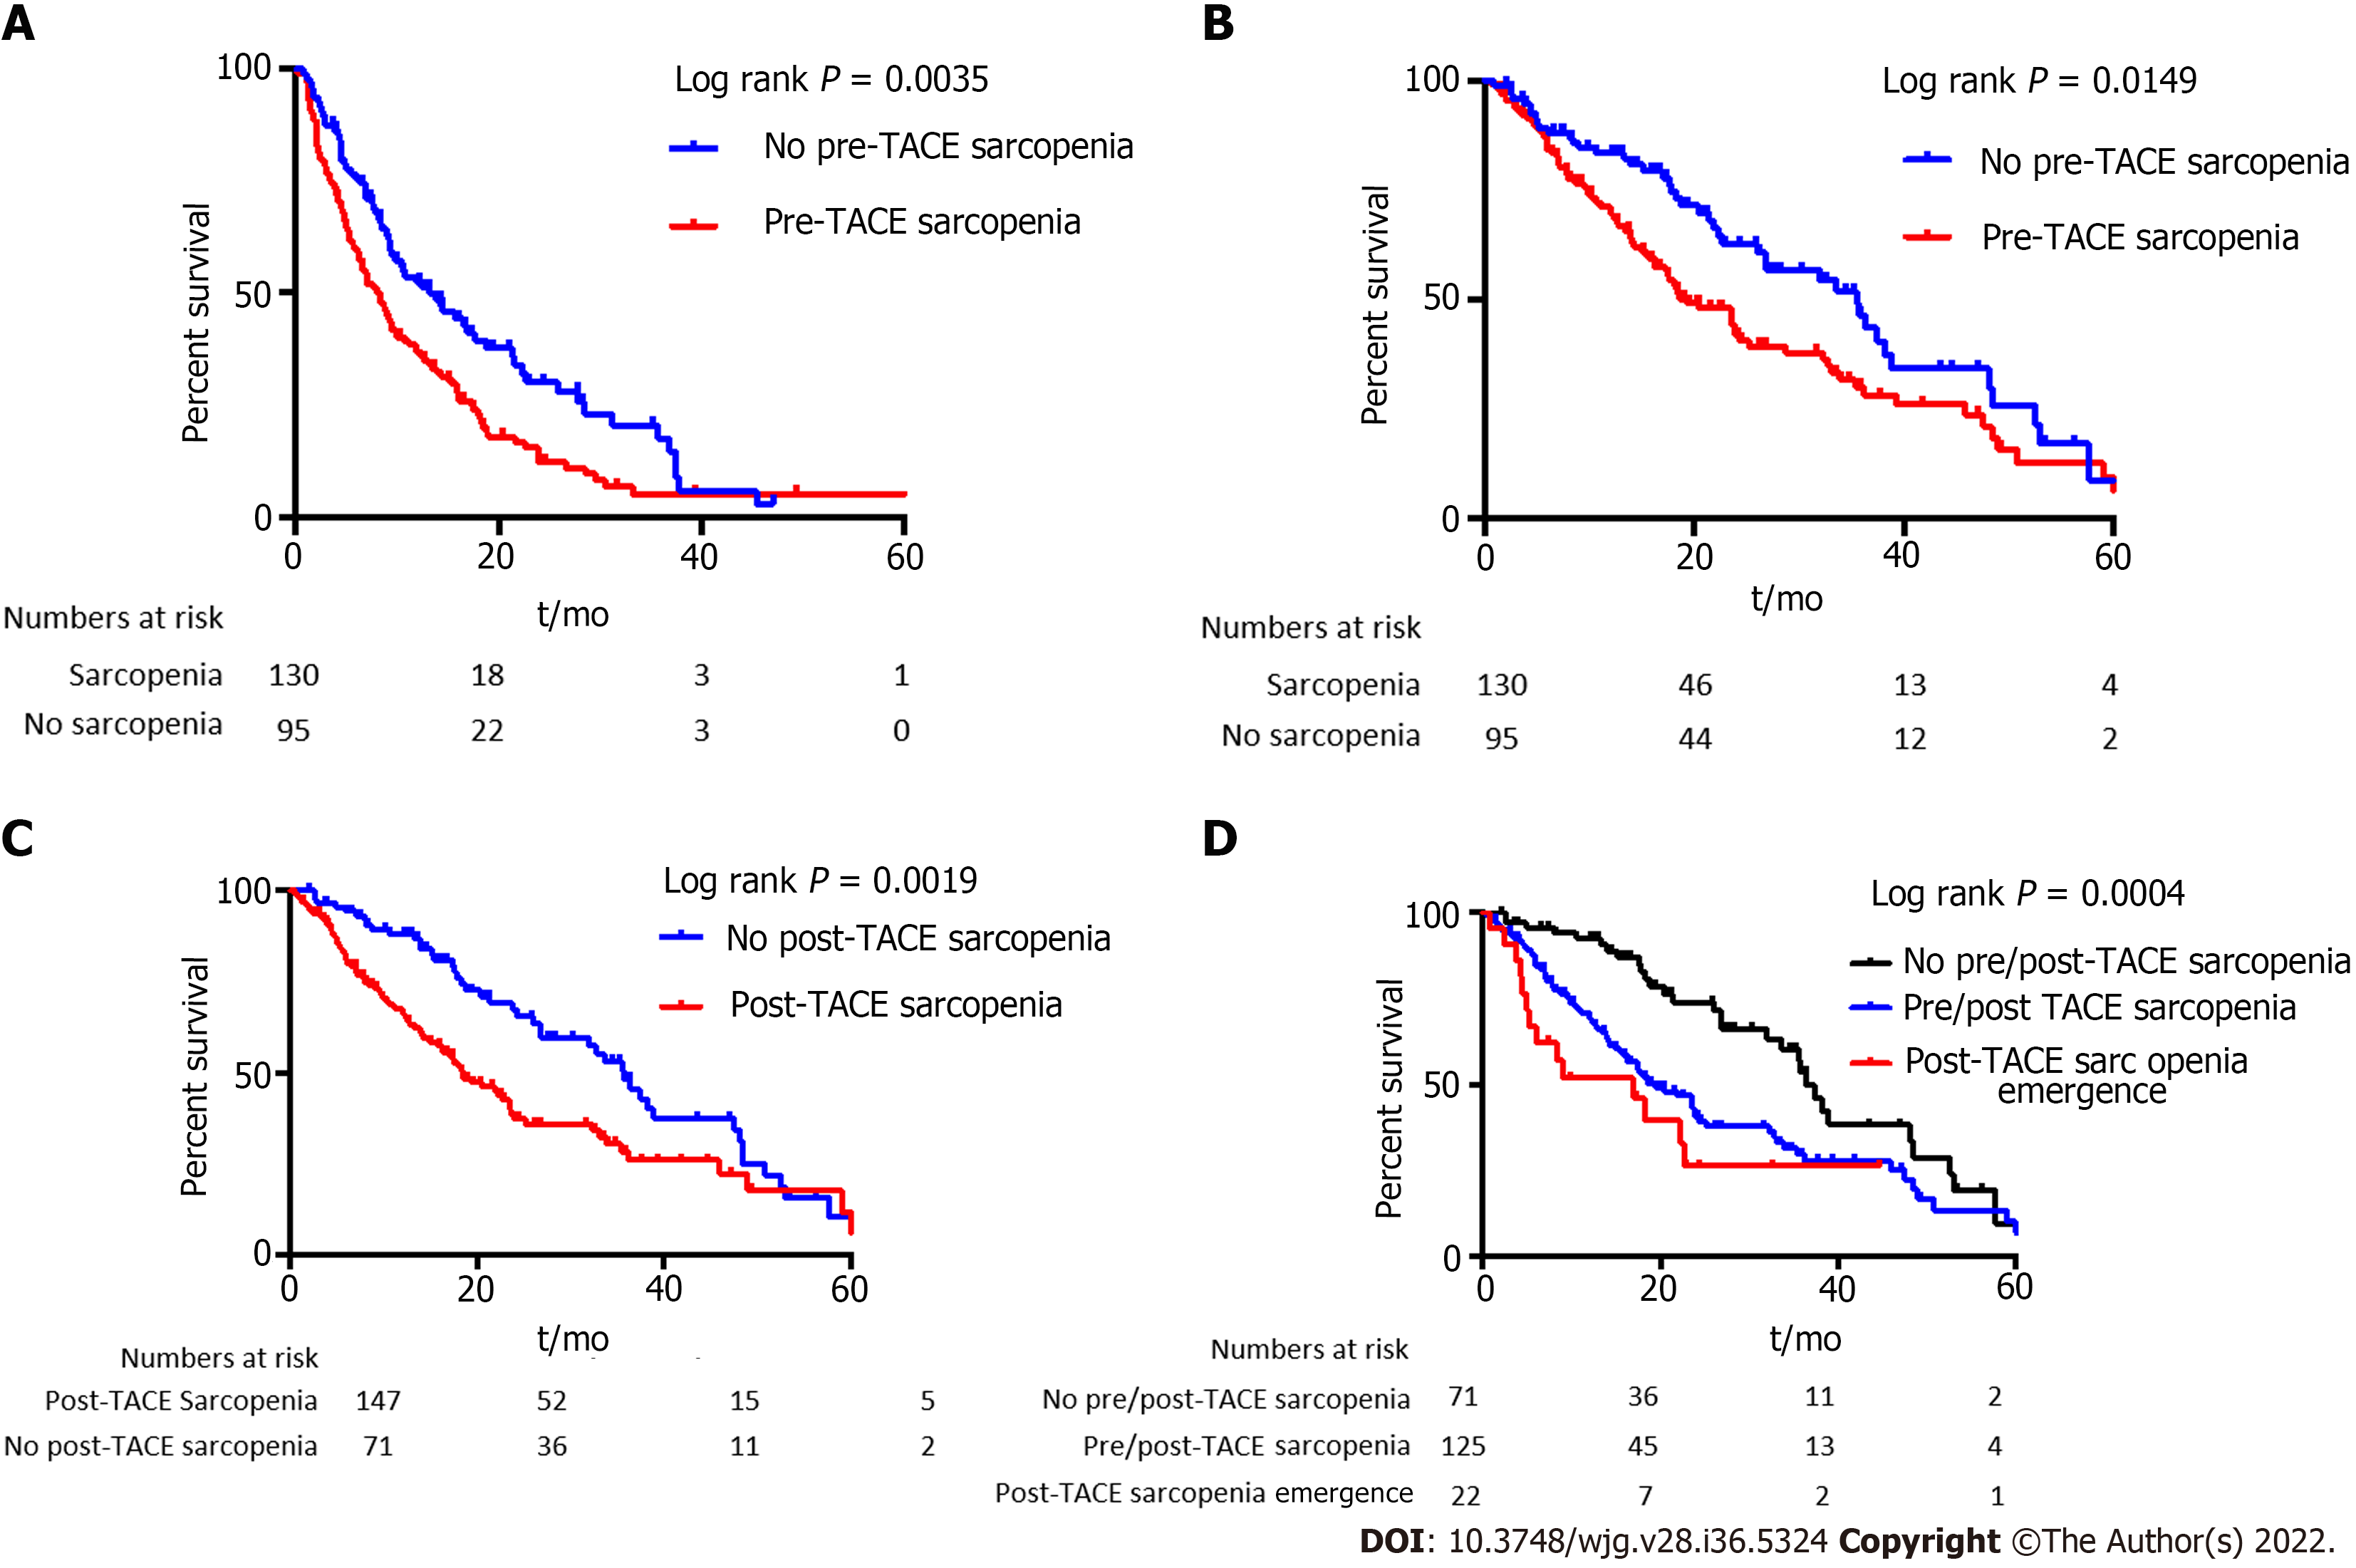
Figure 4 Survival according to presence of sarcopenia before and after trans-arterial chemoembolization.
A and B: Progression free survival (A) and overall survival (OS) (B) according to the presence or not of sarcopenia before trans-arterial chemoembolization (TACE); C: OS according to presence or not of sarcopenia after TACE; D: OS according to the presence or not of sarcopenia before TACE, and appearance of sarcopenia after TACE designated as post-TACE sarcopenia. Results were computed using the Kaplan-Meier method and compared by the log rank test. The patients at risk are represented under the x-axis.
- Citation: Roth G, Teyssier Y, Benhamou M, Abousalihac M, Caruso S, Sengel C, Seror O, Ghelfi J, Seigneurin A, Ganne-Carrie N, Gigante E, Blaise L, Sutter O, Decaens T, Nault JC. Impact of sarcopenia on tumor response and survival outcomes in patients with hepatocellular carcinoma treated by trans-arterial (chemo)-embolization. World J Gastroenterol 2022; 28(36): 5324-5337
- URL: https://www.wjgnet.com/1007-9327/full/v28/i36/5324.htm
- DOI: https://dx.doi.org/10.3748/wjg.v28.i36.5324


