Copyright
©The Author(s) 2022.
World J Gastroenterol. Sep 21, 2022; 28(35): 5203-5216
Published online Sep 21, 2022. doi: 10.3748/wjg.v28.i35.5203
Published online Sep 21, 2022. doi: 10.3748/wjg.v28.i35.5203
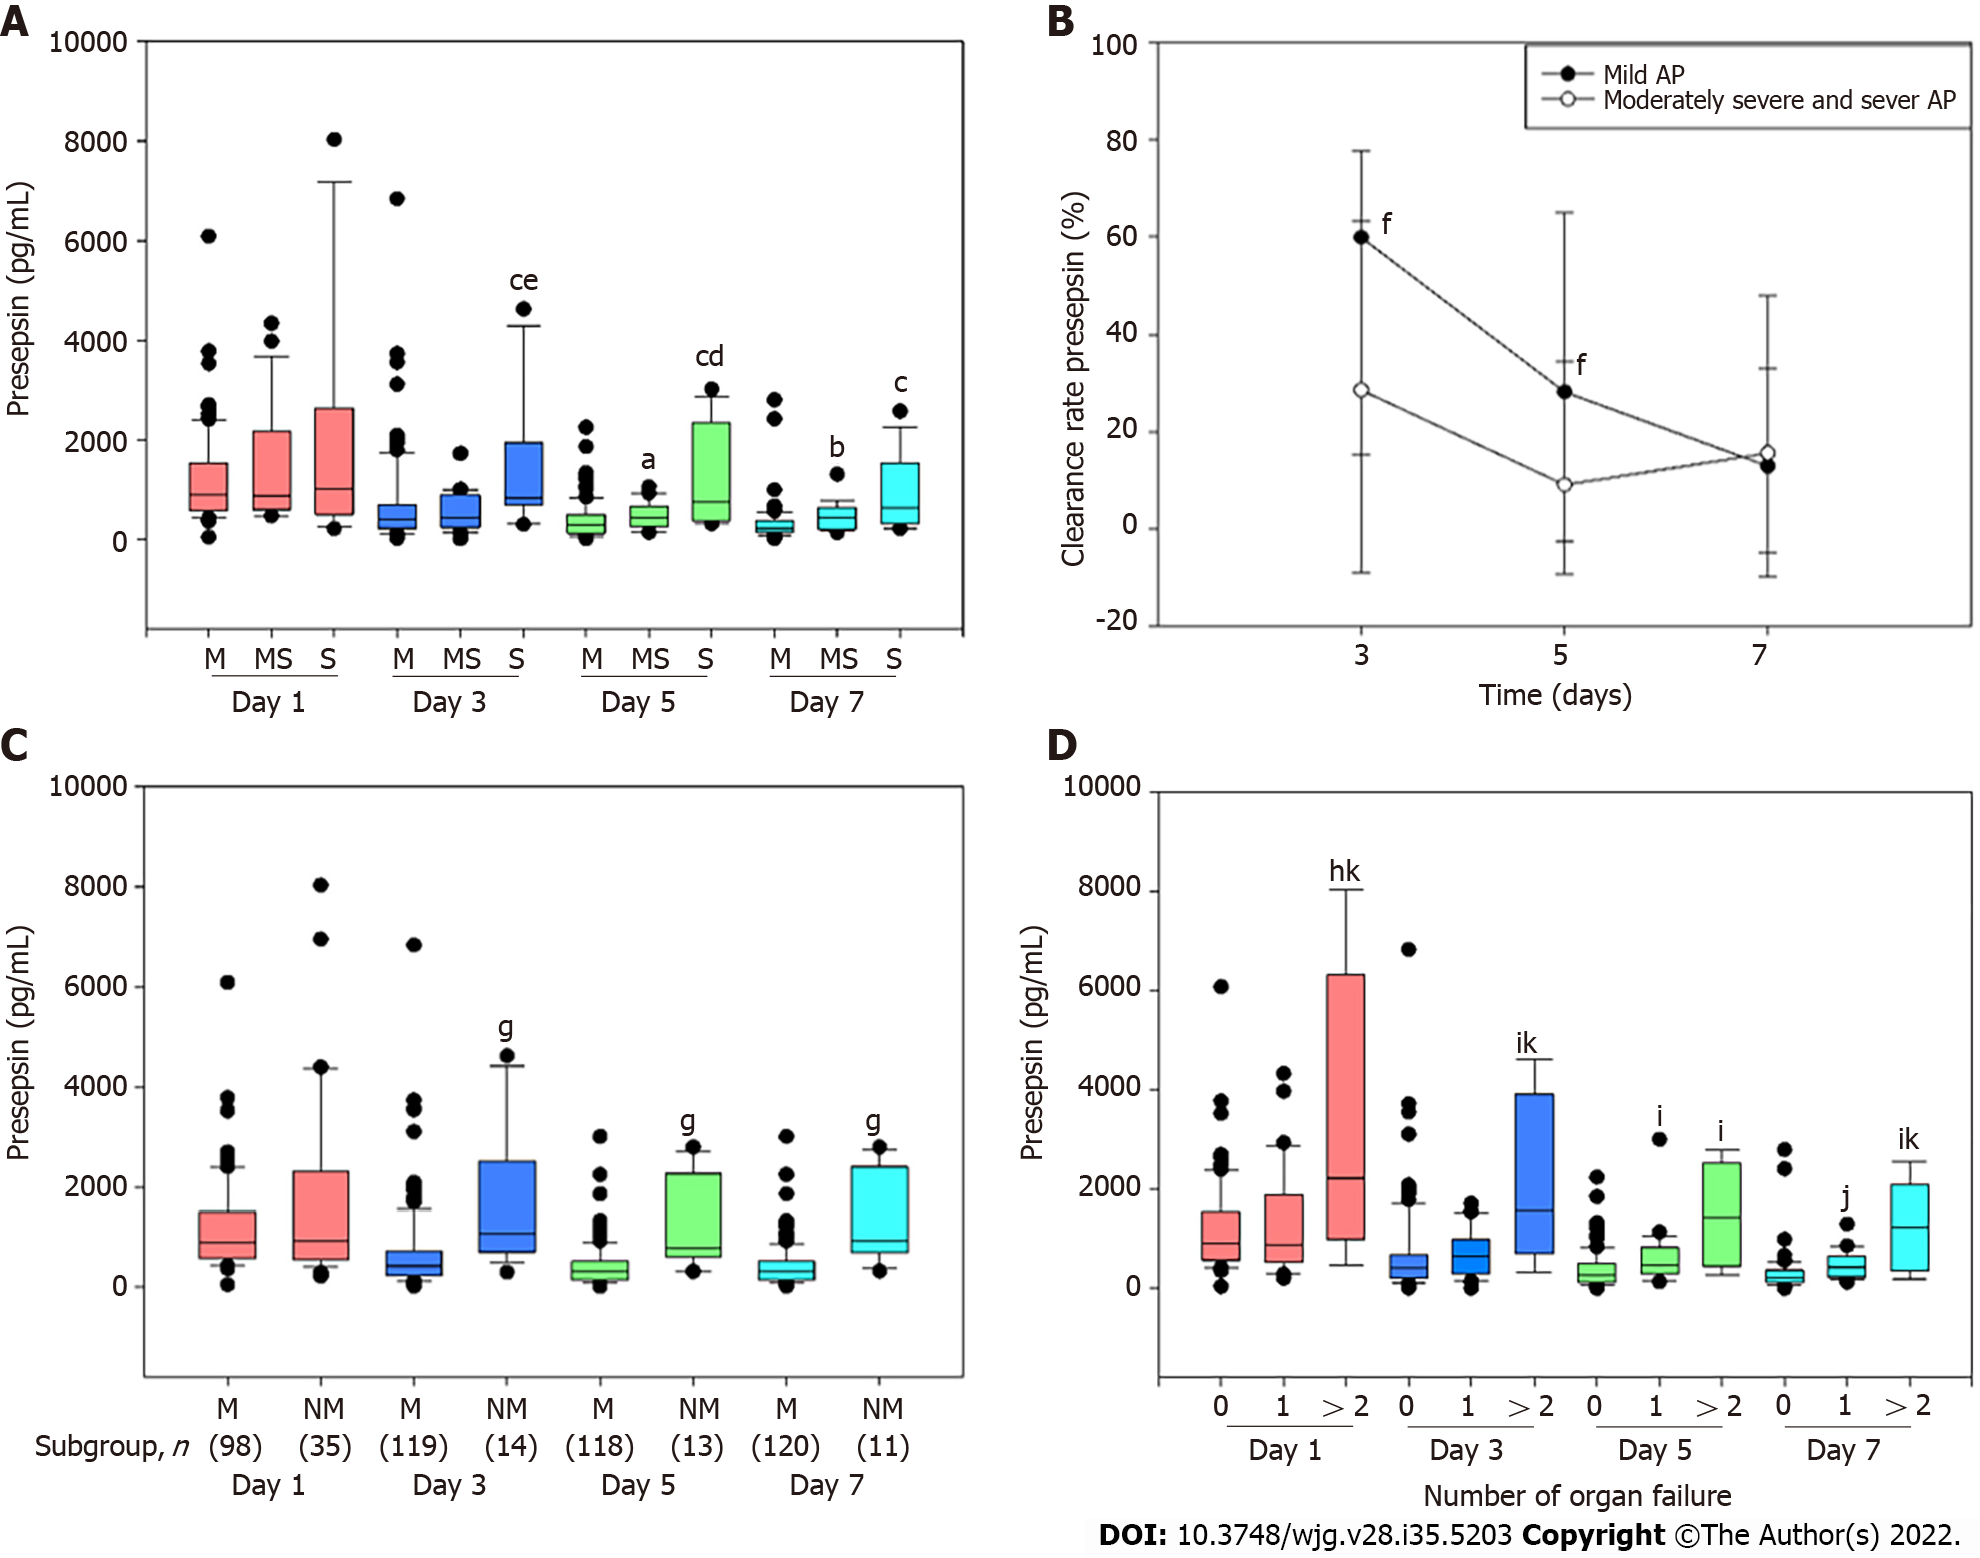
Figure 1 Association between dynamic blood presepsin levels and severity of acute pancreatitis.
A: Presepsin levels on days 1, 3, 5 and 7 after admission in mild (M), moderately severe (MS) and severe (S) acute pancreatitis (AP). aP < 0.05 vs M AP; bP < 0.01 vs M AP; cP < 0.001 vs M AP; dP < 0.05 vs MS AP; eP < 0.01 vs MS AP; B: Clearance rate of presepsin in patients with M and non-mild (NM) (MS and S) AP; fP < 0.05 vs MS and S AP; C: Time-specific concentrations of presepsin in patients with M and NM AP; gP < 0.001 vs M AP; D: Correlation between presepsin and organ failure in patients with AP. hP < 0.05 vs no organ failure; iP < 0.01 vs no organ failure; jP < 0.001 vs no organ failure; kP < 0.05 vs 1 organ failure. Lines denote median values, boxes represent 25th to 75th percentiles, and whiskers indicate the range.
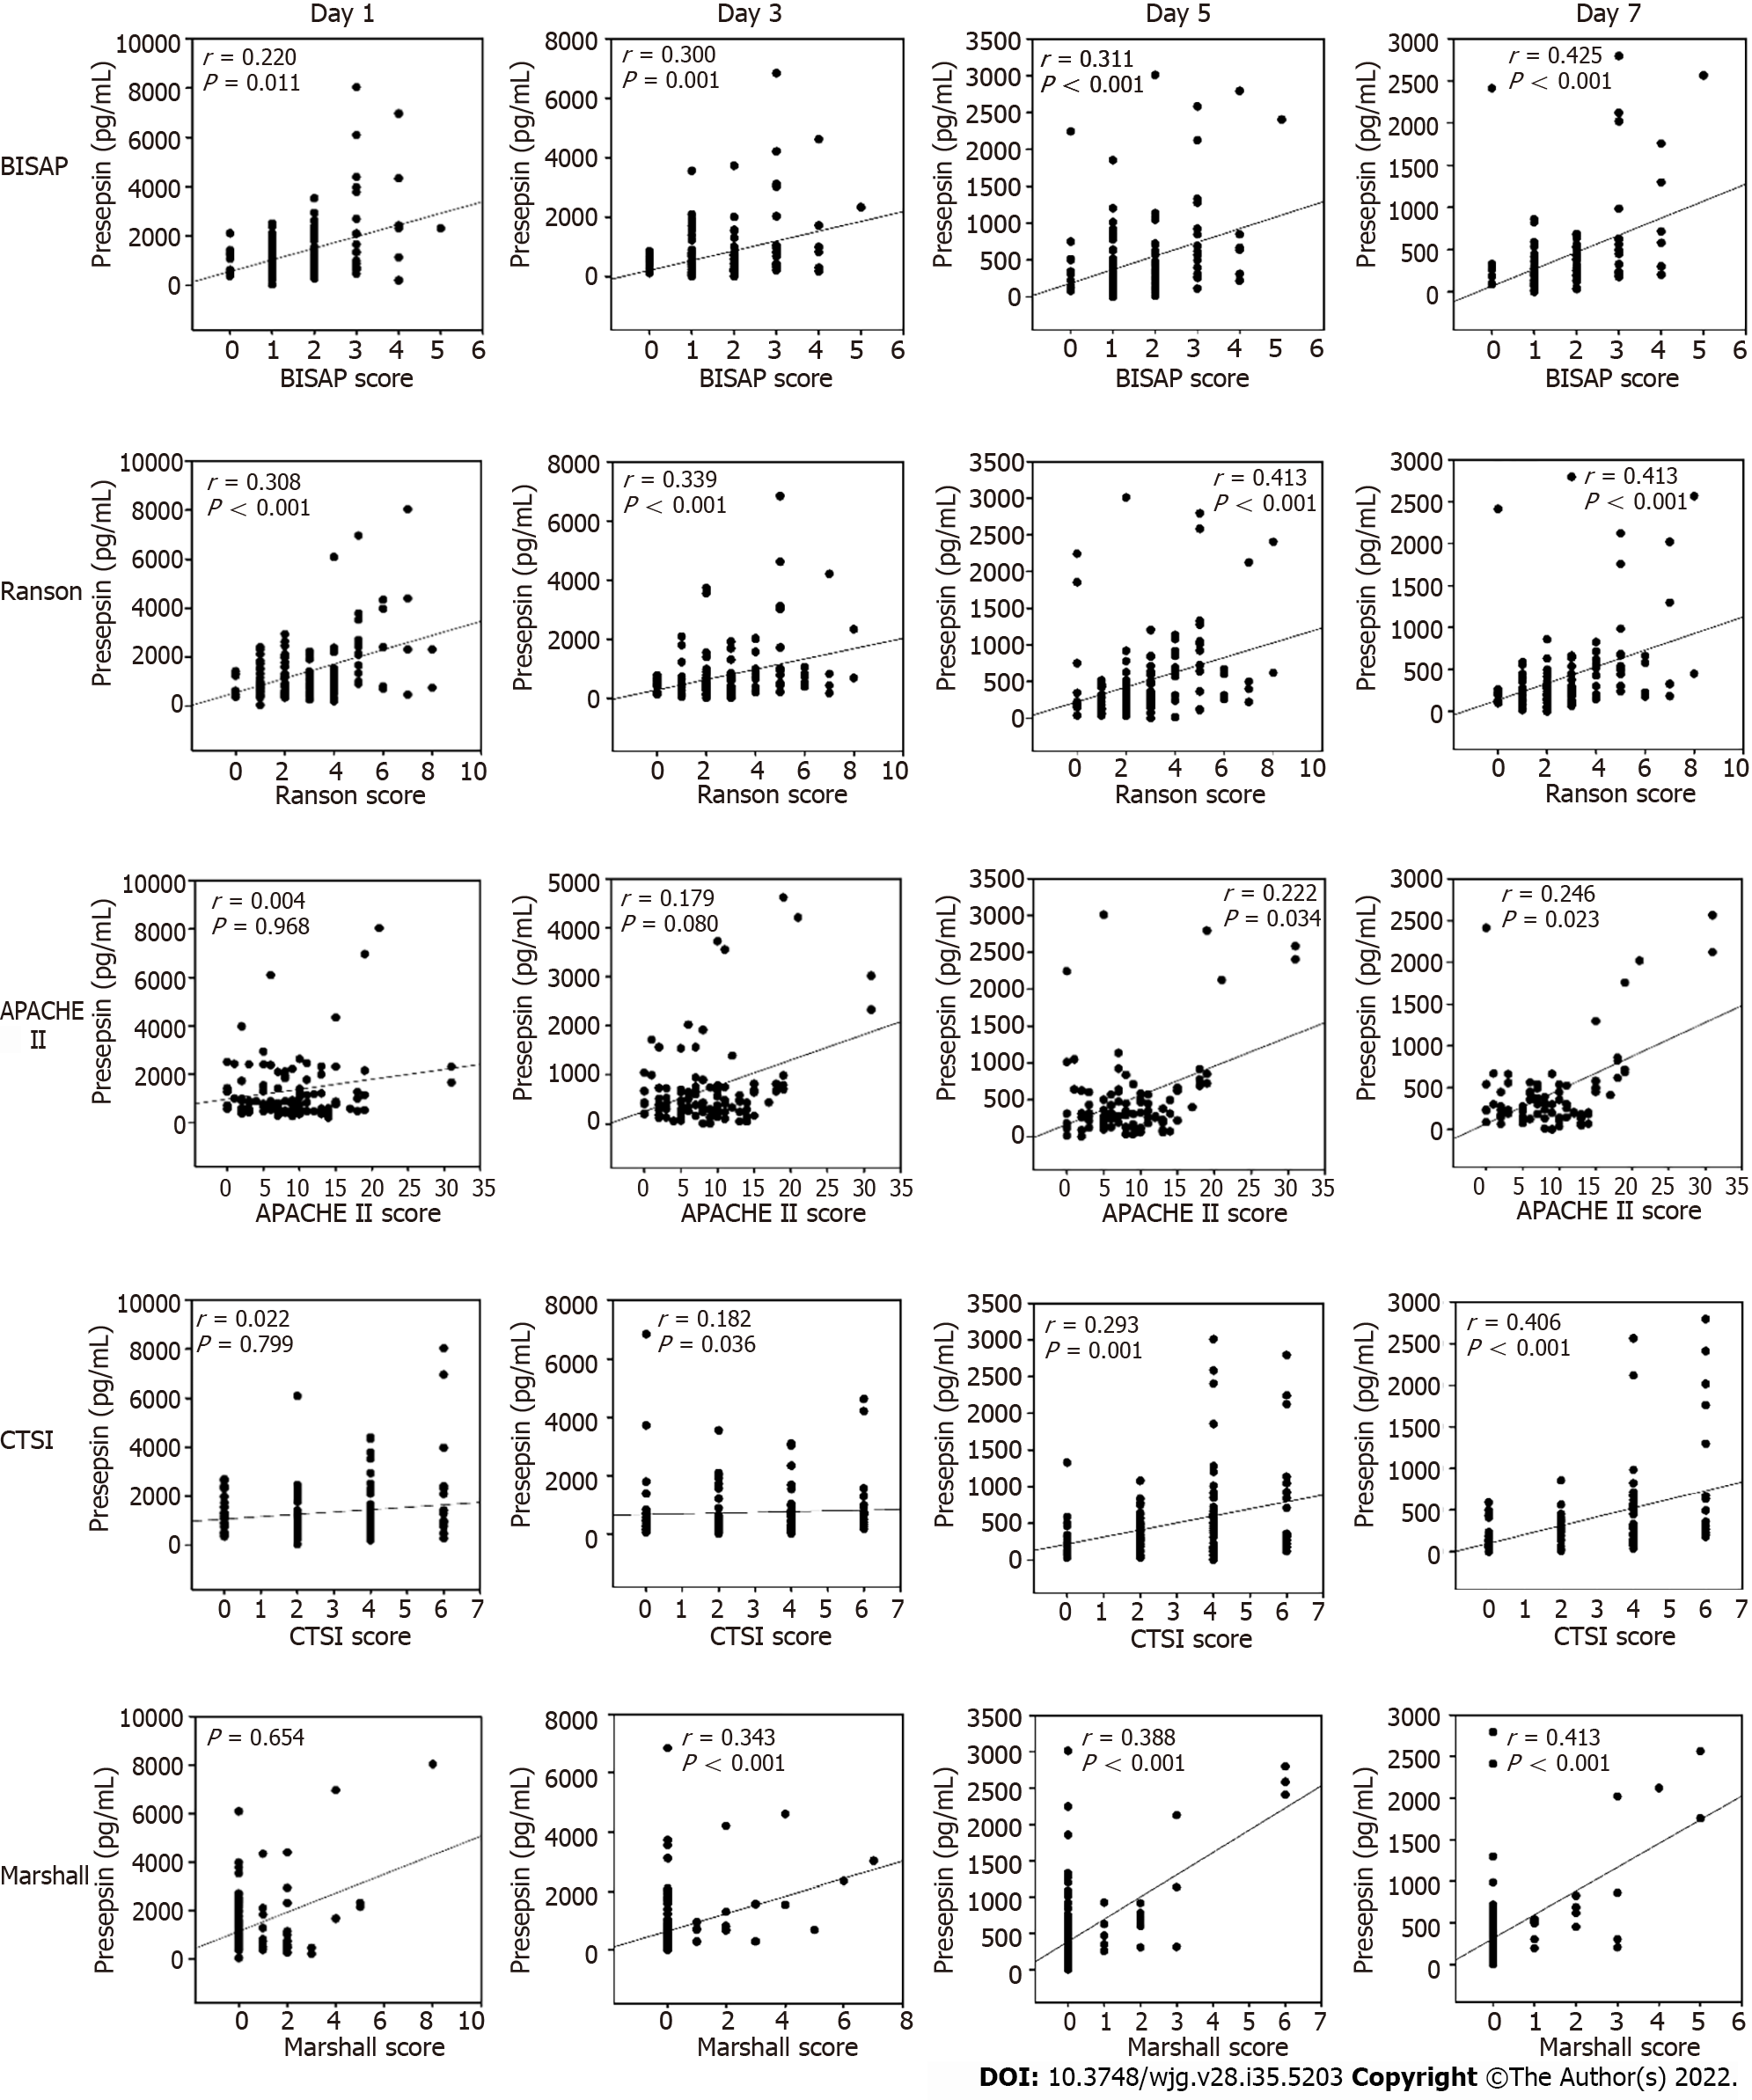
Figure 2 Correlation between presepsin and bedside index of severity in acute pancreatitis, Ranson, acute physiology and chronic health evaluation-II, computed tomography severity index and Marshall scores.
BISAP: Bedside index of severity in acute pancreatitis; APACHE: Acute physiology and chronic health evaluation; CTSI: Computed tomography severity index.
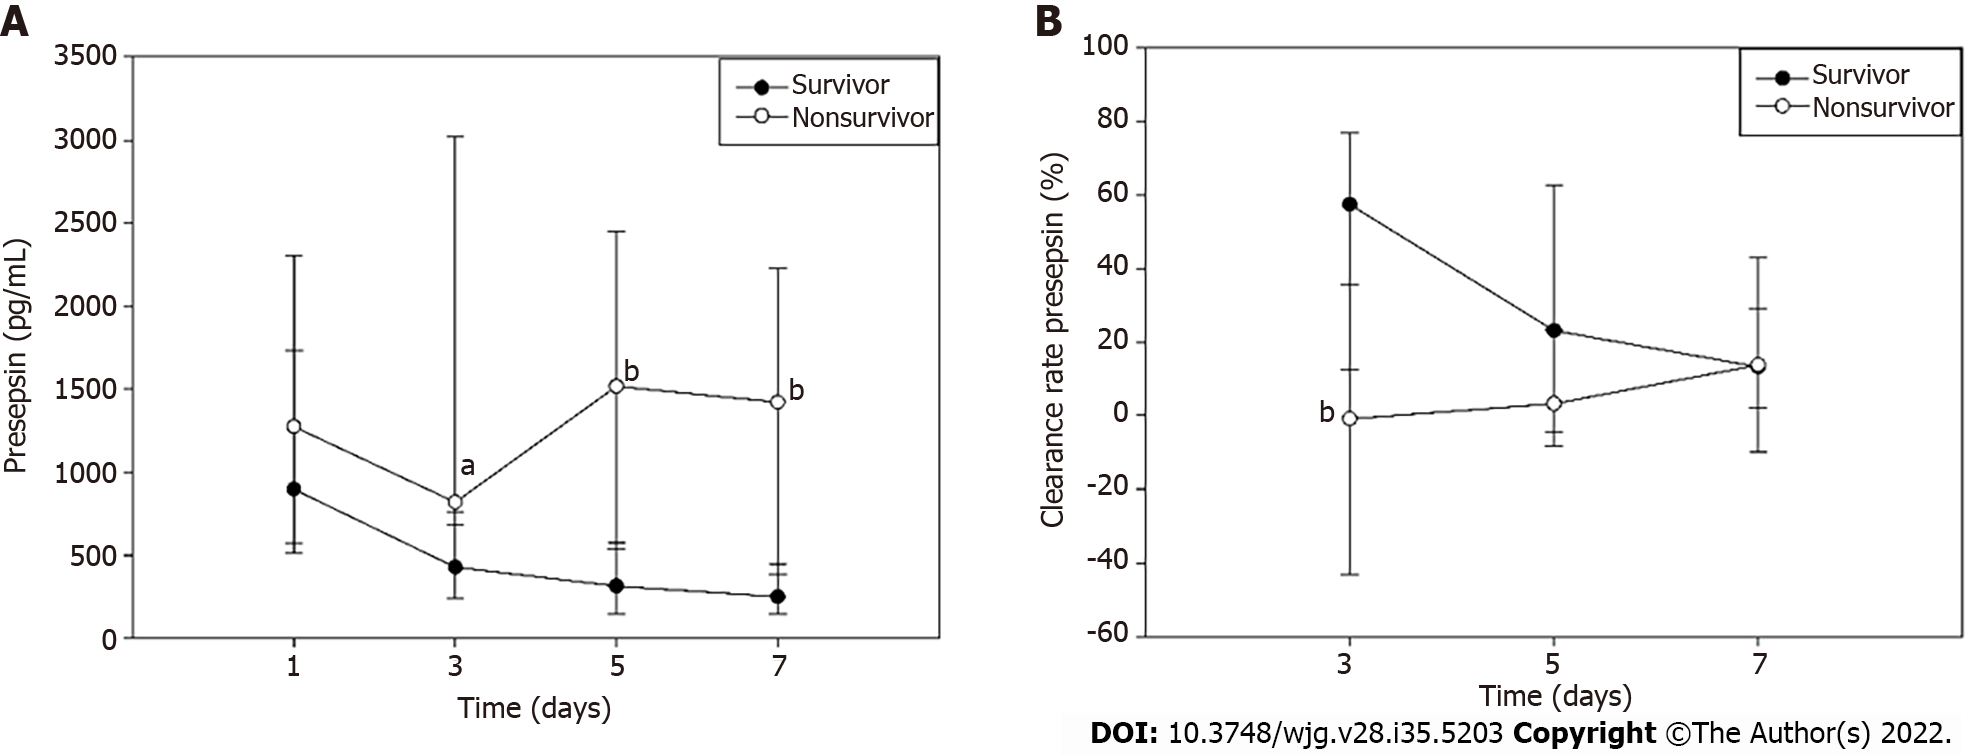
Figure 3 Dynamic changes in presepsin concentration and clearance rate in survivors and non-survivors.
A: Presepsin concentration; B: Clearance rate. aP < 0.05 vs survivors; bP < 0.01 vs survivors.
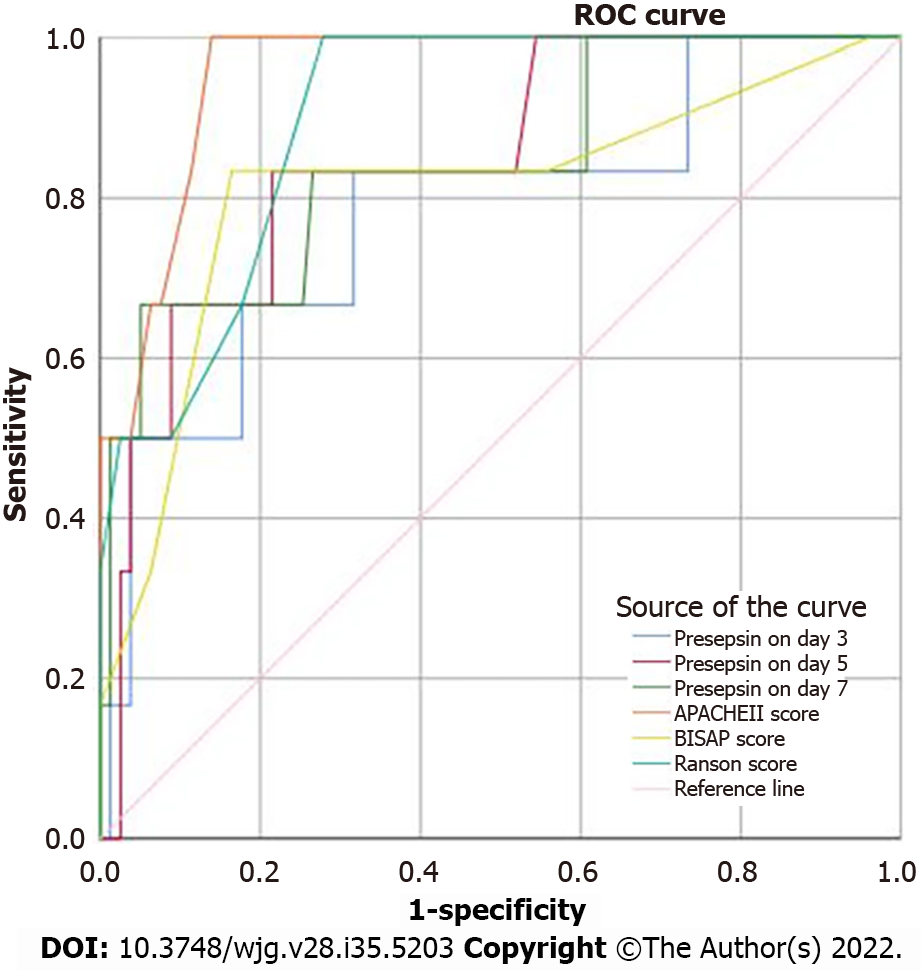
Figure 4 Receiver operating characteristic curves of presepsin, acute physiology and chronic health evaluation-II, index of severity in acute pancreatitis and Ranson scores for 28-d mortality of patients with acute pancreatitis.
ROC: Receiver operating characteristic; APACHE: Acute physiology and chronic health evaluation; BISAP: Bedside index of severity in acute pancreatitis.
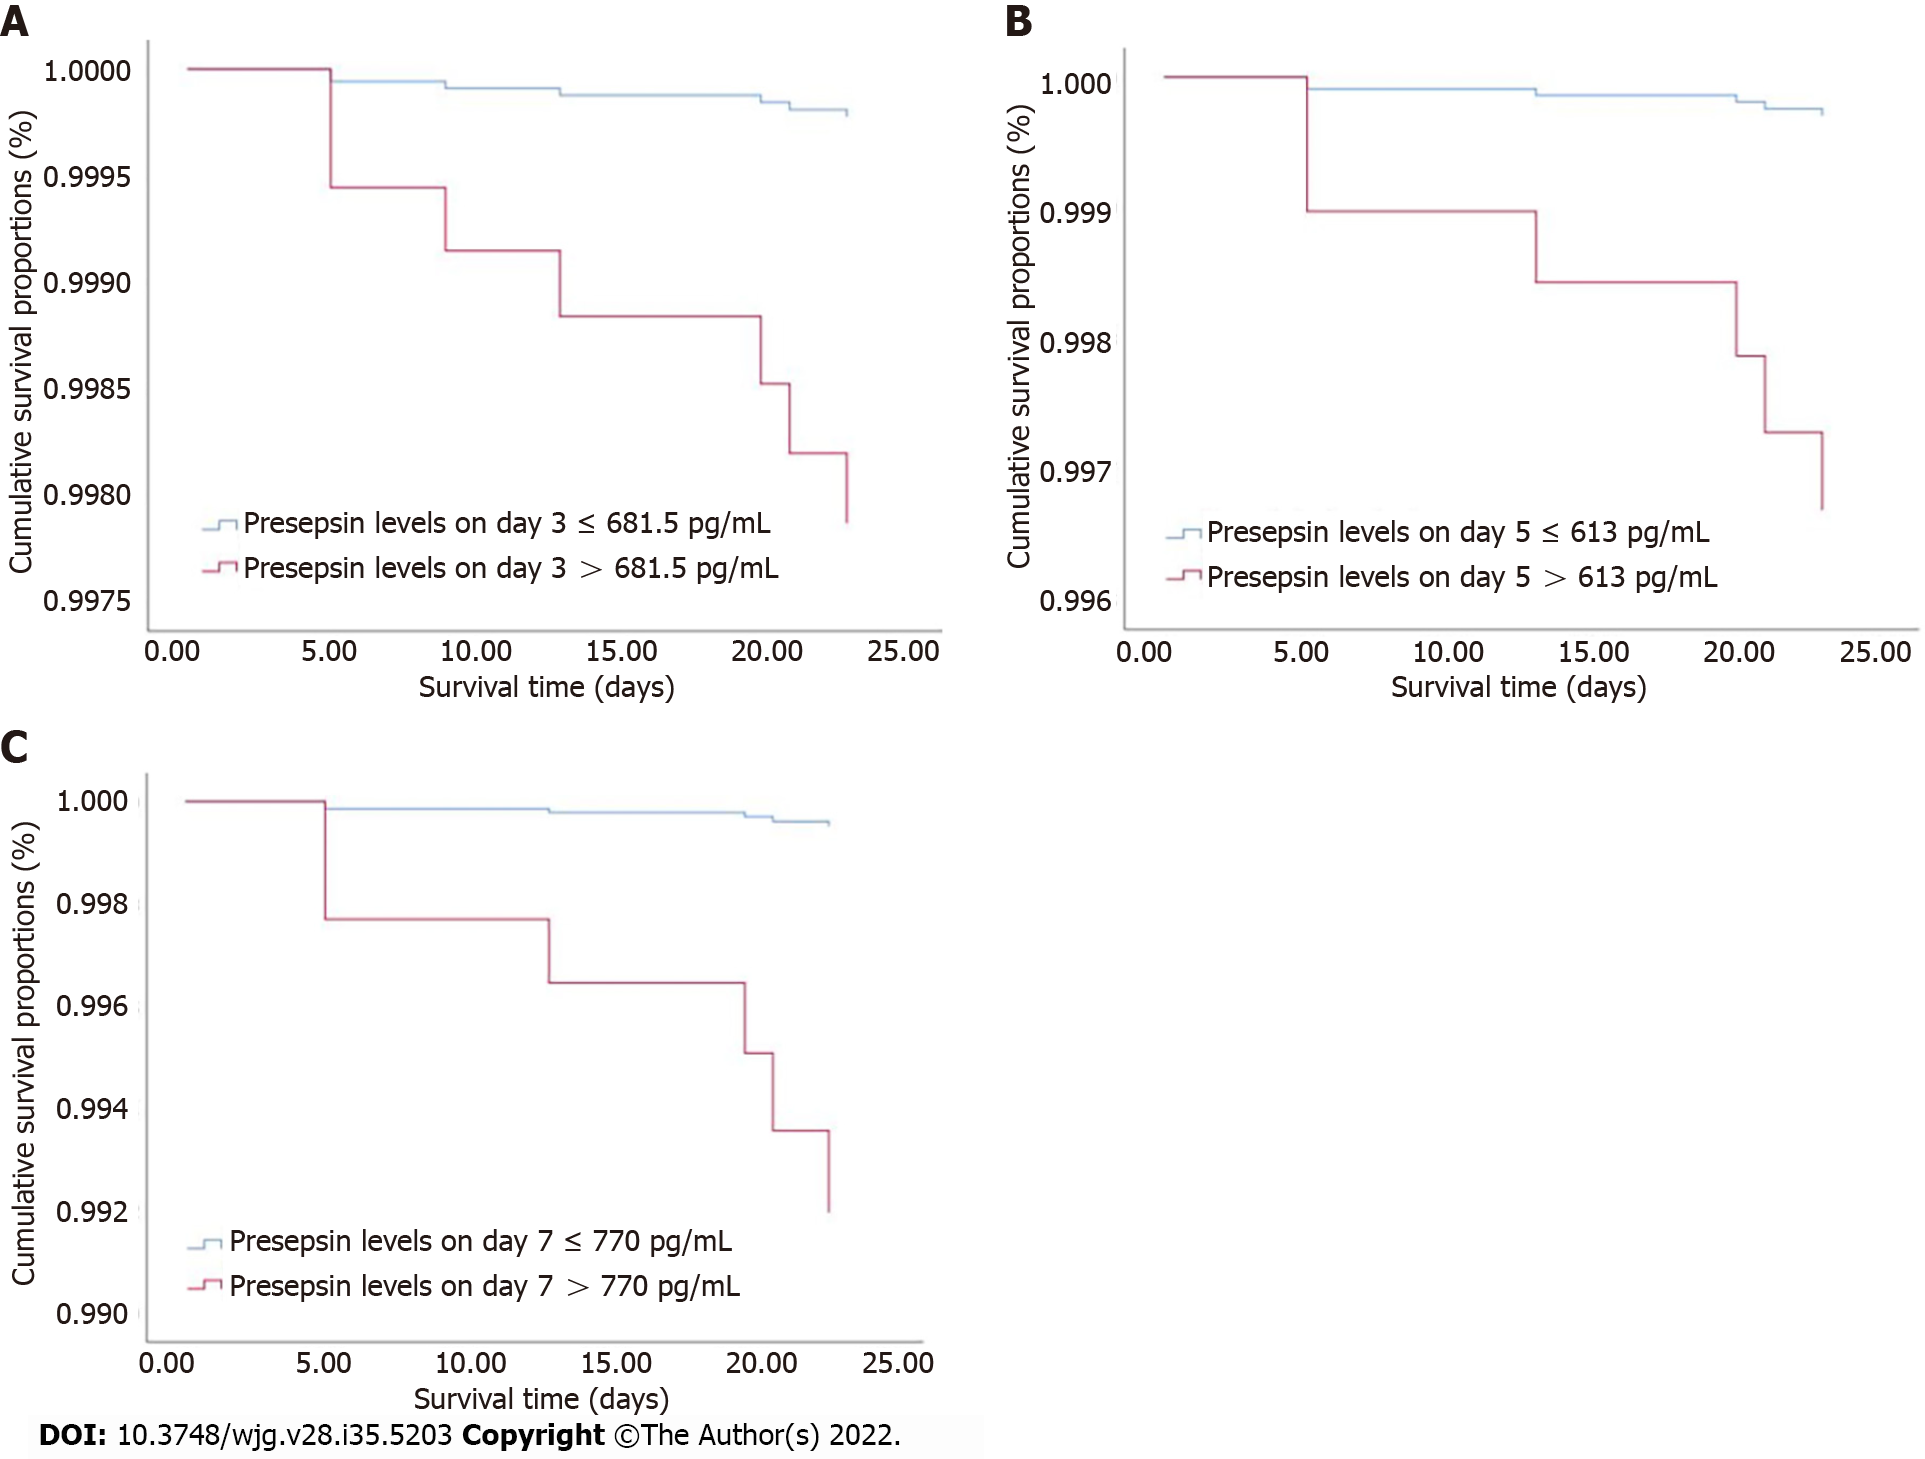
Figure 5 Cox regression survival curves.
A: Acute pancreatitis (AP) patients with presepsin levels higher than 681.5 pg/mL on day 3 had a lower probability of survival at 28 d compared to patients with lower levels; B and C: Similarly, AP patients with presepsin levels on day 5 (B) and day 7 (C) higher than 613 pg/mL and 770 pg/mL, respectively, had a lower probability of survival at 28 d than patients with lower levels. AP: acute pancreatitis.
- Citation: Xiao HL, Wang GX, Wang Y, Tan ZM, Zhou J, Yu H, Xie MR, Li CS. Dynamic blood presepsin levels are associated with severity and outcome of acute pancreatitis: A prospective cohort study. World J Gastroenterol 2022; 28(35): 5203-5216
- URL: https://www.wjgnet.com/1007-9327/full/v28/i35/5203.htm
- DOI: https://dx.doi.org/10.3748/wjg.v28.i35.5203


