Copyright
©The Author(s) 2022.
World J Gastroenterol. Sep 14, 2022; 28(34): 5007-5022
Published online Sep 14, 2022. doi: 10.3748/wjg.v28.i34.5007
Published online Sep 14, 2022. doi: 10.3748/wjg.v28.i34.5007
Figure 1 Results of the constipation-related index.
A: Particle counts of stool; B: Intestinal propulsive rate; C: The expression levels of colonic acetylcholine. ACH: Acetylcholine; HC: Healthy control; STC: Slow transit constipation; JCD: Ji-Chuan decoction; JCDL: Low-dose Ji-Chuan decoction treatment; JCDM: Middle-dose Ji-Chuan decoction treatment; JCDH: High-dose Ji-Chuan decoction treatment; MSP: Mosapride treatment. Compared with the healthy control group: aP < 0.05, bP < 0.01. Compared with the slow transit constipation group: cP < 0.05, dP < 0.01.
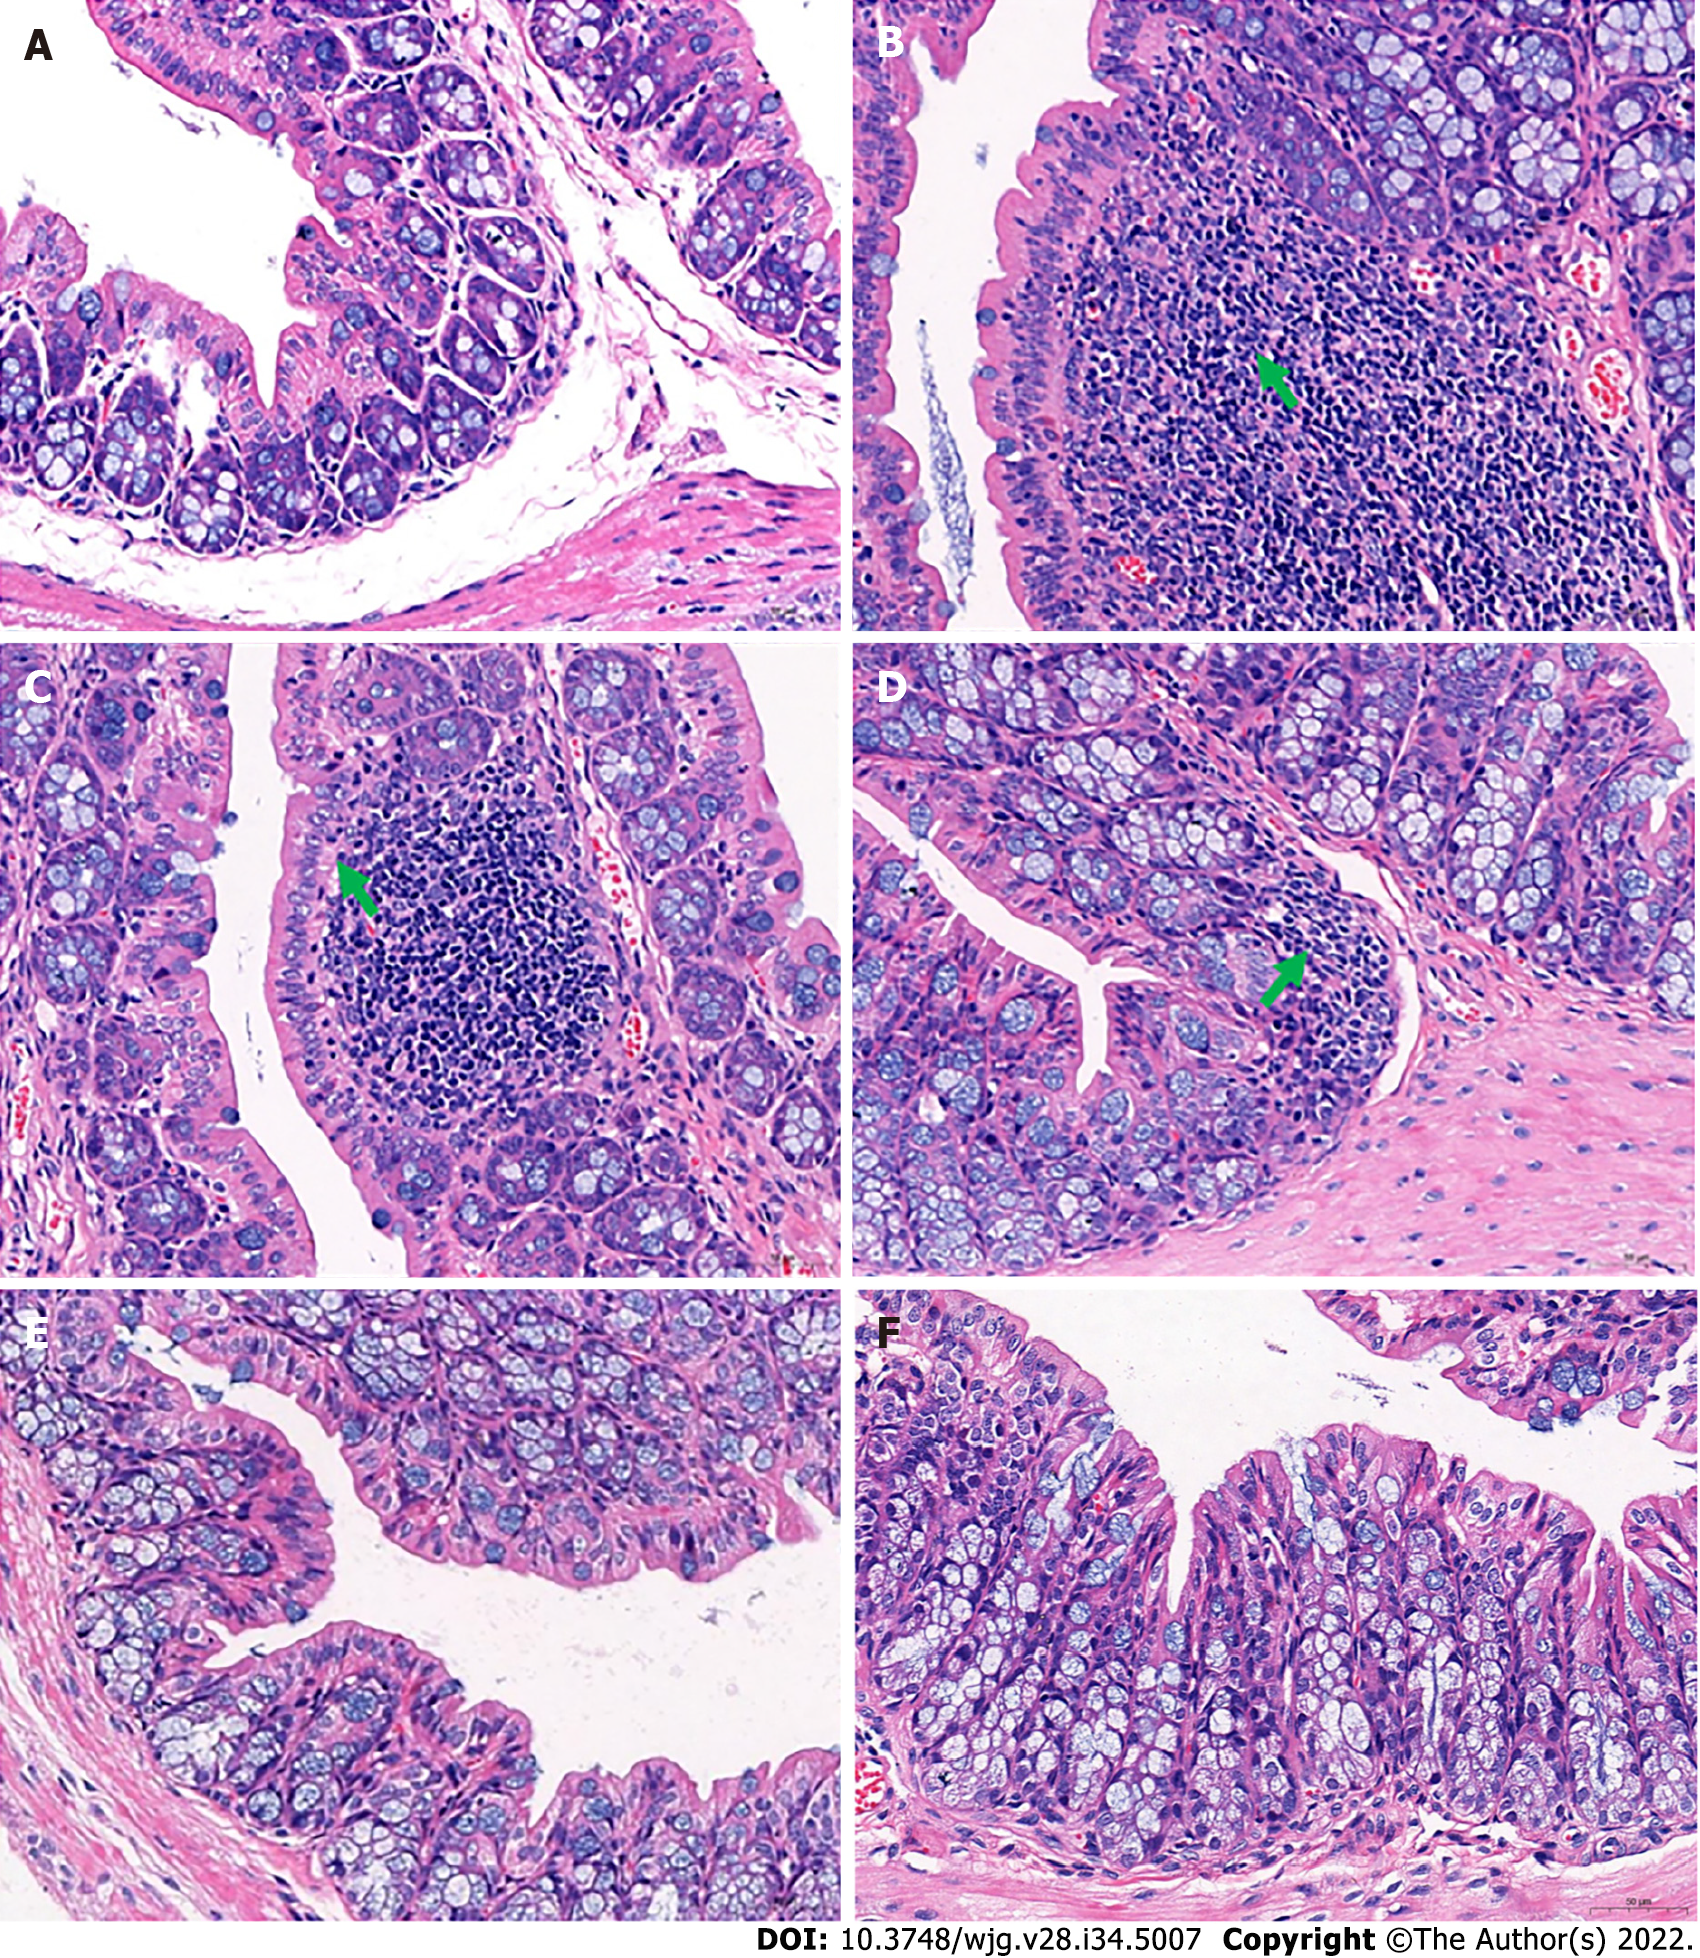
Figure 2 Histological changes in the distal colon.
A: Distal colon of the healthy control group; B: In the distal colons of mice in the slow transit constipation group, more severe inflammatory infiltration was observed; C: In the distal colons of mice in the low-dose Ji-Chuan decoction (JCD) treatment group, more severe inflammatory infiltration was observed; D: In the distal colon of mice in the middle-dose JCD group, there was reduced inflammation; E: High-dose JCD treatment restored the normal tissue morphology of the distal colon of constipated mice; F: Mosapride treatment restored the normal tissue morphology of the distal colon of constipated mice. Sections were observed at 400 × using a light microscope.
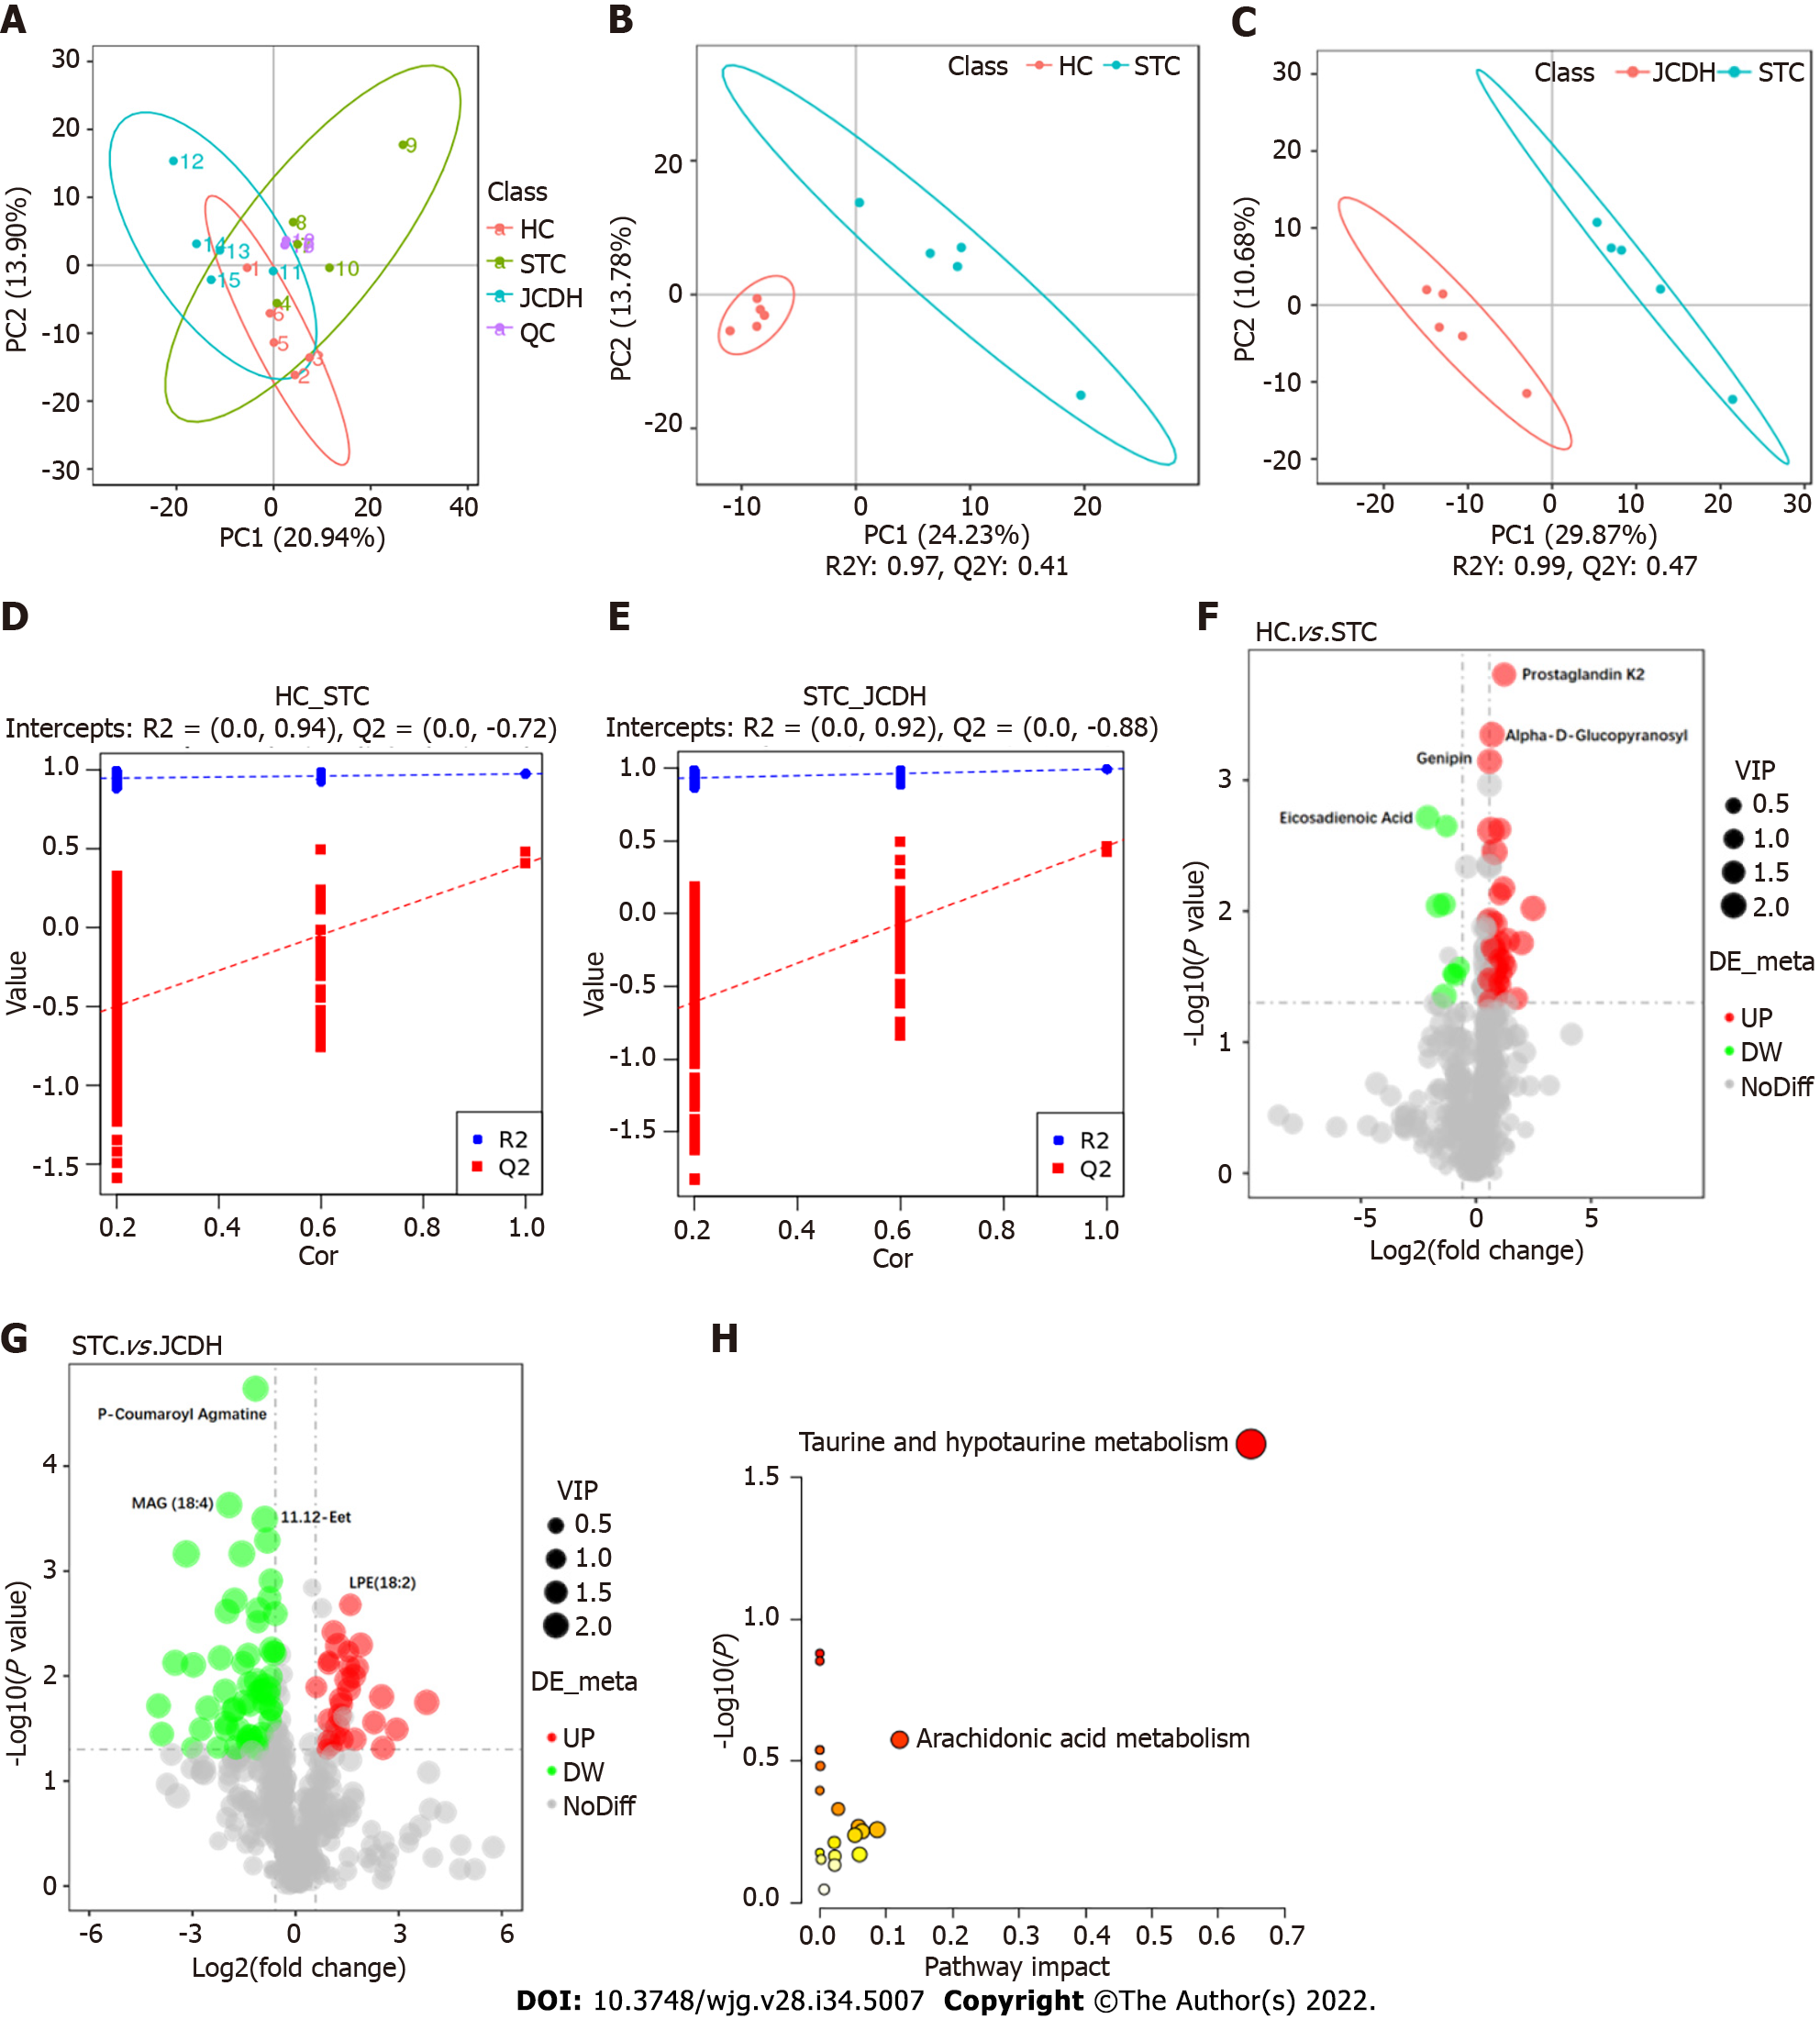
Figure 3 Different intestinal metabolites detected by ultrahigh-pressure liquid chromatography coupled with tandem mass spectrometry.
A: Principal component analysis; B: Orthogonal partial least squares discrimination analysis score plots of intestinal metabolic profiling in the healthy control (HC) vs slow transit constipation (STC) groups; C: STC vs high-dose Ji-Chuan decoction (JCDH) treatment groups under negative ion mode; D: Permutation test in negative ion mode of the HC vs STC groups; E: Permutation test in negative ion modes of the STC vs JCDH groups; F: Volcano plot of the different metabolites between the STC and HC groups; G: Volcano plot of the different metabolites between the JCDH and STC groups; H: Critical metabolic pathways of the STC vs JCDH groups. HC: Healthy control; STC: Slow transit constipation; JCD: Ji-Chuan decoction; JCDL: Low-dose Ji-Chuan decoction treatment; JCDM: Middle-dose Ji-Chuan decoction treatment; JCDH: High-dose Ji-Chuan decoction treatment; MSP: Mosapride treatment; MAG: 1-(6Z,9Z,12Z,15Z-Octadecatetraenoyl)-sn-glycerol; 11.12-EET: (5Z,8Z,14Z)-11,12-Epoxyeicosa-5,8,14-trienoic acid; LPE: 2-(9Z,12Z-octadecadienoyl)-sn-glycero-3-phosphoethanolamine; QC: Quality control.
Figure 4 Network construction, screening and validation of the core targets for Ji-Chuan decoction treatment of slow transit consti
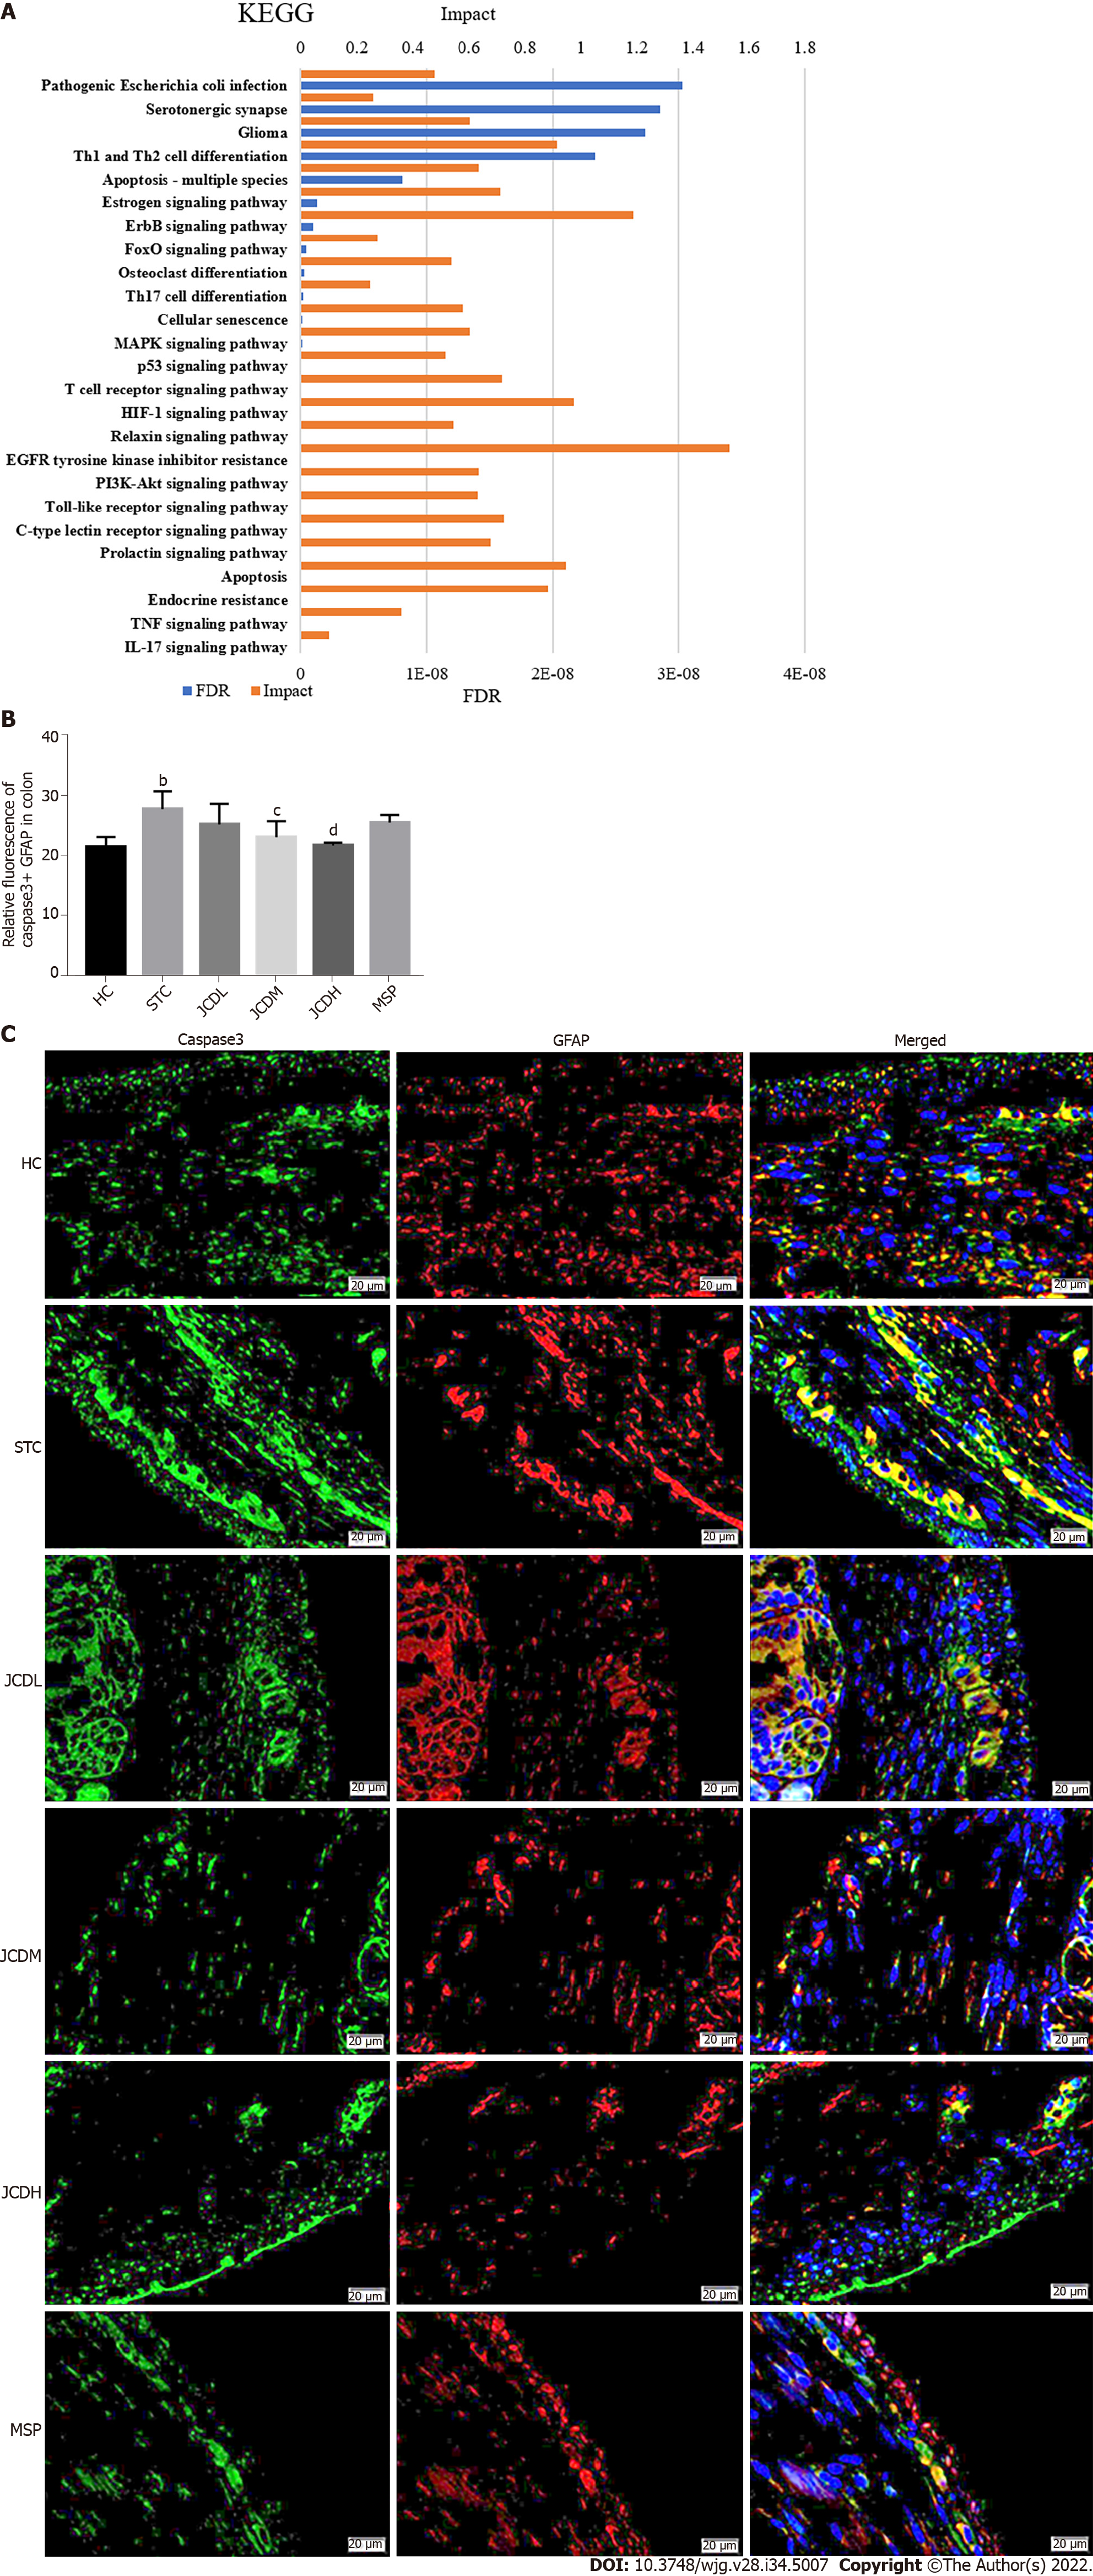
Figure 5 Integrative analysis and experimental validation of improved network pharmacology and metabolites.
A: Integration analysis between the modified network pharmacology and metabolites. The ordinate stands for pathways, the primary abscissa stands for minus false discovery rates, and the secondary abscissa stands for impact; B and C: The relative expression of Caspase3+ Glial fibrillary acidic protein was assessed by immunofluorescent staining. GFAP: Glial fibrillary acidic protein; HC: Healthy control; STC: Slow transit constipation; JCD: Ji-Chuan decoction; JCDL: Low-dose Ji-Chuan decoction treatment; JCDM: Middle-dose Ji-Chuan decoction treatment; JCDH: High-dose Ji-Chuan decoction treatment; MSP: Mosapride treatment; FDR: False discovery rates; KEGG: Kyoto Encyclopedia of Genes and Genomes; Th: Thyroid hormone; EGFR: Epidermal growth factor receptor; MAPK: Mitogen-activated protein kinase; IL: Interleukin; TNF: Tumor necrosis factor; HIF: Hypoxia-inducible factor. Data are expressed as the mean ± SD. Compared with the healthy control group: aP < 0.05, bP < 0.01. Compared with the slow transit constipation group: cP < 0.05, dP < 0.01.
- Citation: Wang XM, Lv LX, Qin YS, Zhang YZ, Yang N, Wu S, Xia XW, Yang H, Xu H, Liu Y, Ding WJ. Ji-Chuan decoction ameliorates slow transit constipation via regulation of intestinal glial cell apoptosis. World J Gastroenterol 2022; 28(34): 5007-5022
- URL: https://www.wjgnet.com/1007-9327/full/v28/i34/5007.htm
- DOI: https://dx.doi.org/10.3748/wjg.v28.i34.5007


