Copyright
©The Author(s) 2022.
World J Gastroenterol. Sep 7, 2022; 28(33): 4787-4811
Published online Sep 7, 2022. doi: 10.3748/wjg.v28.i33.4787
Published online Sep 7, 2022. doi: 10.3748/wjg.v28.i33.4787
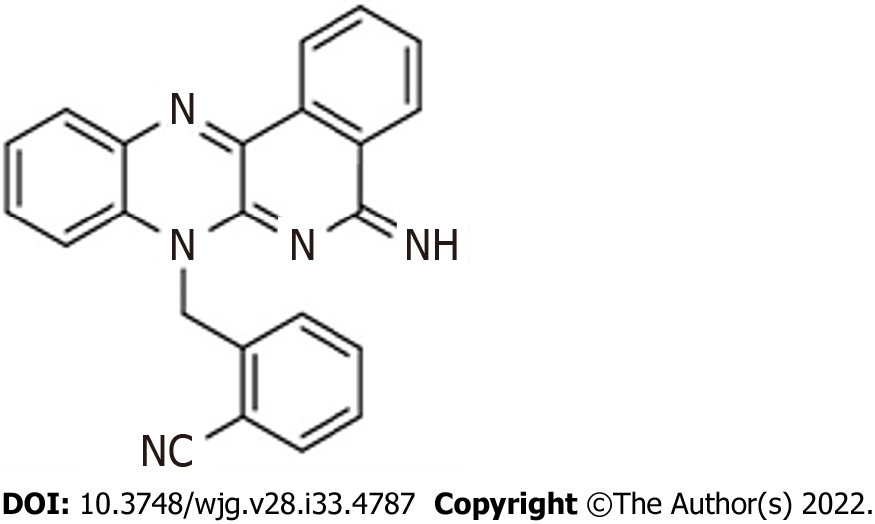
Figure 1 Chemical structure of the diiminoquinone compound.
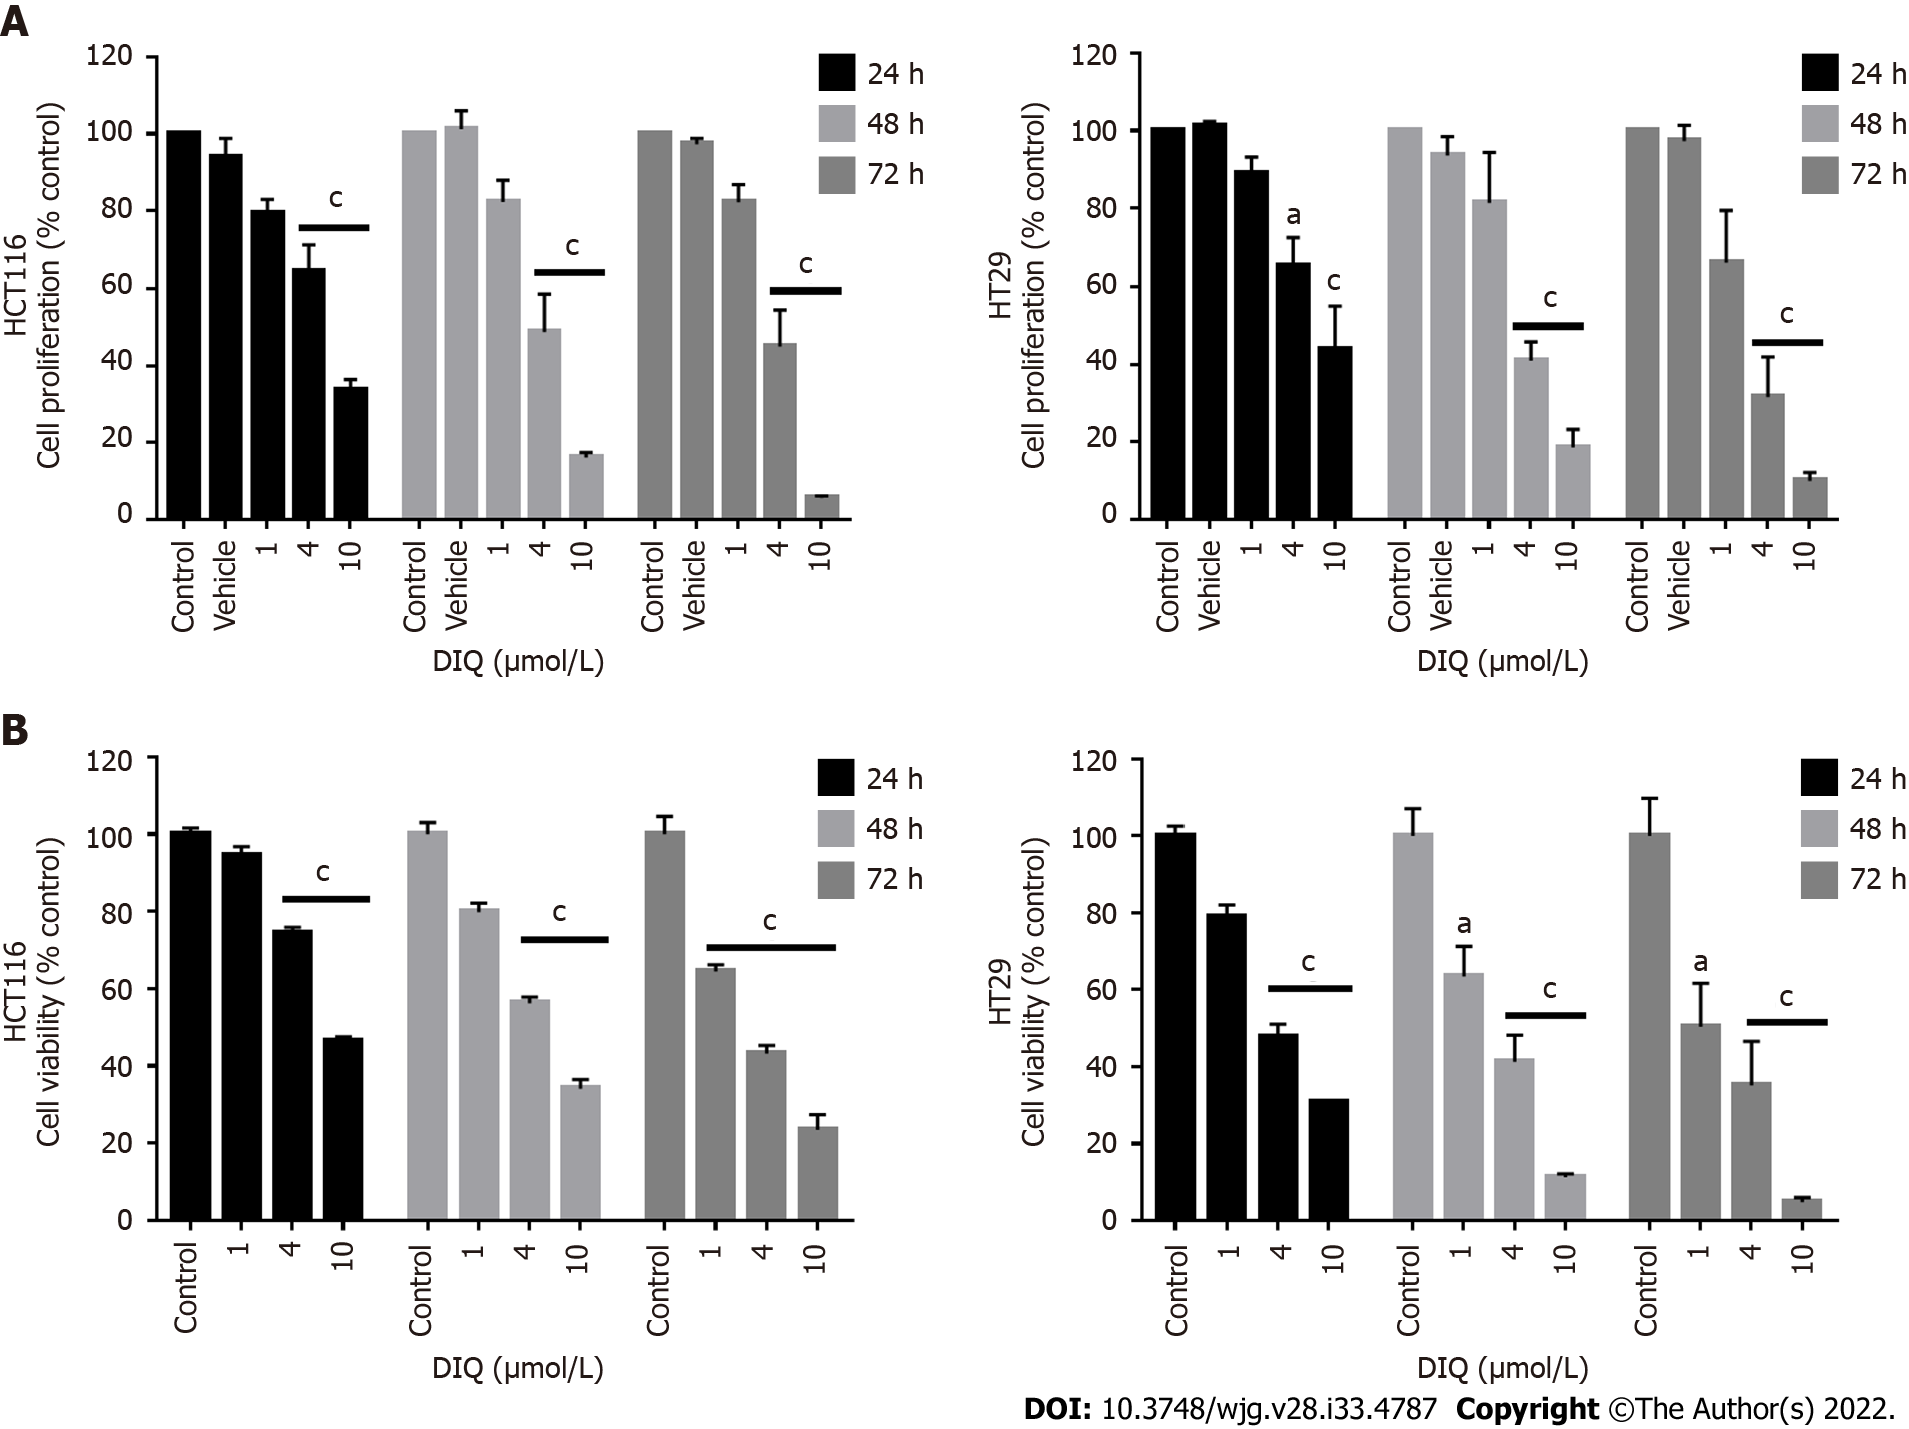
Figure 2 Diiminoquinone reduced the proliferation and the viability of HCT116 and HT29 colorectal cancer cell lines in a time- and dose-dependent manner.
A: The anticancer effect of different concentrations of diiminoquinone (DIQ) on the proliferation of HCT116 and HT29 cells using the MTT assay was determined in triplicates at 24, 48, and 72 h. Results were expressed as the percentage of proliferation of the treated group compared to the control at every time point; B: The anticancer effect of different concentrations of DIQ on the viability of HCT116 and HT29 cells using the trypan blue exclusion assay was determined in triplicates at 24, 48, and 72 h. Results were expressed as percentage of viable cells of the treated group compared to the control at every time point. Data represent an average of three independent experiments and is reported as mean ± standard error of the mean (aP < 0.05, bP < 0.01, cP < 0.001).
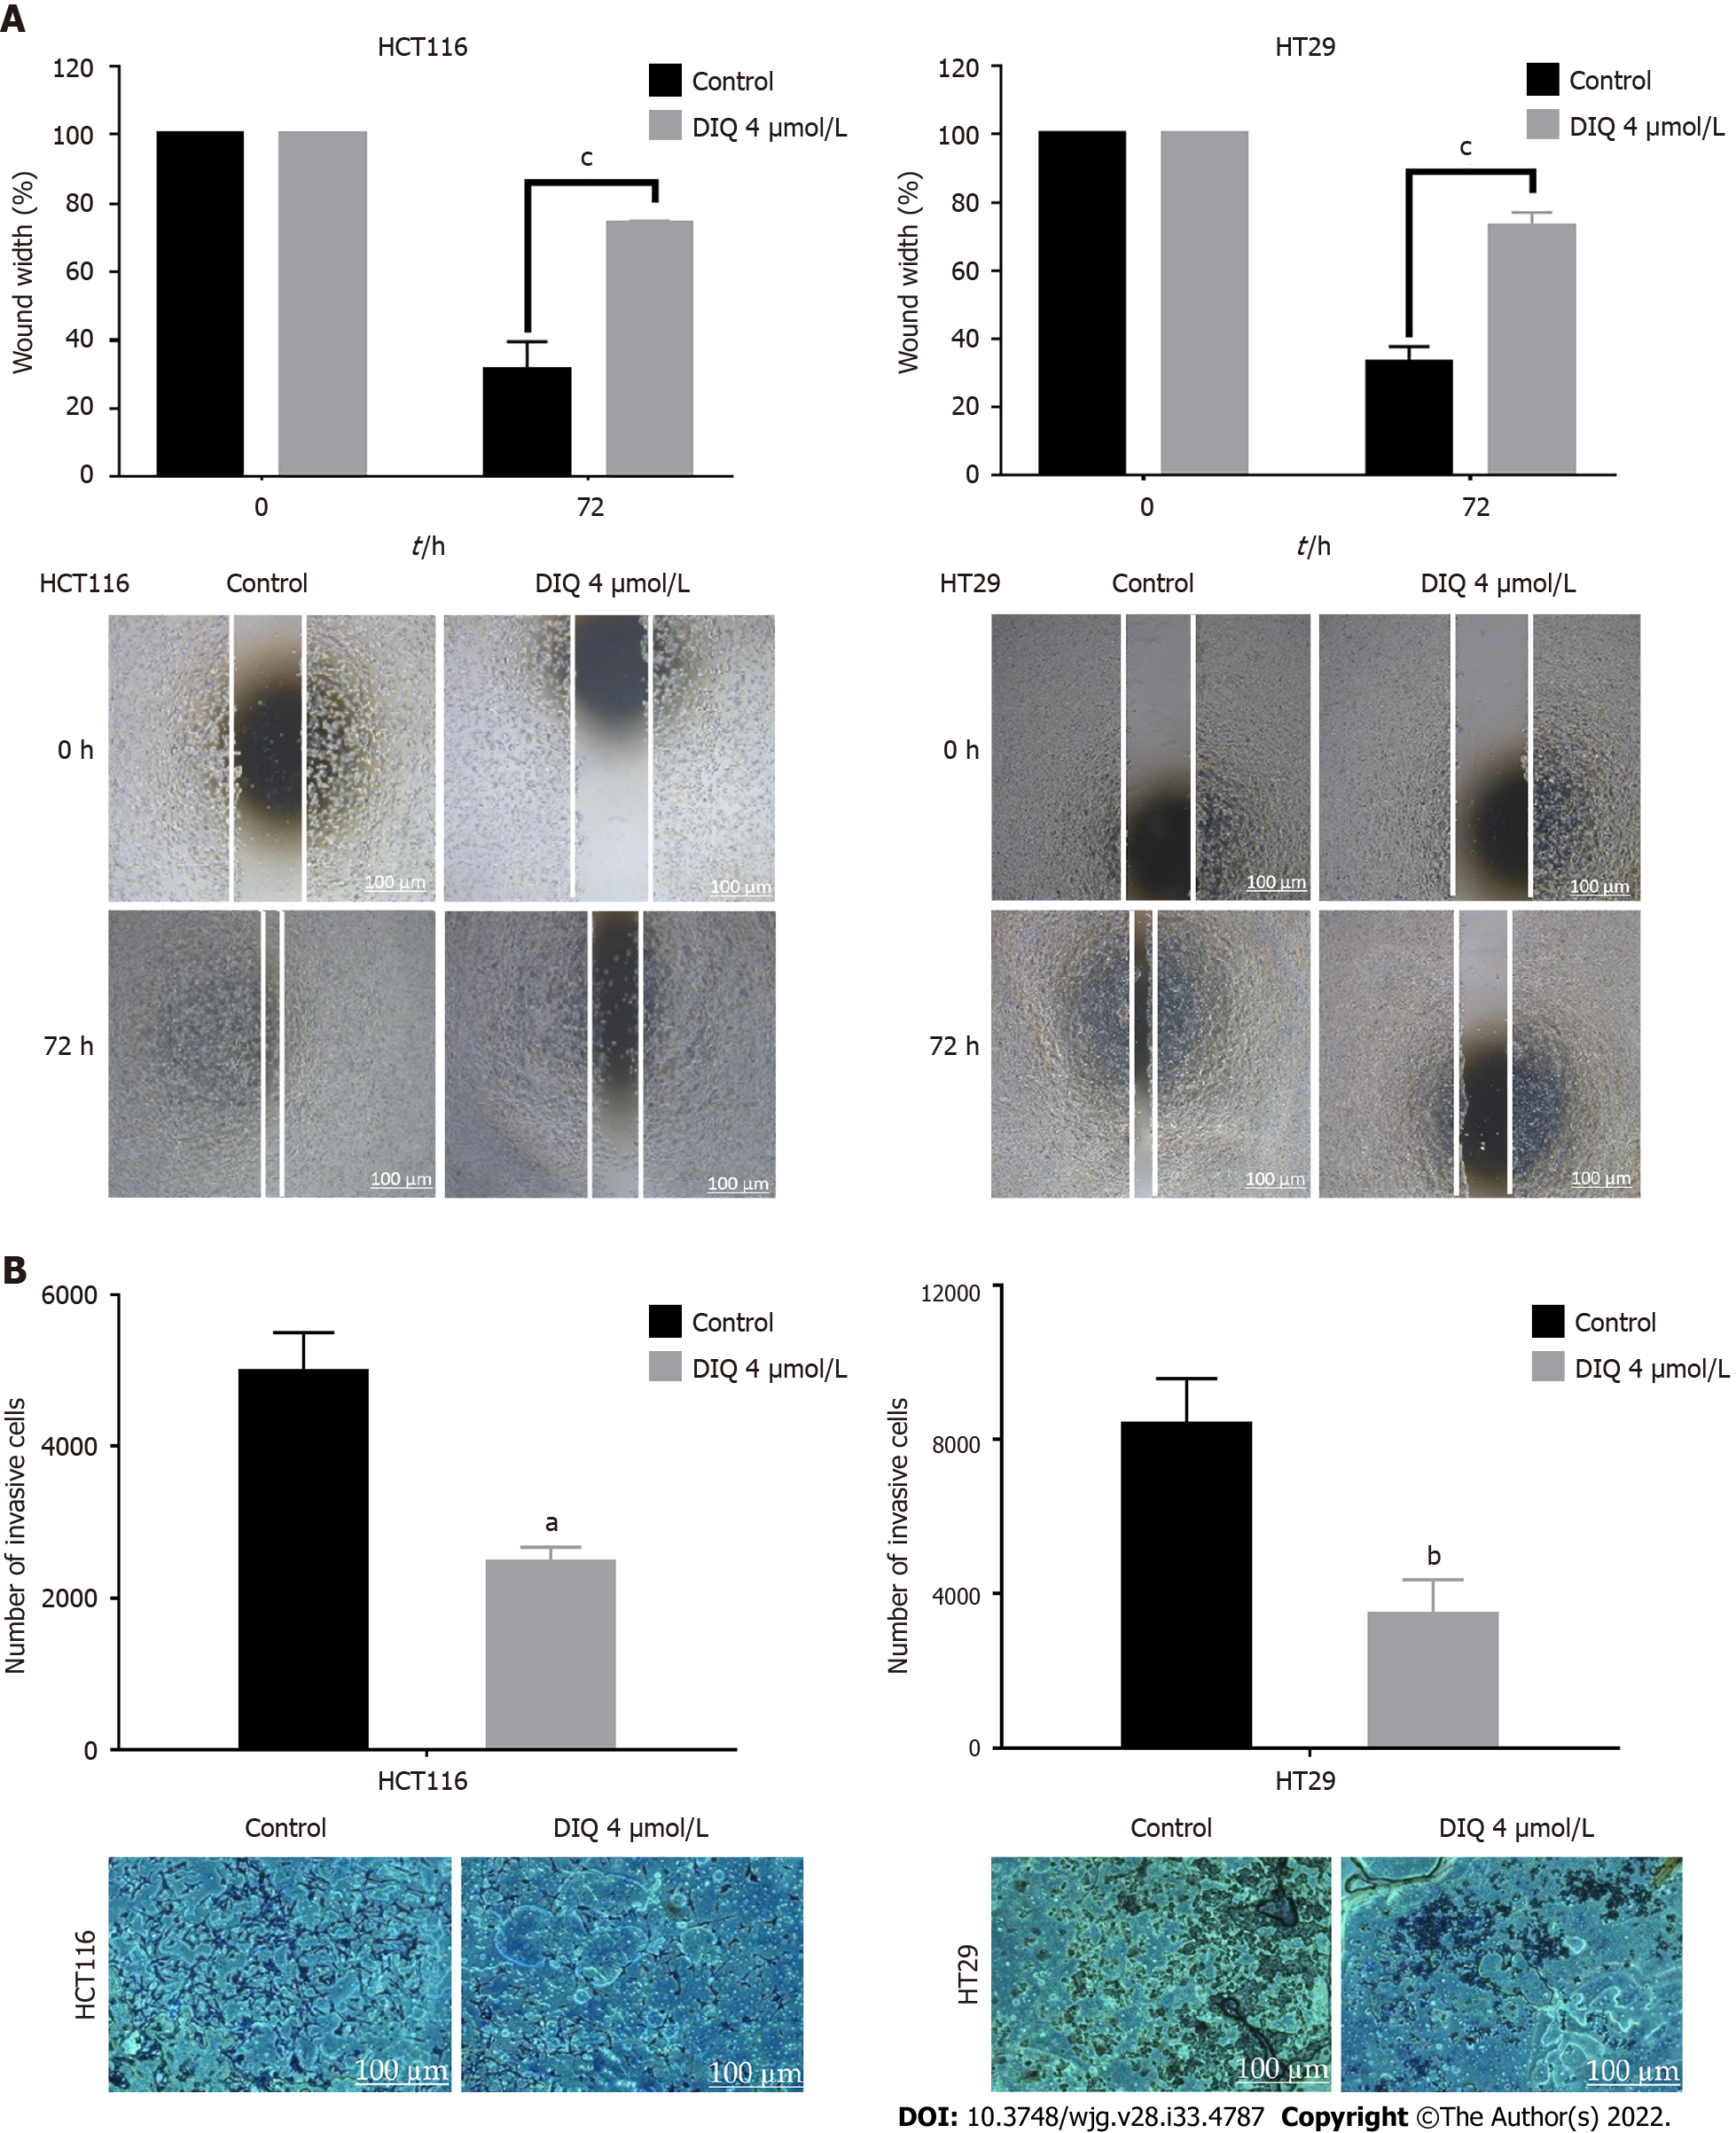
Figure 3 Diiminoquinone reduced the migration and the invasion of HCT116 and HT29 colorectal cancer cells.
A: HCT116 and HT29 cells were seeded in 24-well plates. A scratch was made on confluent cells using a 200 μL tip, and images were taken at 0 h and 72 h with or without the indicated treatment. Quantification of the distance of the wound closure was assessed over time. Representative images of wound healing assay at × 5 magnification (scale = 100 μm); B: Colorectal cancer cells were seeded onto the Matrigel-coated membrane in the top chamber of the transwell and were either treated or not with the indicated concentration in the presence of fetal bovine serum in the lower chamber. Cells that invaded to the lower chamber after 72 h were fixed, stained with hematoxylin and eosin, counted, and are represented as the number of invading cells compared to the control. Data represent an average of three independent experiments and is reported as mean ± standard error of the mean (aP < 0.05, bP < 0.01, cP < 0.001). DIQ: Diiminoquinone.
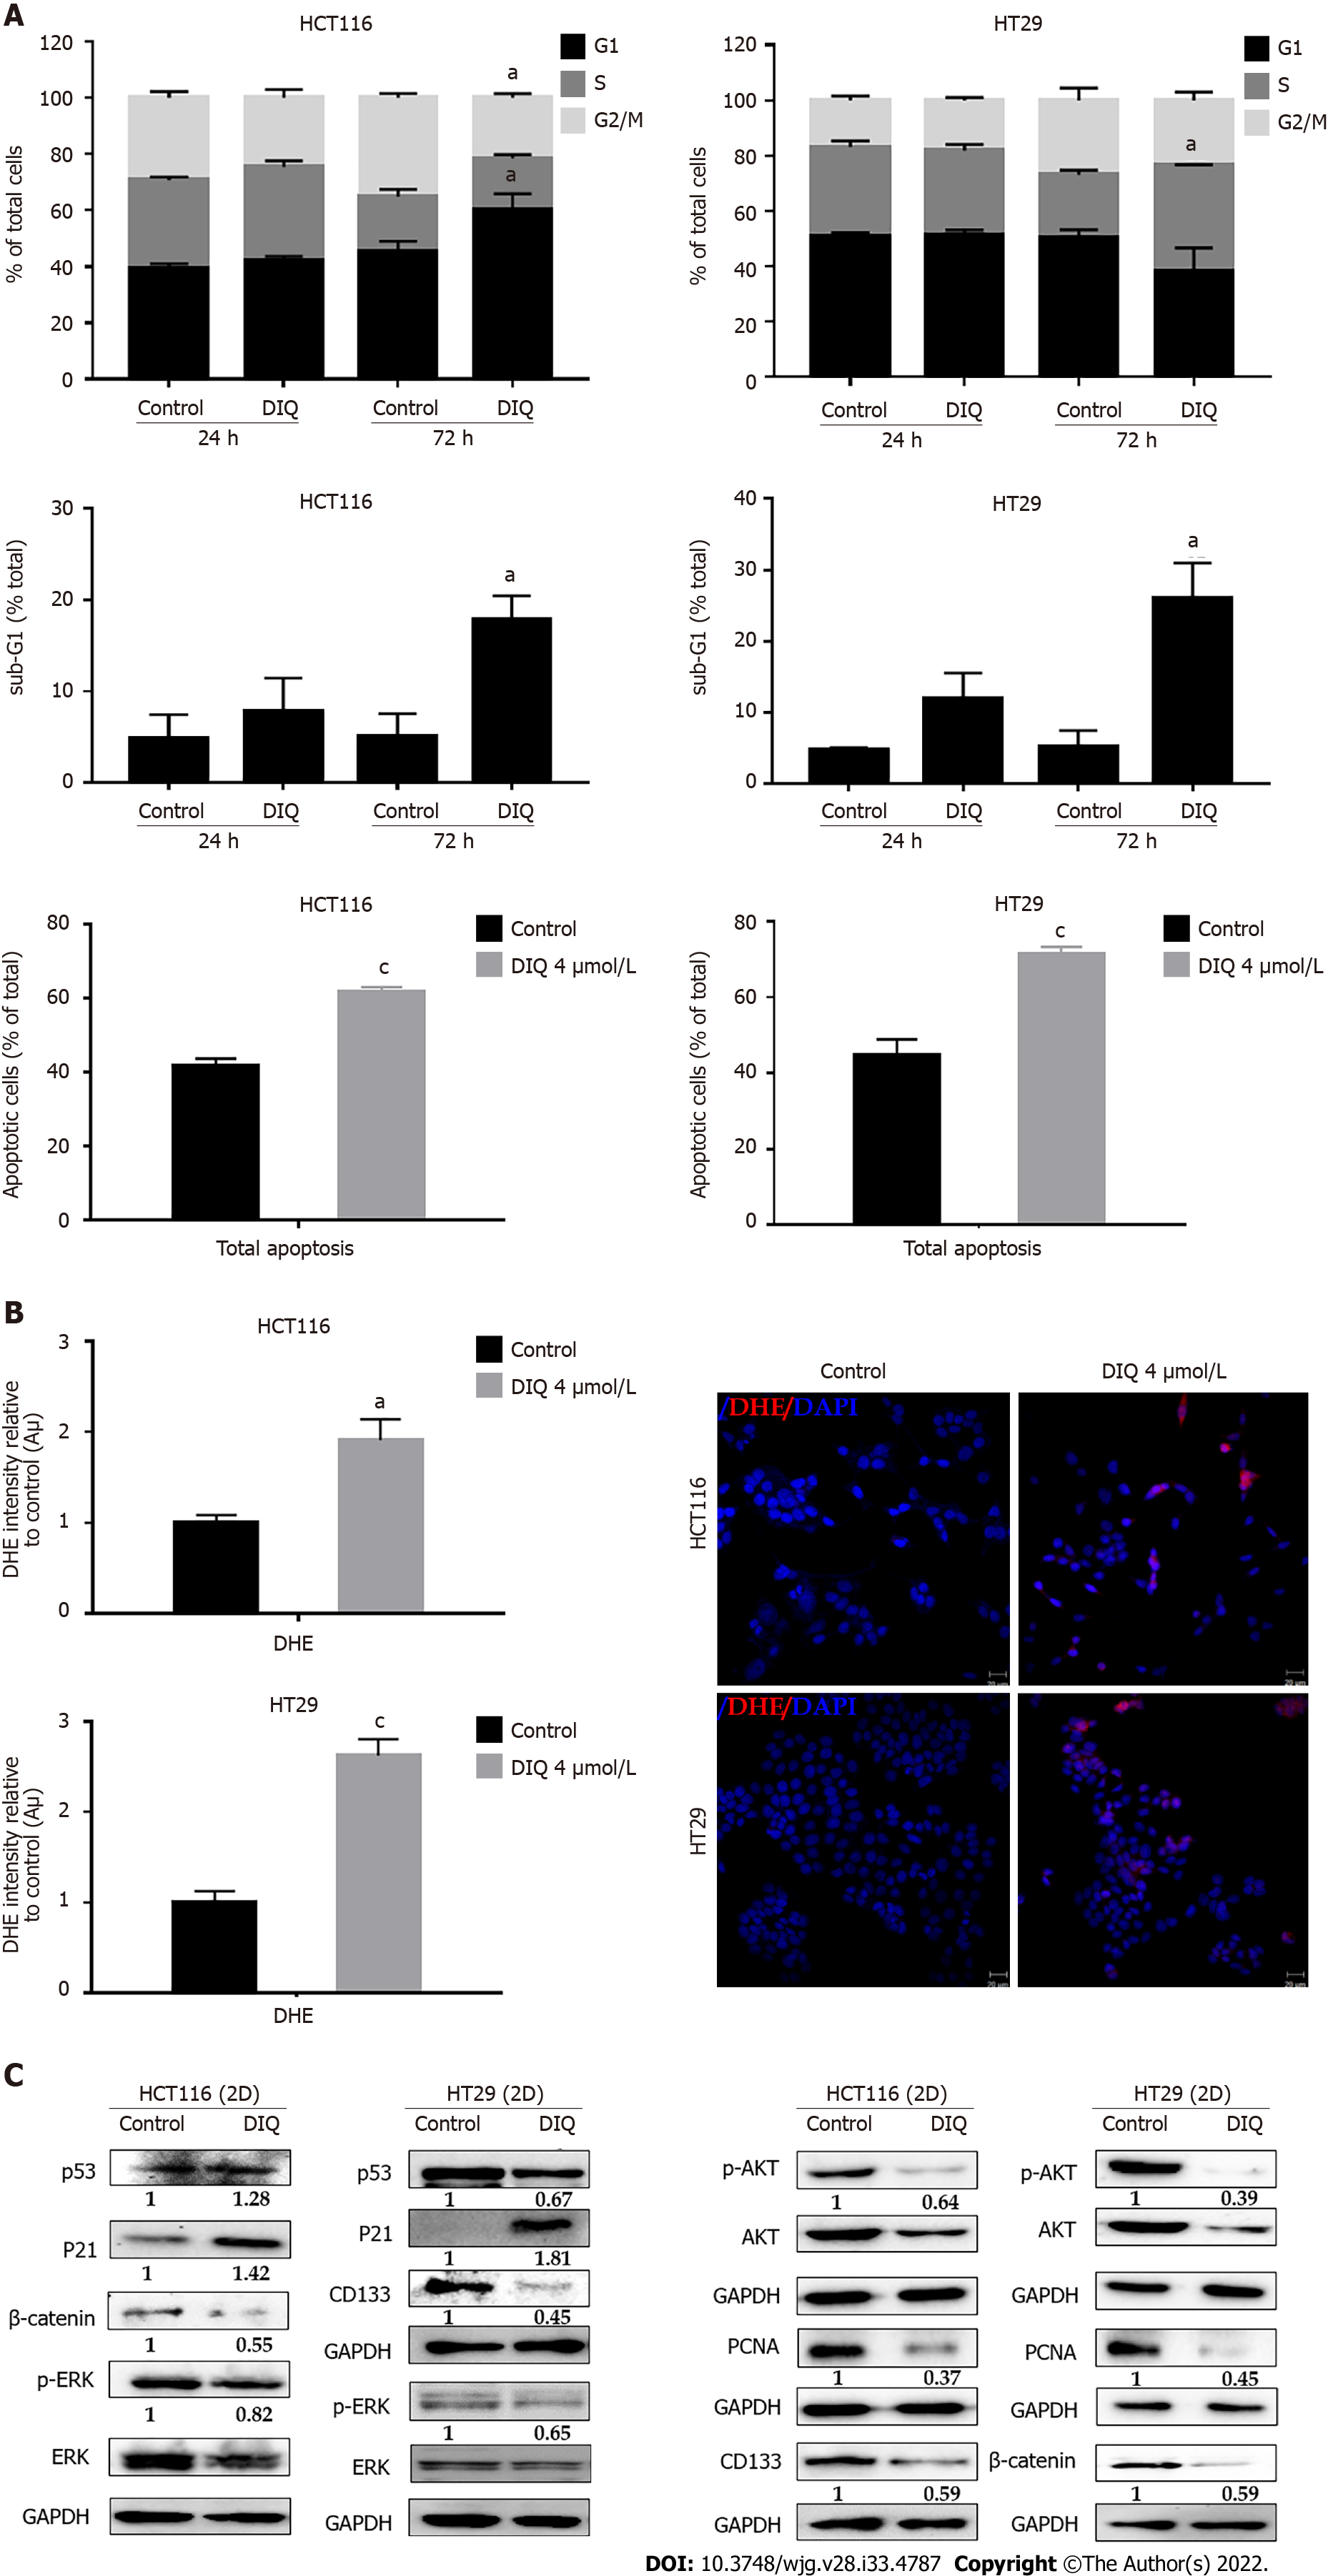
Figure 4 Diiminoquinone induced an accumulation of HCT116 and HT29 cancer cells in the sub-G1 region and apoptosis along with an increase in reactive oxygen species production.
A: The distribution of phases of the cell cycle upon diiminoquinone (DIQ) treatment at 24 h and 72 h in HCT116 and HT29 cells using propidium iodide-based flow cytometric analysis of DNA content was shown. Data represent the average of three independent experiments and are reported as mean ± standard error of the mean (aP < 0.05, bP < 0.01, cP < 0.001); B: Reactive oxygen species (ROS) production in HCT116 and HT29 cells was detected by dihydroethidium (DHE) staining. Representative images of colorectal cancer cells exposed to DIQ stained with DHE for ROS content (red color). Cell nuclei were stained with 4’,6-diamidino-2-phenylindole (DAPI) (blue). A summary of the quantification of the red fluorescence intensity was represented; C: Lysates of colorectal cancer cells treated with 4 μmol/L DIQ were immunoblotted for p53, p21, β-catenin, p-ERK, ERK, p-AKT, AKT, and proliferating cell nuclear antigen (PCNA). Bands were detected by enhanced chemiluminescence and quantified using ChemiDoc MP Imaging System. Data represent an average of three independent experiments and is reported as mean ± standard error of the mean (aP < 0.05, bP < 0.01, cP < 0.001).
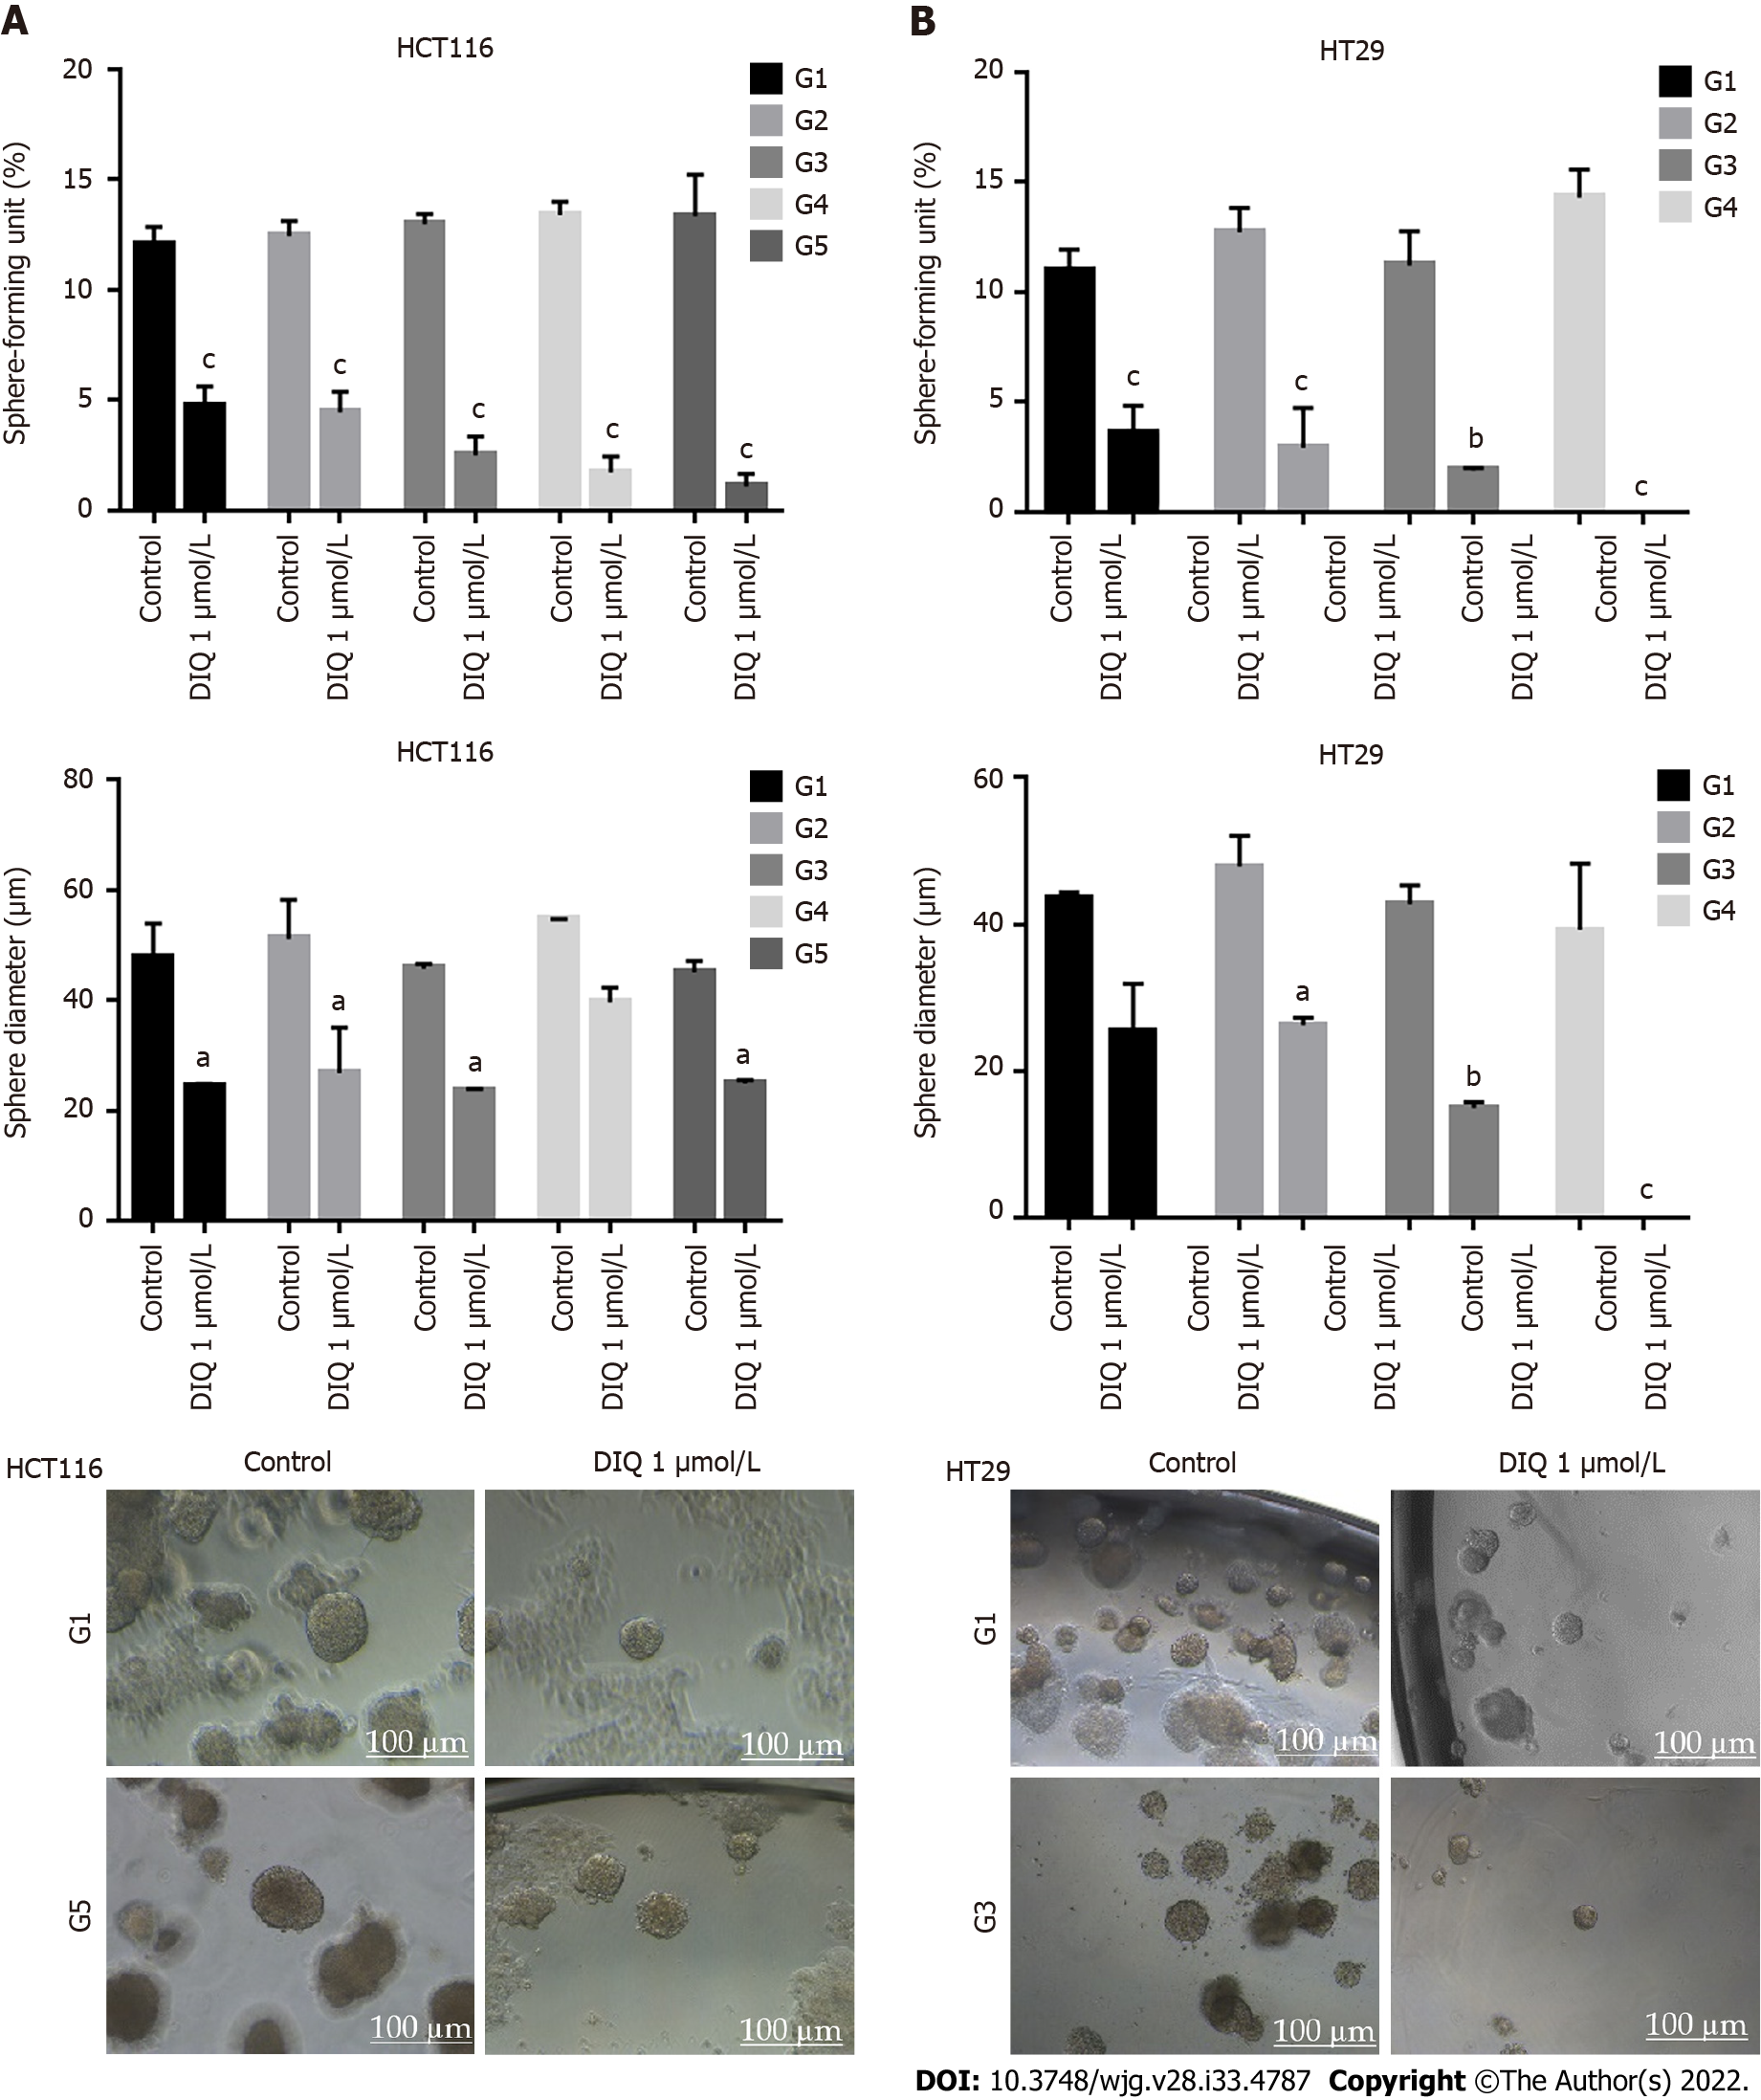
Figure 5 Diiminoquinone reduced the sphere-forming and self-renewal ability of colon cancer stem/progenitor cells.
A: HCT116 and B: HT29 cells were seeded at a density of 1000 single cells/well in Matrigel™ for 8 d with and without 1 μmol/L diiminoquinone (DIQ) at generation 1. Spheres were propagated for five generations in duplicates for each condition. Media or treatment was replenished every 2 d. Spheres were counted at day 8-12 of sphere culture. Results are expressed as sphere-formation unit, which was calculated according to the following formula: sphere-formation unit = (number of spheres counted/number of input cells) × 100. Quantification of the average size of generation 1 to generation 5 colon cancer spheres with or without treatment conditions. Spheres sizes were measured by Carl Zeiss Zen 2012 image software. Data represent an average diameter (μm) of 50 measured spheres. Representative bright field images of HCT116 and HT29 colon spheres in MatrigelTM taken by the Axiovert inverted microscope are shown. Data represent an average of three independent experiments and is reported as mean ± standard error of the mean (aP < 0.05, bP < 0.01, cP < 0.001).
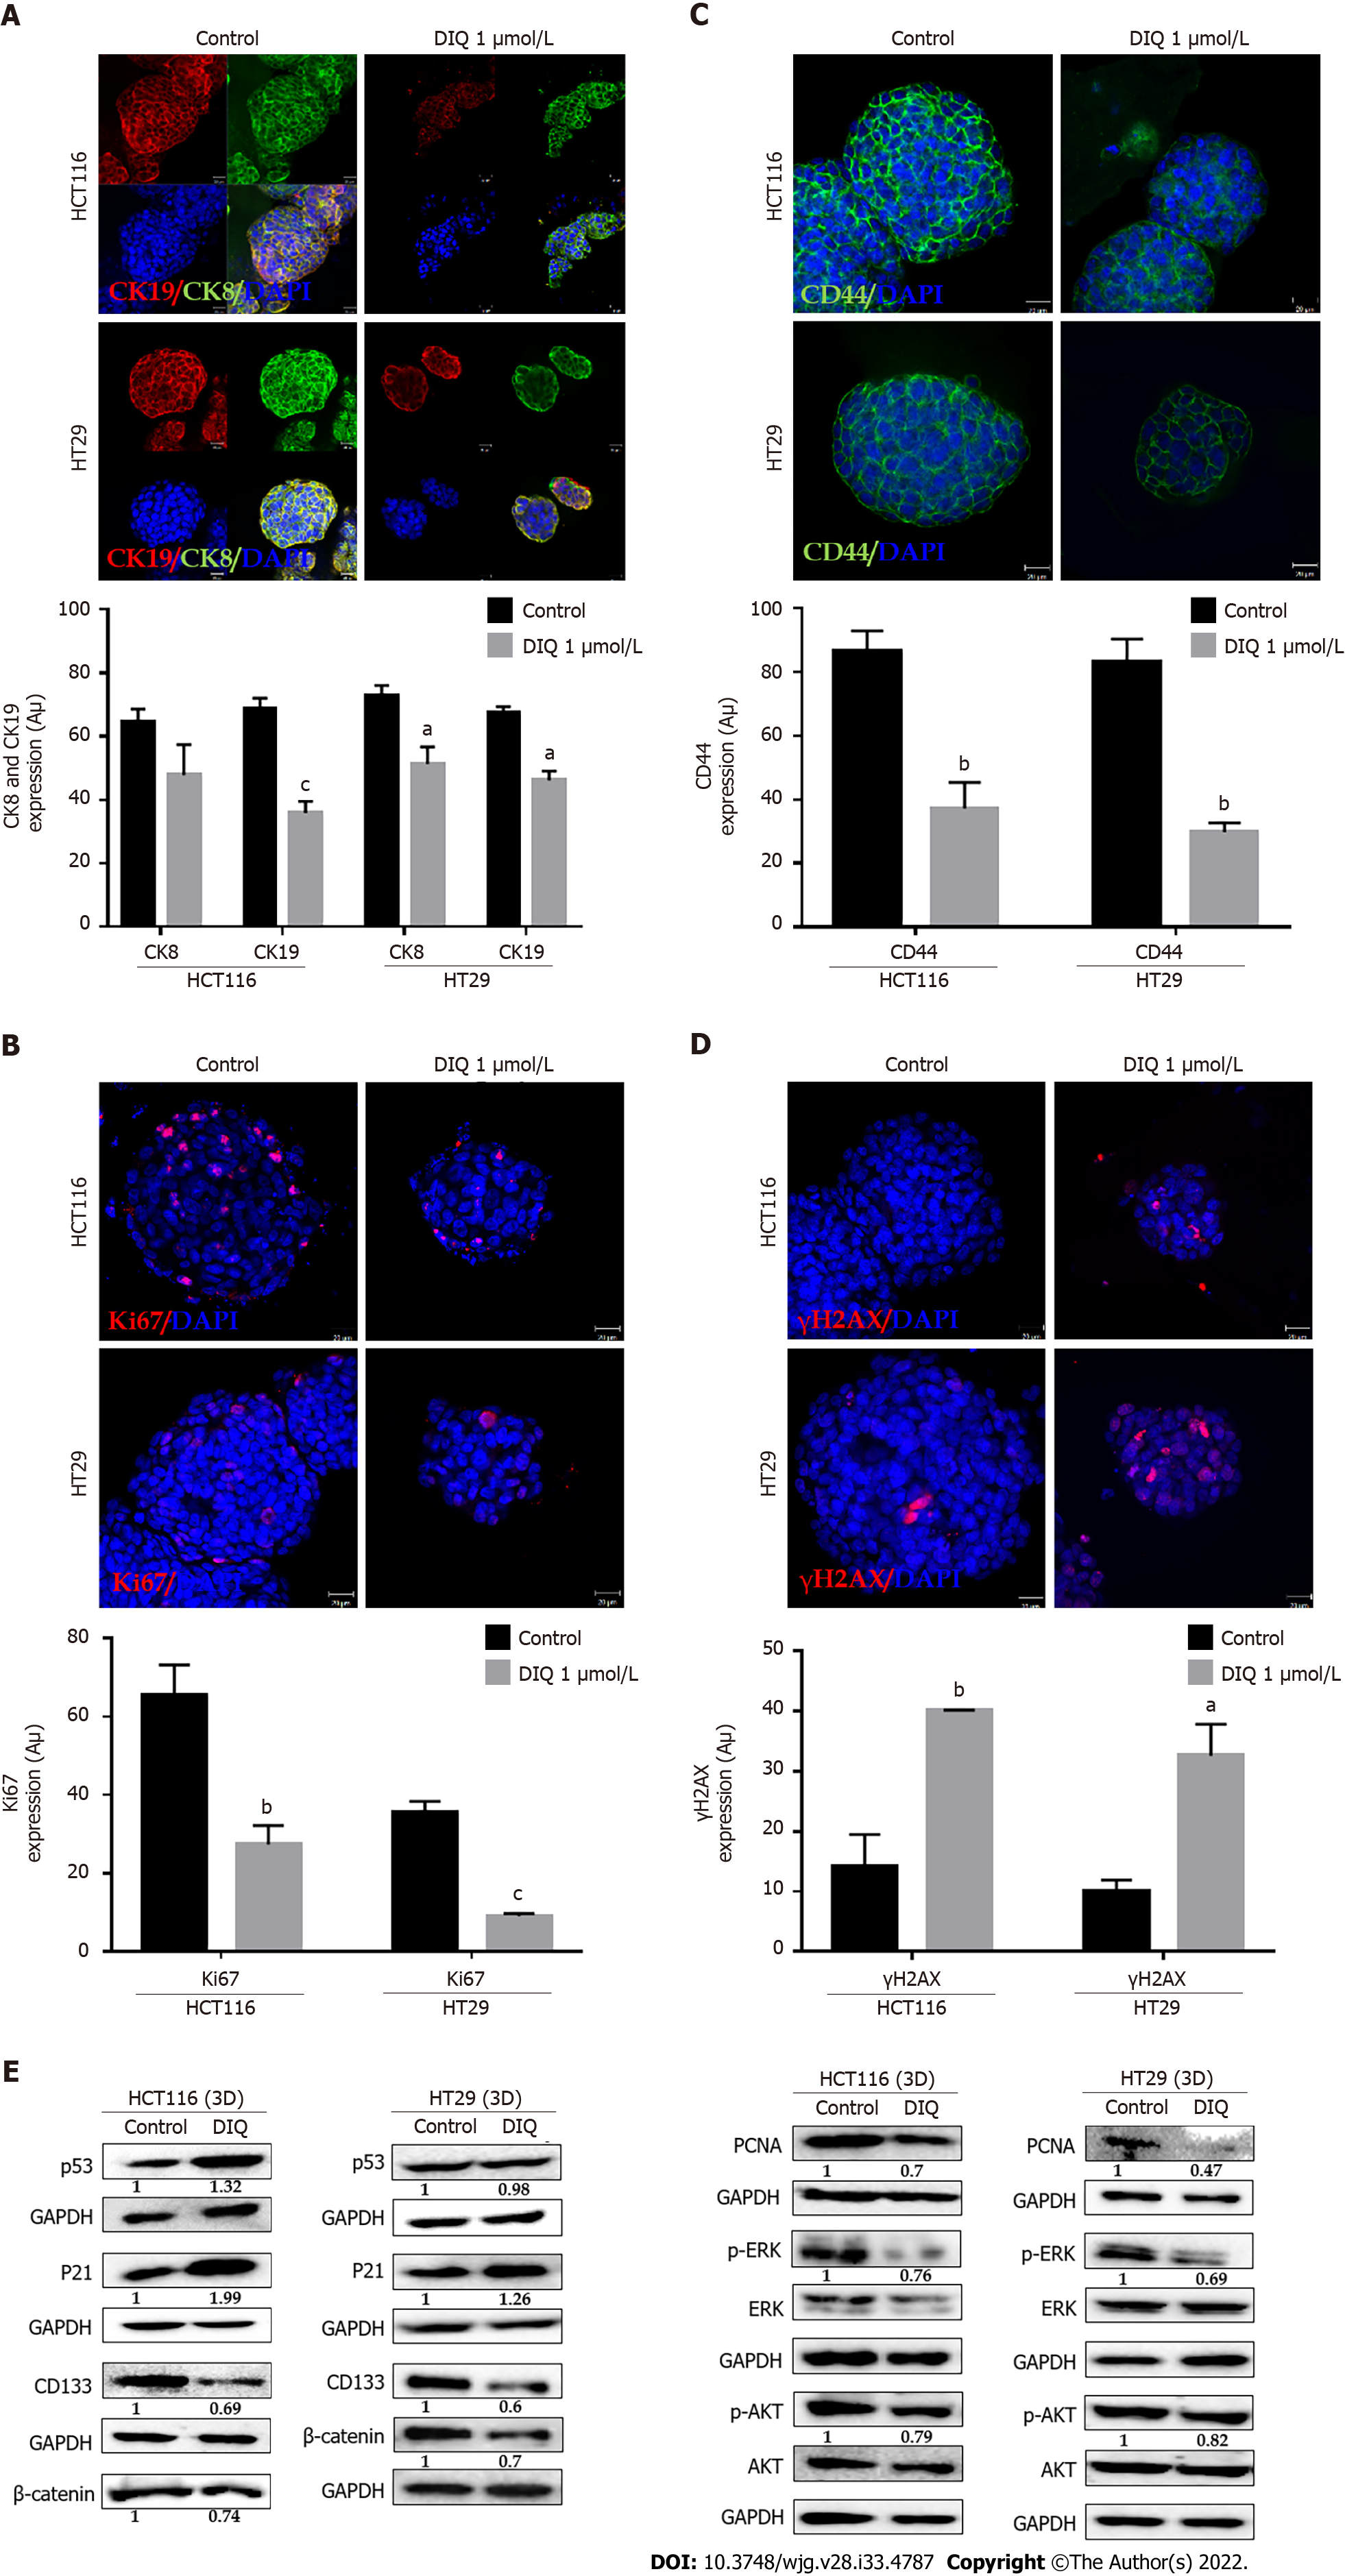
Figure 6 Diiminoquinone induced apoptosis and inhibited proliferation in colon cancer stem/progenitor cells.
Representative immuno
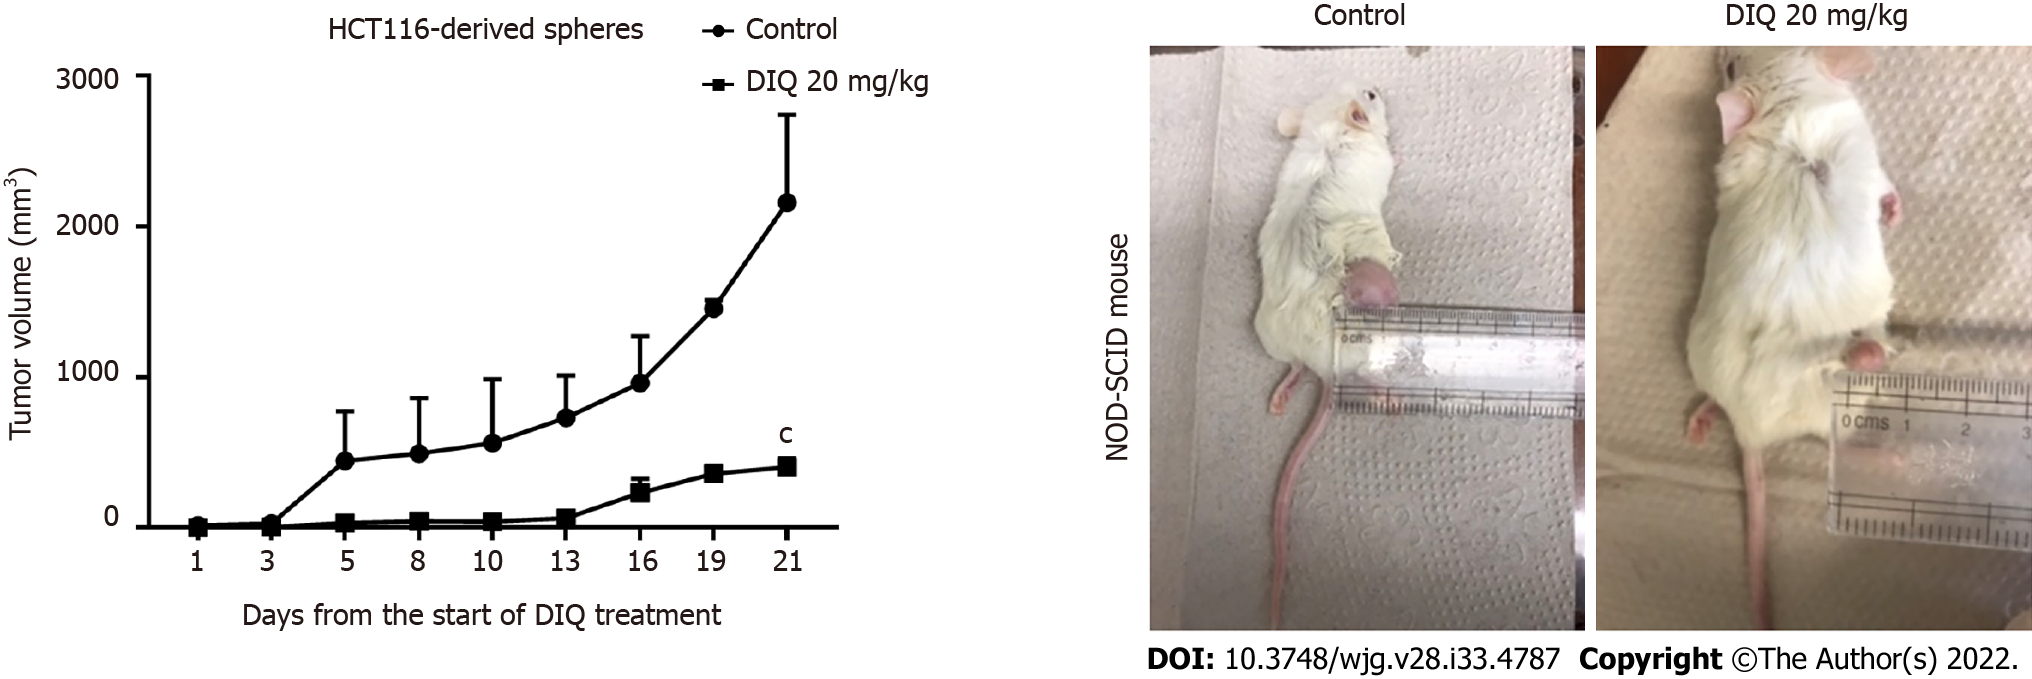
Figure 7 Diiminoquinone reduced tumor growth in non-obese diabetic severe combined immunodeficiency mice.
Non-obese diabetic severe combined immunodeficiency (NOD-SCID) mice (5 mice/group) were injected with 100 HCT116 generation 1 spheres. Tumor growth was monitored by measuring the tumor volume during 21 d of treatment (3 times per week) with either 20 mg/kg diiminoquinone (DIQ) or physiologic saline. Representative images of control and DIQ-treated mice at day 21. Data represent an average of two independent experiments and is reported as mean ± standard error of the mean (aP < 0.05, bP < 0.01, cP < 0.001).
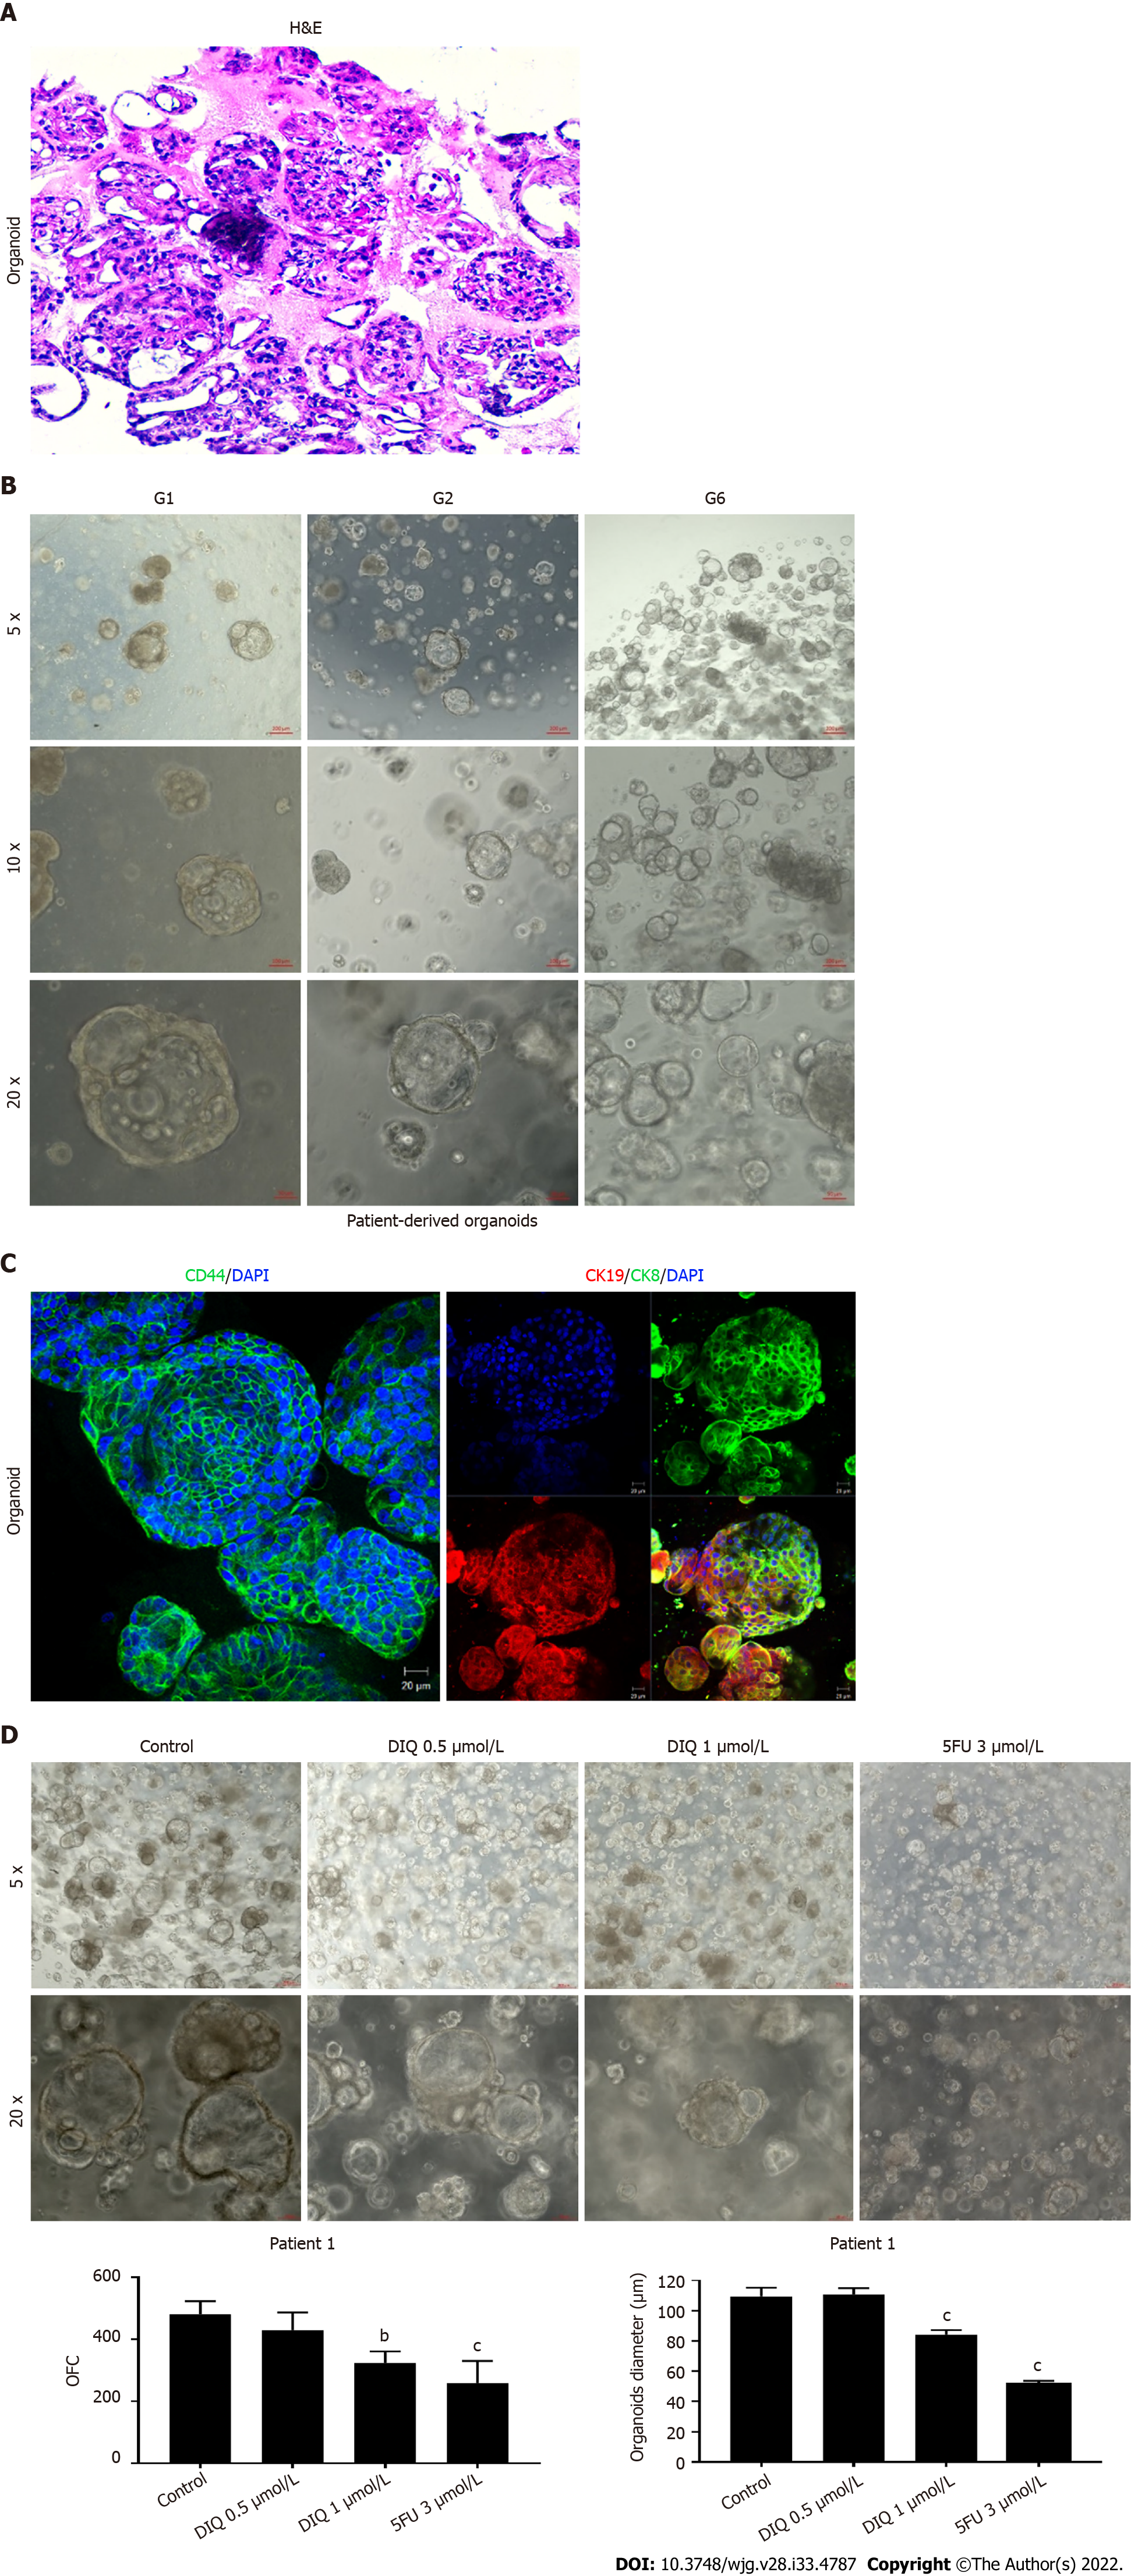
Figure 8 Establishment and characterization of patient-derived organoids from colon cancer patient 1.
A: Representative image of organoids derived from patient 1 stained with hematoxylin and eosin (HE); B: Representative bright-field images of organoids at generation (G)1, G2, and G6. Fresh tumor tissues were enzymatically digested, and single cells were plated in 90% growth factor-reduced Matrigel. G1 organoids were successfully propagated up to G6. Images were visualized by Axiovert inverted microscope at × 5, × 10, and × 20 magnification. Scale bar 100 μm; C: Immunofluorescent images of organoids stained with colon lineage epithelial markers cytokeratin (CK)19 and CK8 and stem cell marker CD44. The nuclei were stained with anti-fade Fluorogel II with 4’,6-diamidino-2-phenylindole (DAPI). Representative confocal microscopy images were acquired using a Zeiss LSM 710 laser scanning confocal microscope. Scale bar 100 μm; D: Representative bright-field images of G2 organoids treated with diiminoquinone (DIQ) (0.5 and 1 μmol/L) or 5-fluorouracil (5FU) (3 μmol/L). Organoid formation count (OFC) and size were calculated, and mean values were reported as mean ± standard error of the mean (aP < 0.05, bP < 0.01, cP < 0.001). Images were visualized by Axiovert inverted microscope at × 5 and × 20 magnification. Scale bar 100 μm.
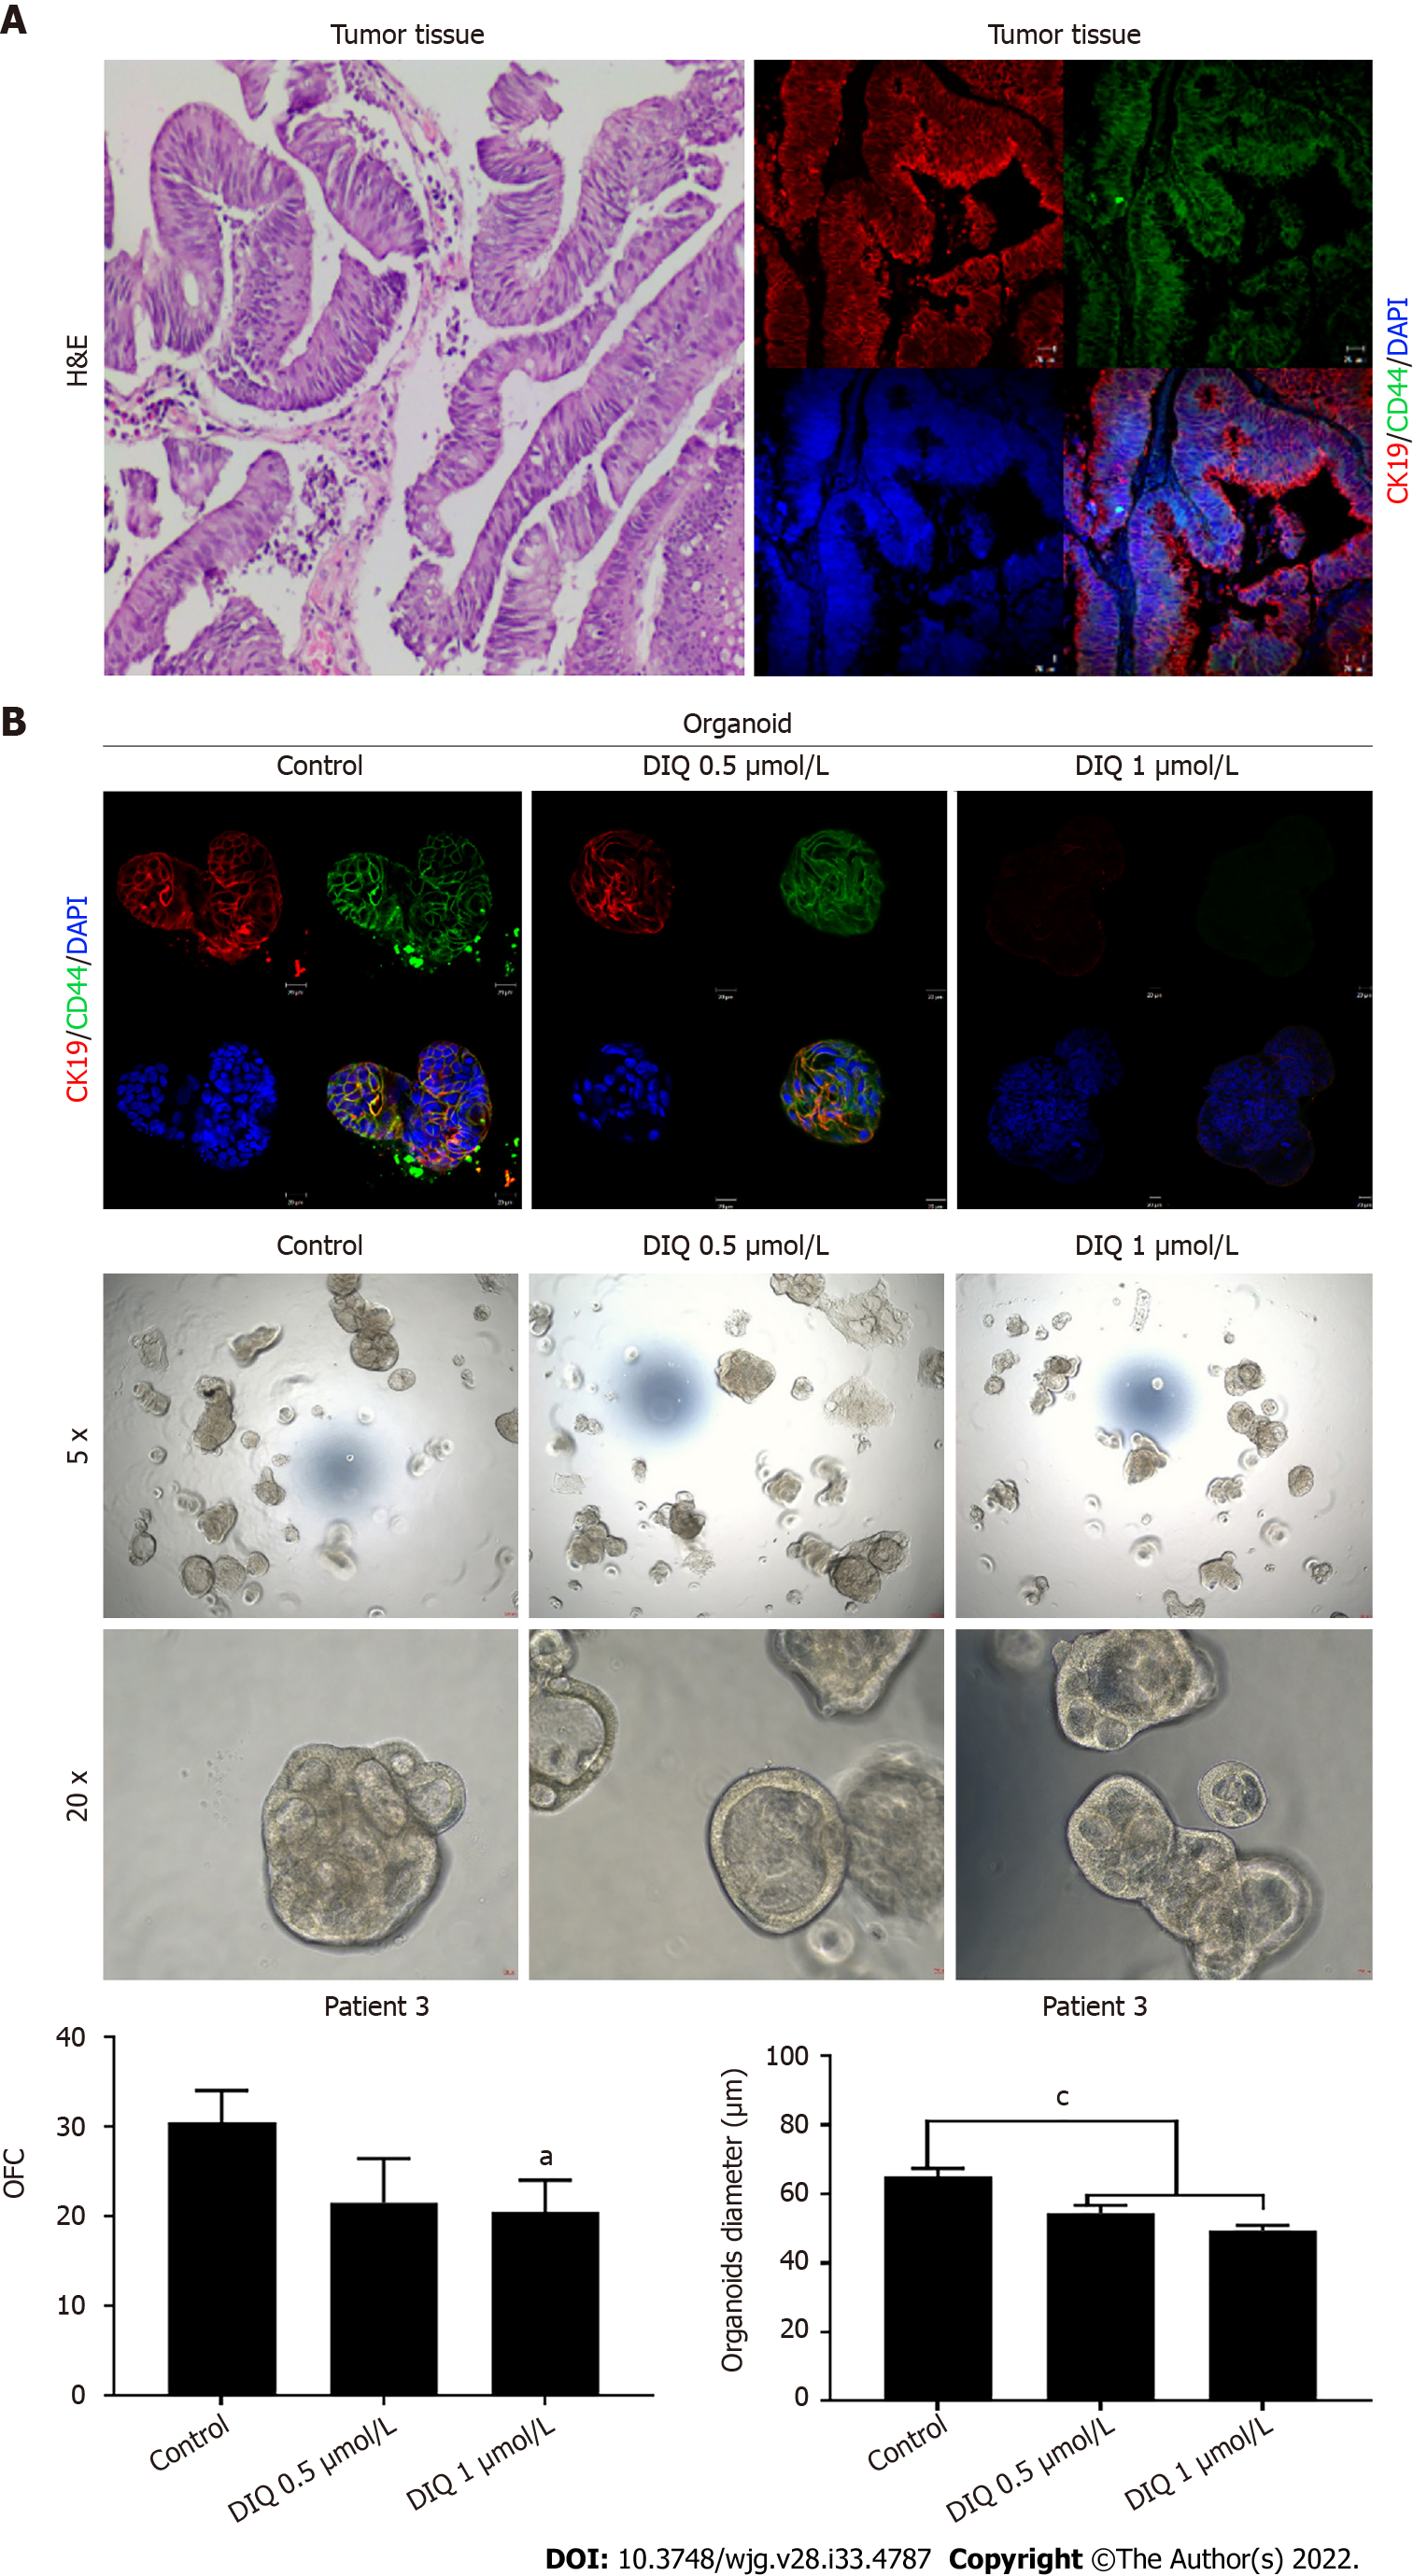
Figure 9 Effect of diiminoquinone on established patient-derived organoids from colon cancer patient 3.
A: Immunohistochemistry images of tissue derived from patient 3 stained with hematoxylin and eosin (HE). Immunofluorescent images of tissue stained with colon lineage epithelial markers cytokeratin (CK)19 and stem cell marker CD44. The nuclei were stained with anti-fade Fluorogel II with 4’, 6-diamidino-2-phenylindole (DAPI). Representative confocal microscopy images were acquired using a Zeiss LSM 710 laser scanning confocal microscope. Scale bar 20 μm; B: Immunofluorescent images of organoids derived from colon cancer patient 3 at generation (G)2 in the presence and absence of diiminoquinone (DIQ) treatment (0.5 and 1 μmol/L) stained with colon lineage epithelial markers CK19 and stem cell marker CD44. The nuclei were stained with anti-fade Fluorogel II with DAPI. Representative confocal microscopy images were acquired using a Zeiss LSM 710 laser scanning confocal microscope. Scale bar 20 μm. Representative bright-field images of organoids derived from colon cancer patient 3 at G2 in the presence and absence of DIQ treatment (0.5 and 1 μmol/L). Organoid formation count and size were calculated, and mean values were reported as mean ± standard error of the mean (aP < 0.05, bP < 0.01, cP < 0.001). Images were visualized by Axiovert inverted microscope at × 5 and × 20 magnification. Organoid formation count (OFC) and size of G were calculated, and mean values were reported as mean ± standard error of the mean (aP < 0.05, bP < 0.01, cP < 0.001). Scale bar 100 μm.
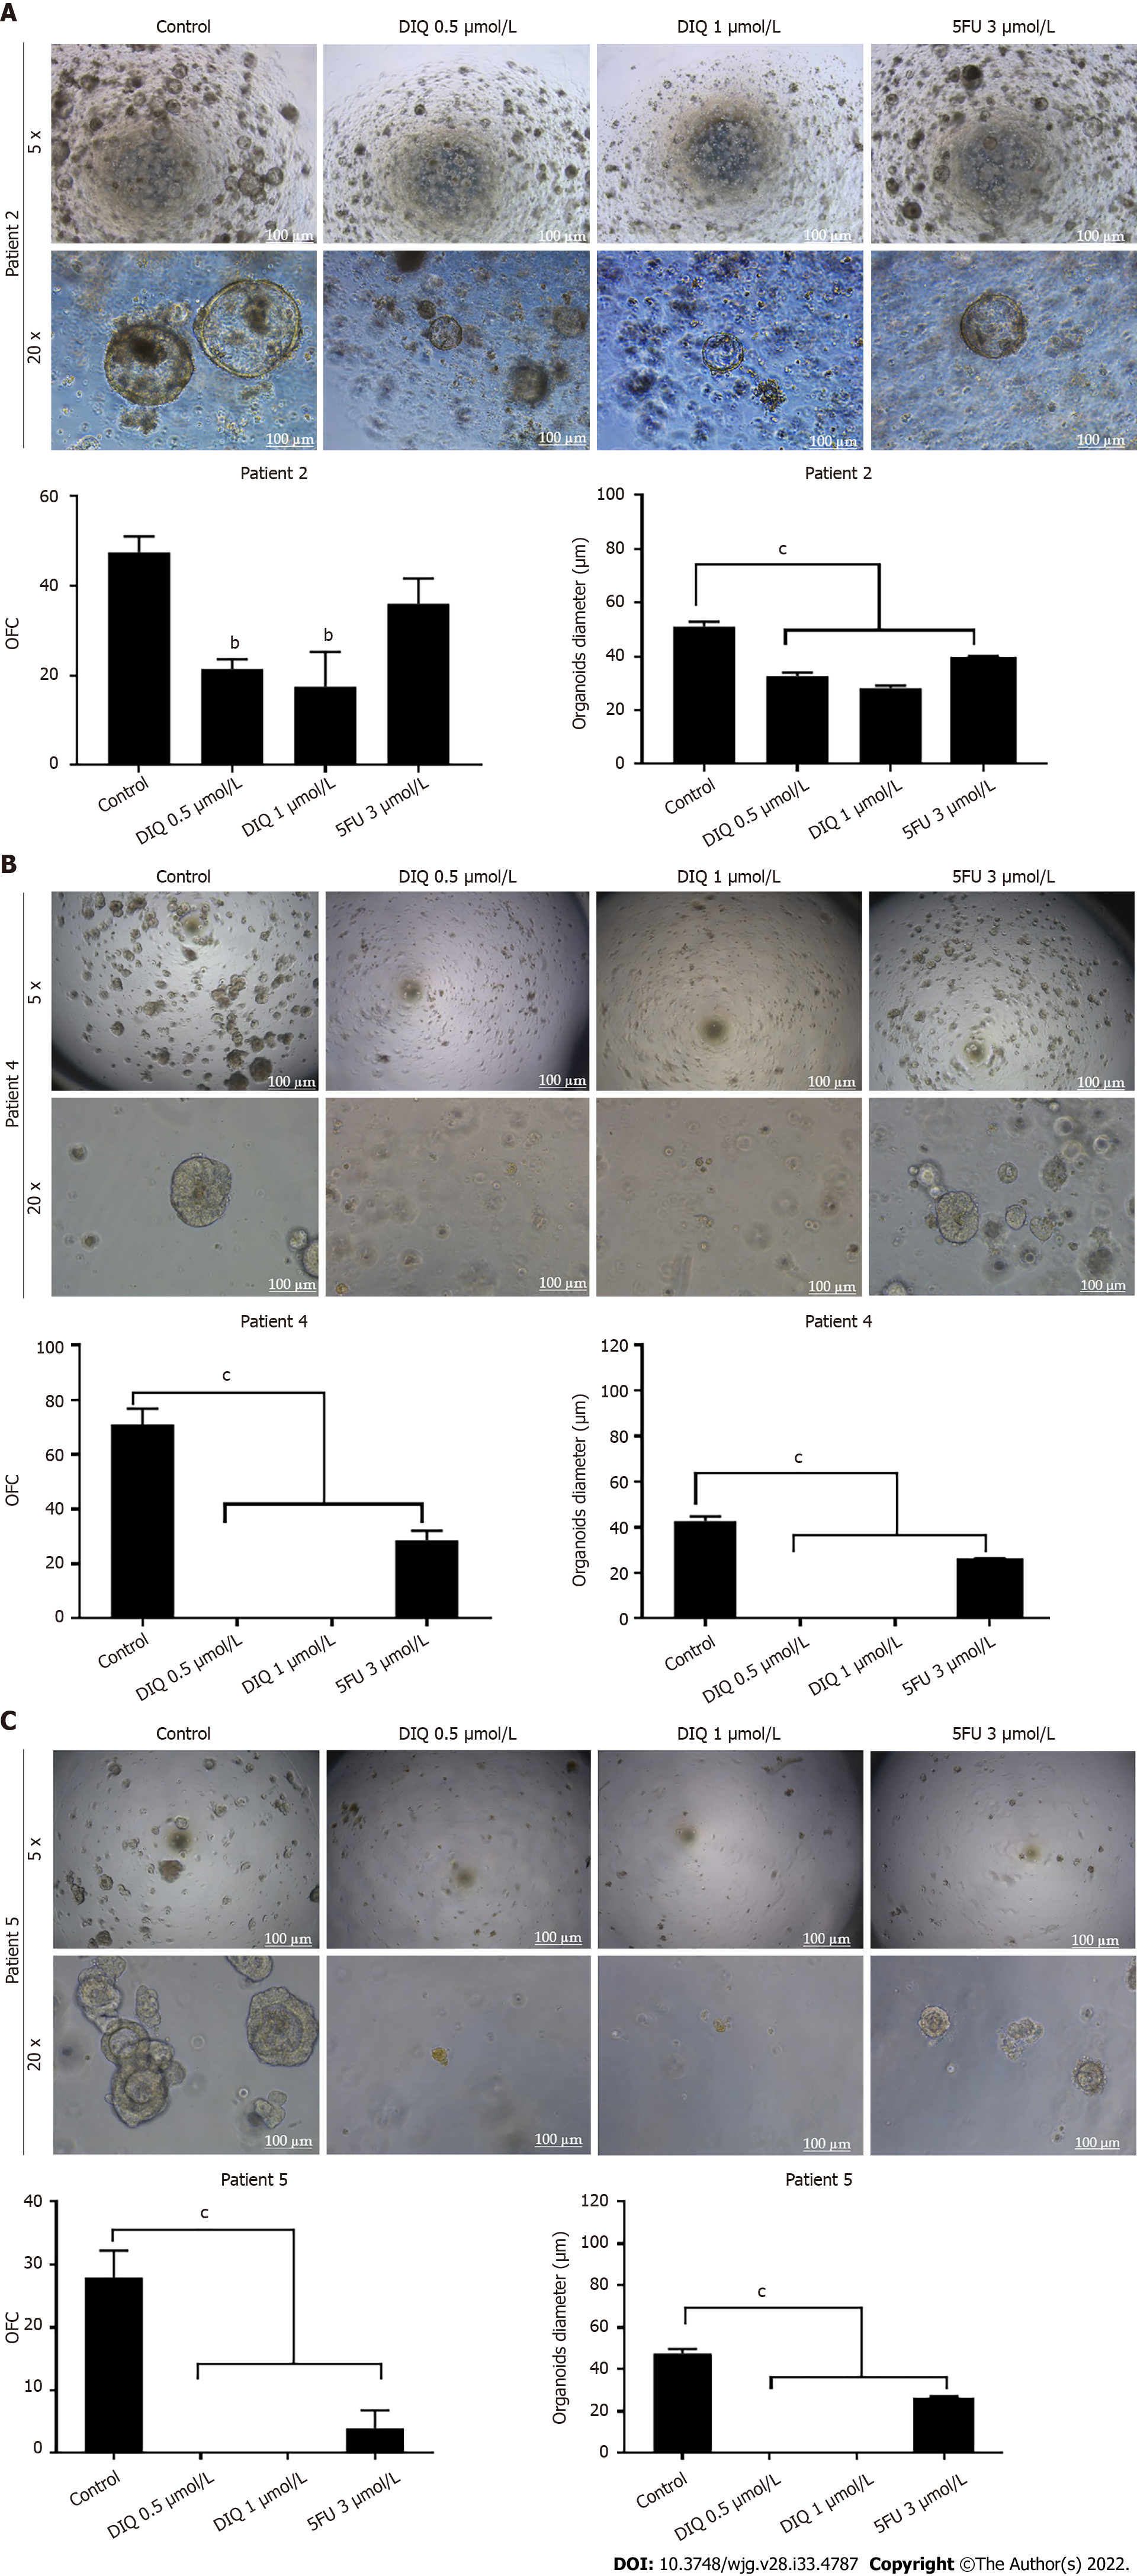
Figure 10 Diiminoquinone reduced the growth of the patient-derived organoids from different colon cancer patients.
A: Representative bright field images of generation (G)1 organoids derived from patient 2 (grade 2; stage T3) grown with or without diiminoquinone (DIQ) or 5-fluorouracil (5FU). Organoid formation count (OFC) was calculated in duplicate wells per condition. The quantification of the average diameter was calculated. The data of OFC and size are presented in two separate graphs; B: Representative bright field images of G4 organoids derived from patient 4 (grade 2; stage T2) grown with or without DIQ or 5FU. OFC was calculated in duplicate wells per condition. The quantification of the average diameter size was calculated. The data of OFC and size are presented in two separate graphs; C: Representative bright field images of G2 organoids derived from patient 5 (grade 2; stage T3) grown with or without DIQ or 5FU. OFC was calculated in duplicate wells per condition. The quantification of the average diameter was calculated. The average mean of OFC and size are presented in two separate graphs. All mean values were reported as mean ± standard error of the mean (aP < 0.05, bP < 0.01, cP < 0.001). Scale bar, 100 μm.
- Citation: Monzer A, Wakimian K, Ballout F, Al Bitar S, Yehya A, Kanso M, Saheb N, Tawil A, Doughan S, Hussein M, Mukherji D, Faraj W, Gali-Muhtasib H, Abou-Kheir W. Novel therapeutic diiminoquinone exhibits anticancer effects on human colorectal cancer cells in two-dimensional and three-dimensional in vitro models. World J Gastroenterol 2022; 28(33): 4787-4811
- URL: https://www.wjgnet.com/1007-9327/full/v28/i33/4787.htm
- DOI: https://dx.doi.org/10.3748/wjg.v28.i33.4787


