Copyright
©The Author(s) 2022.
World J Gastroenterol. Aug 28, 2022; 28(32): 4726-4740
Published online Aug 28, 2022. doi: 10.3748/wjg.v28.i32.4726
Published online Aug 28, 2022. doi: 10.3748/wjg.v28.i32.4726
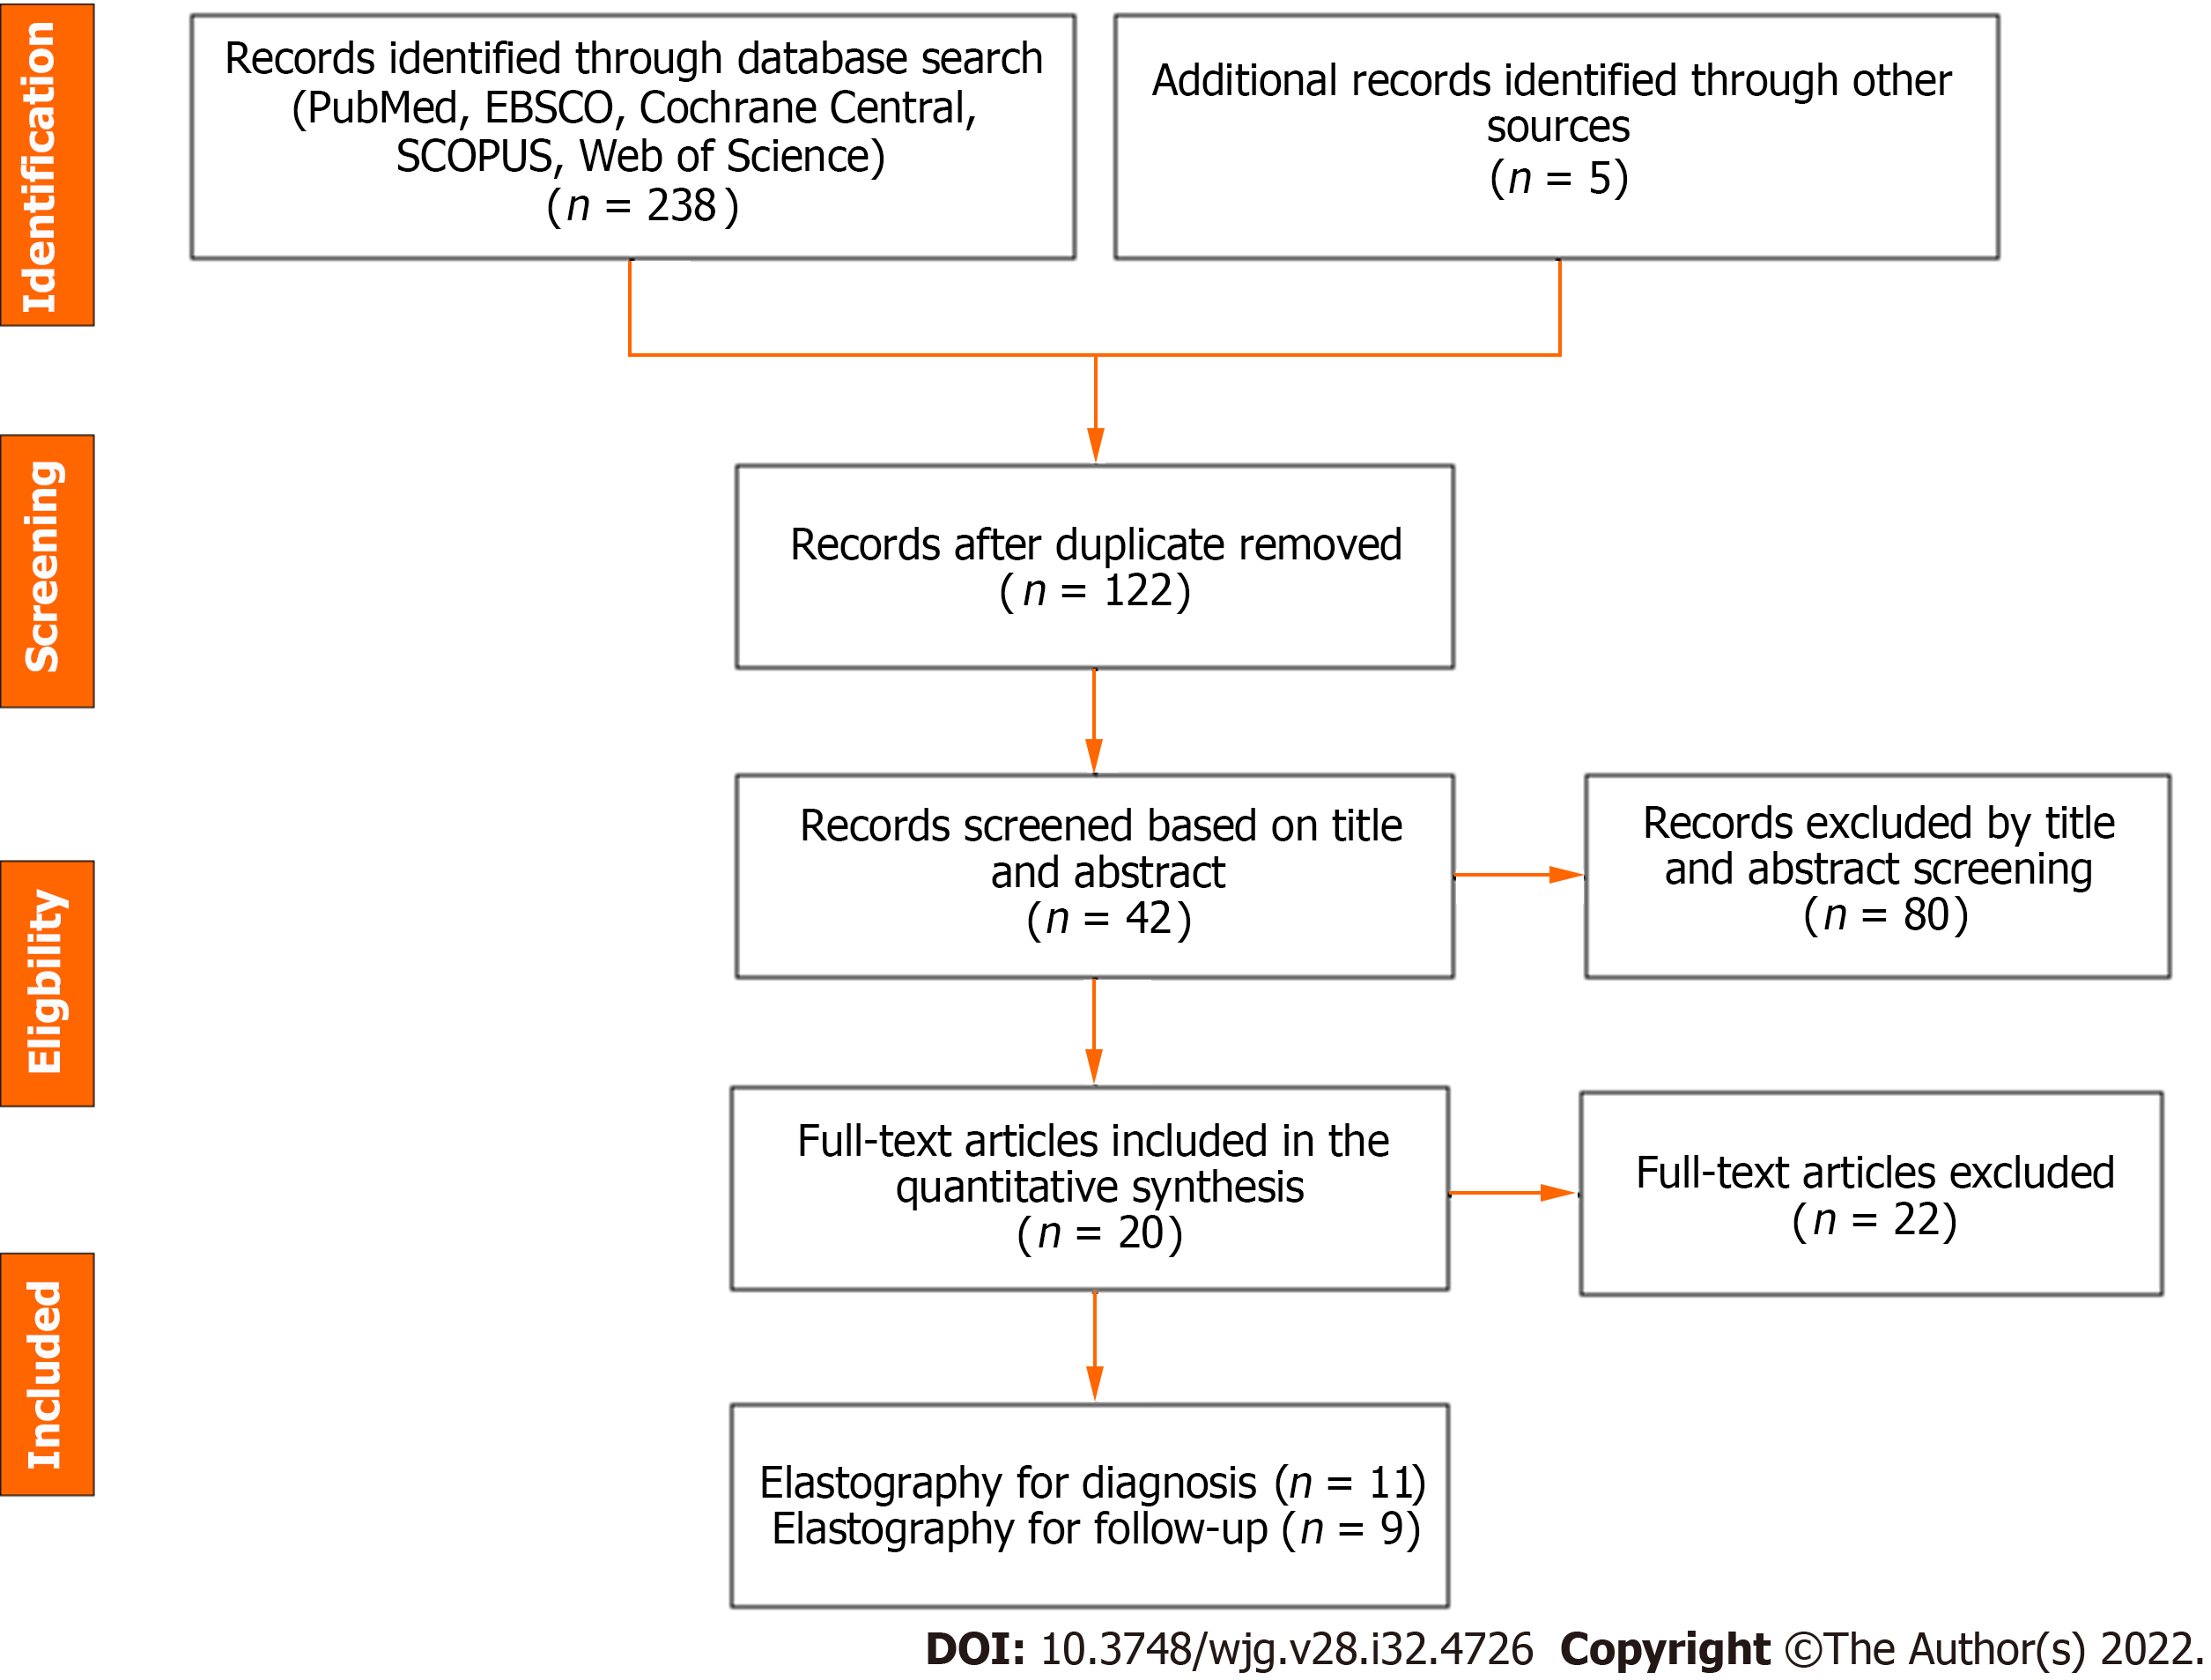
Figure 1 Preferred Reporting Items for Systematic Review and Meta-Analysis flow diagram of the meta-analysis.
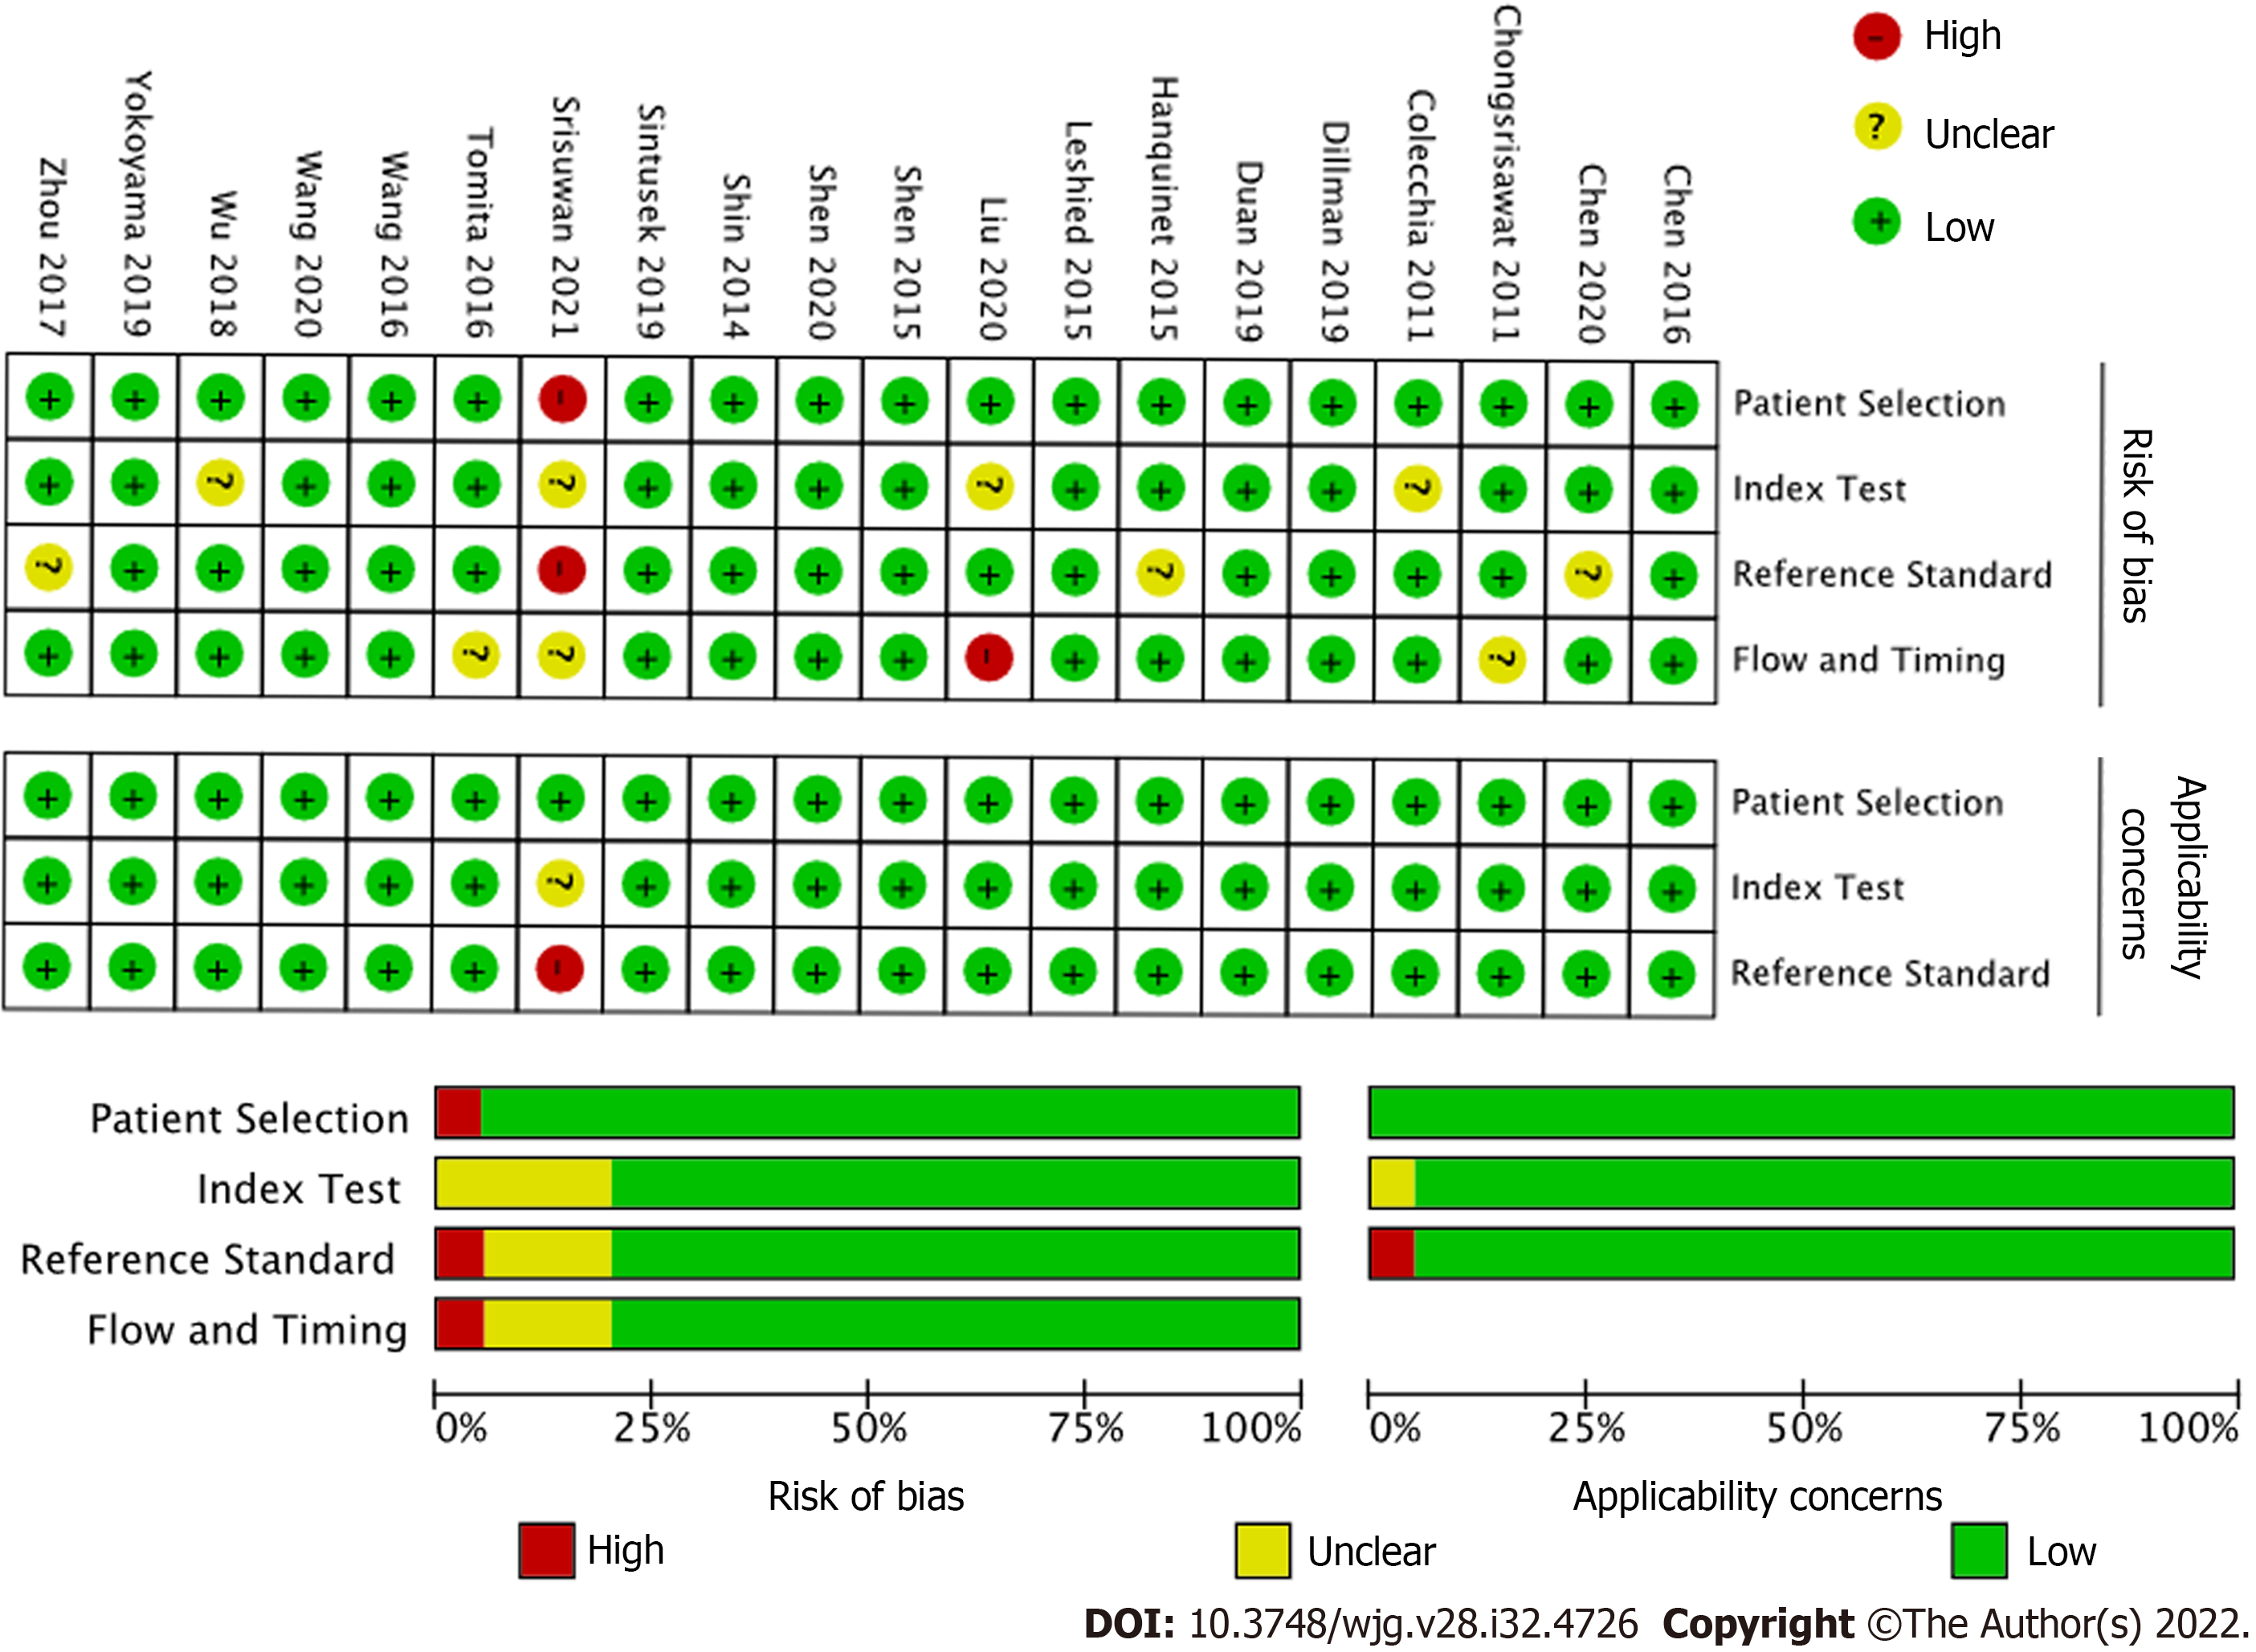
Figure 2 Quality assessment by Quality Assessment of Diagnostic Test Accuracy Studies (QUADAS-2) of the included studies.
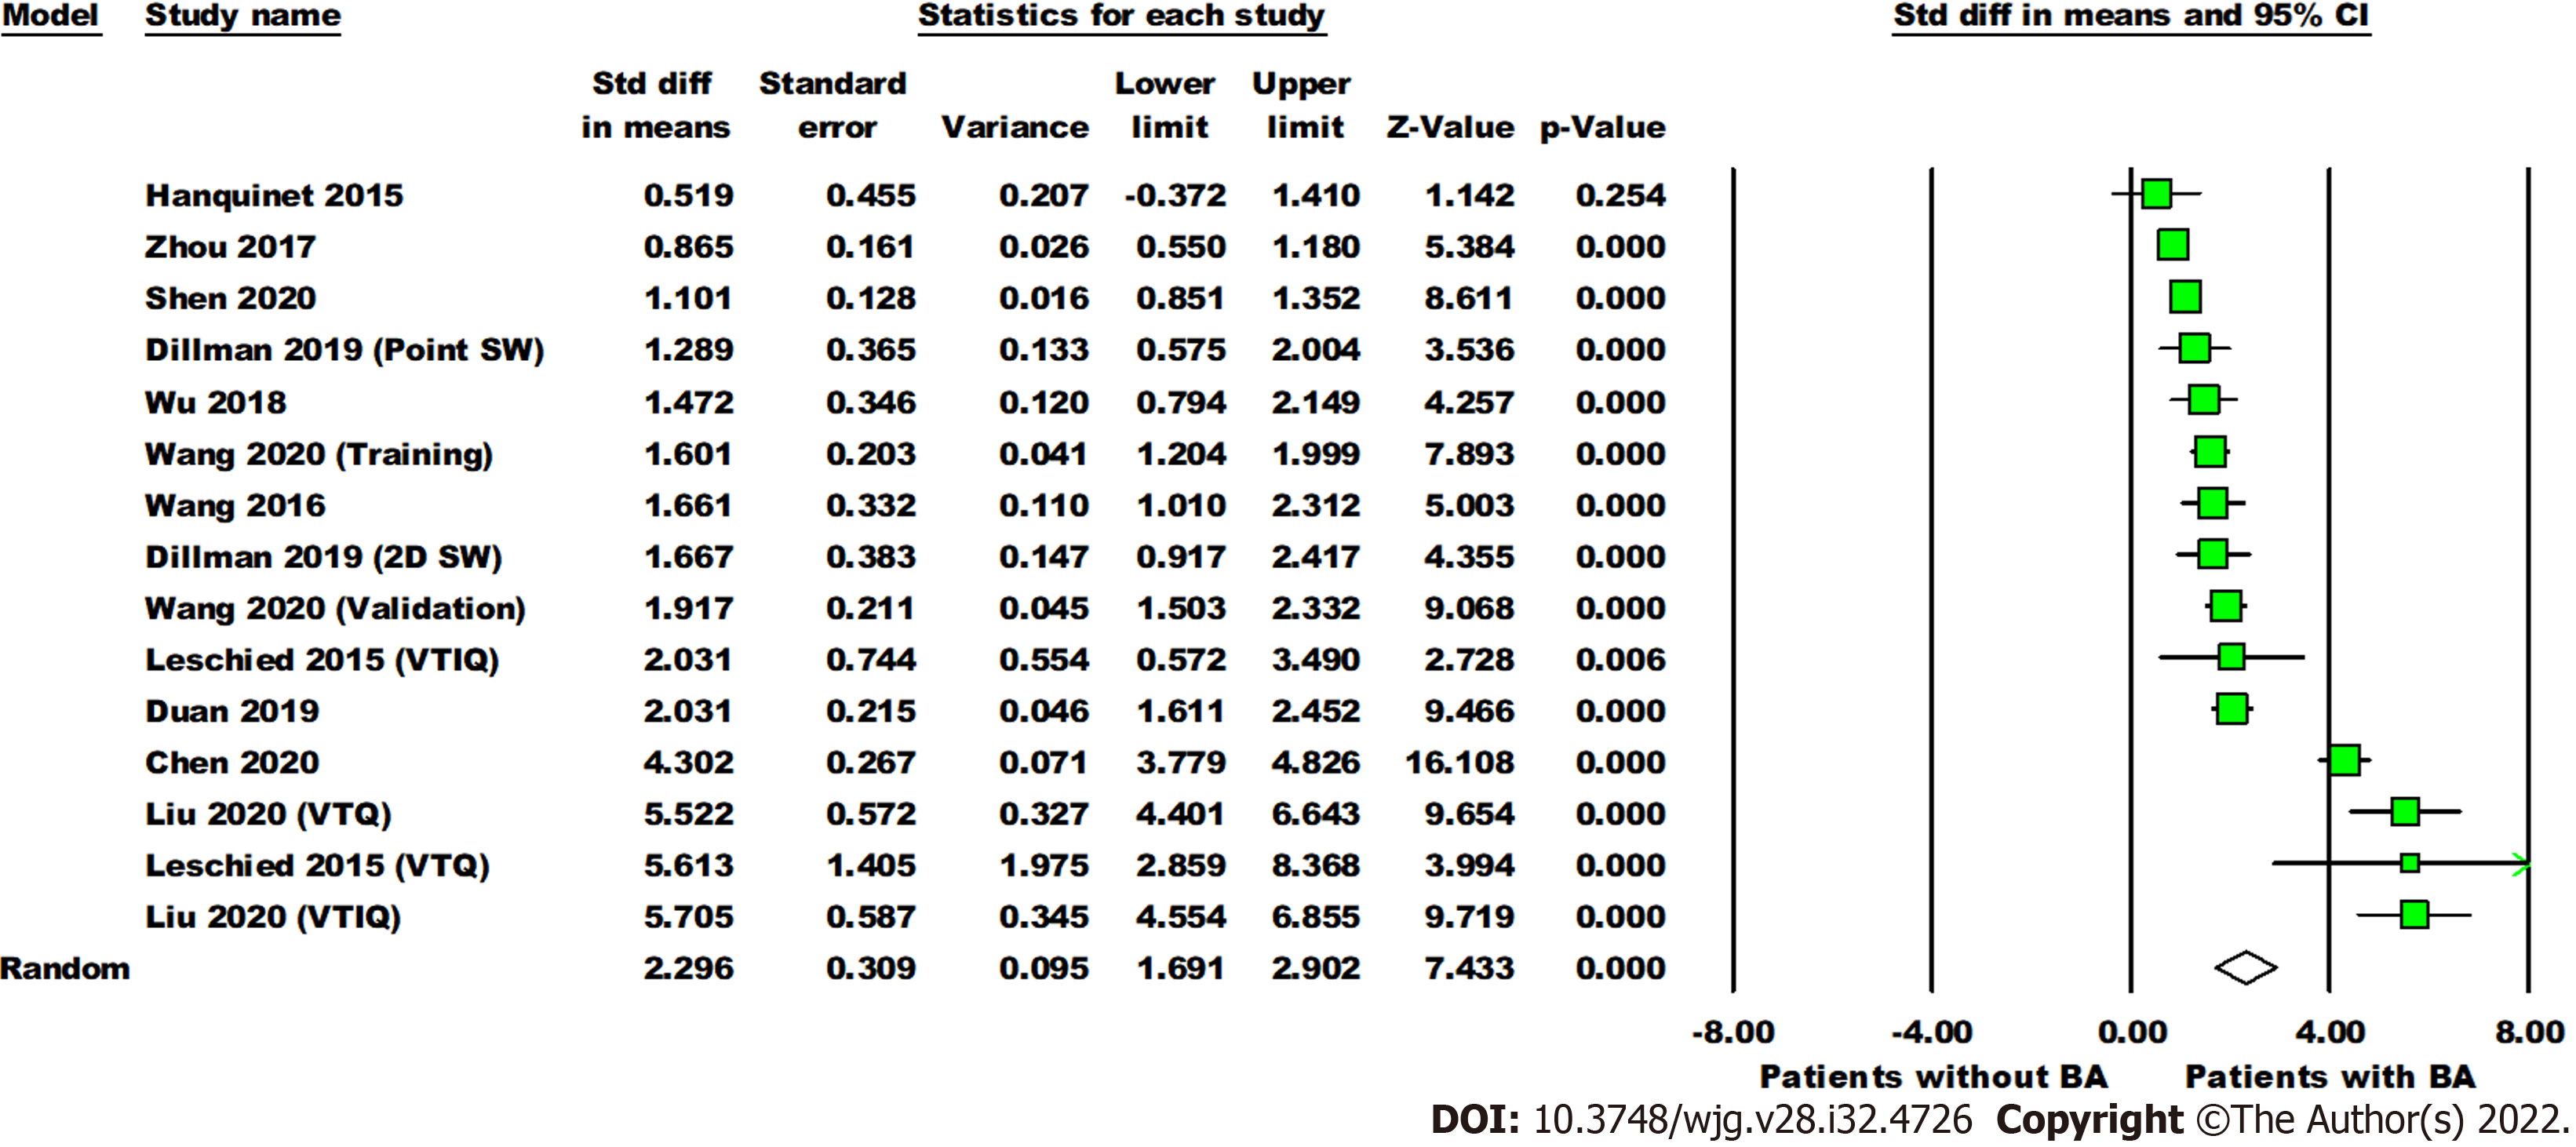
Figure 3 Forest plot comparing the liver stiffness value (Kpa) between the patients with and without biliary atresia.
Dillman, Wang (2020), Leschied, and Liu each have multiple analyses due to different shear wave elastography modes and/or phases of study (training, validation). Point SW: Point shear wave elastography; 2D SW: Two-dimensional shear wave elastography; VTIQ: Virtual touch IQ, alternative nomenclature for two-dimensional shear wave elastography; VTQ: Virtual touch quantification, alternative nomenclature for point shear wave elastography.
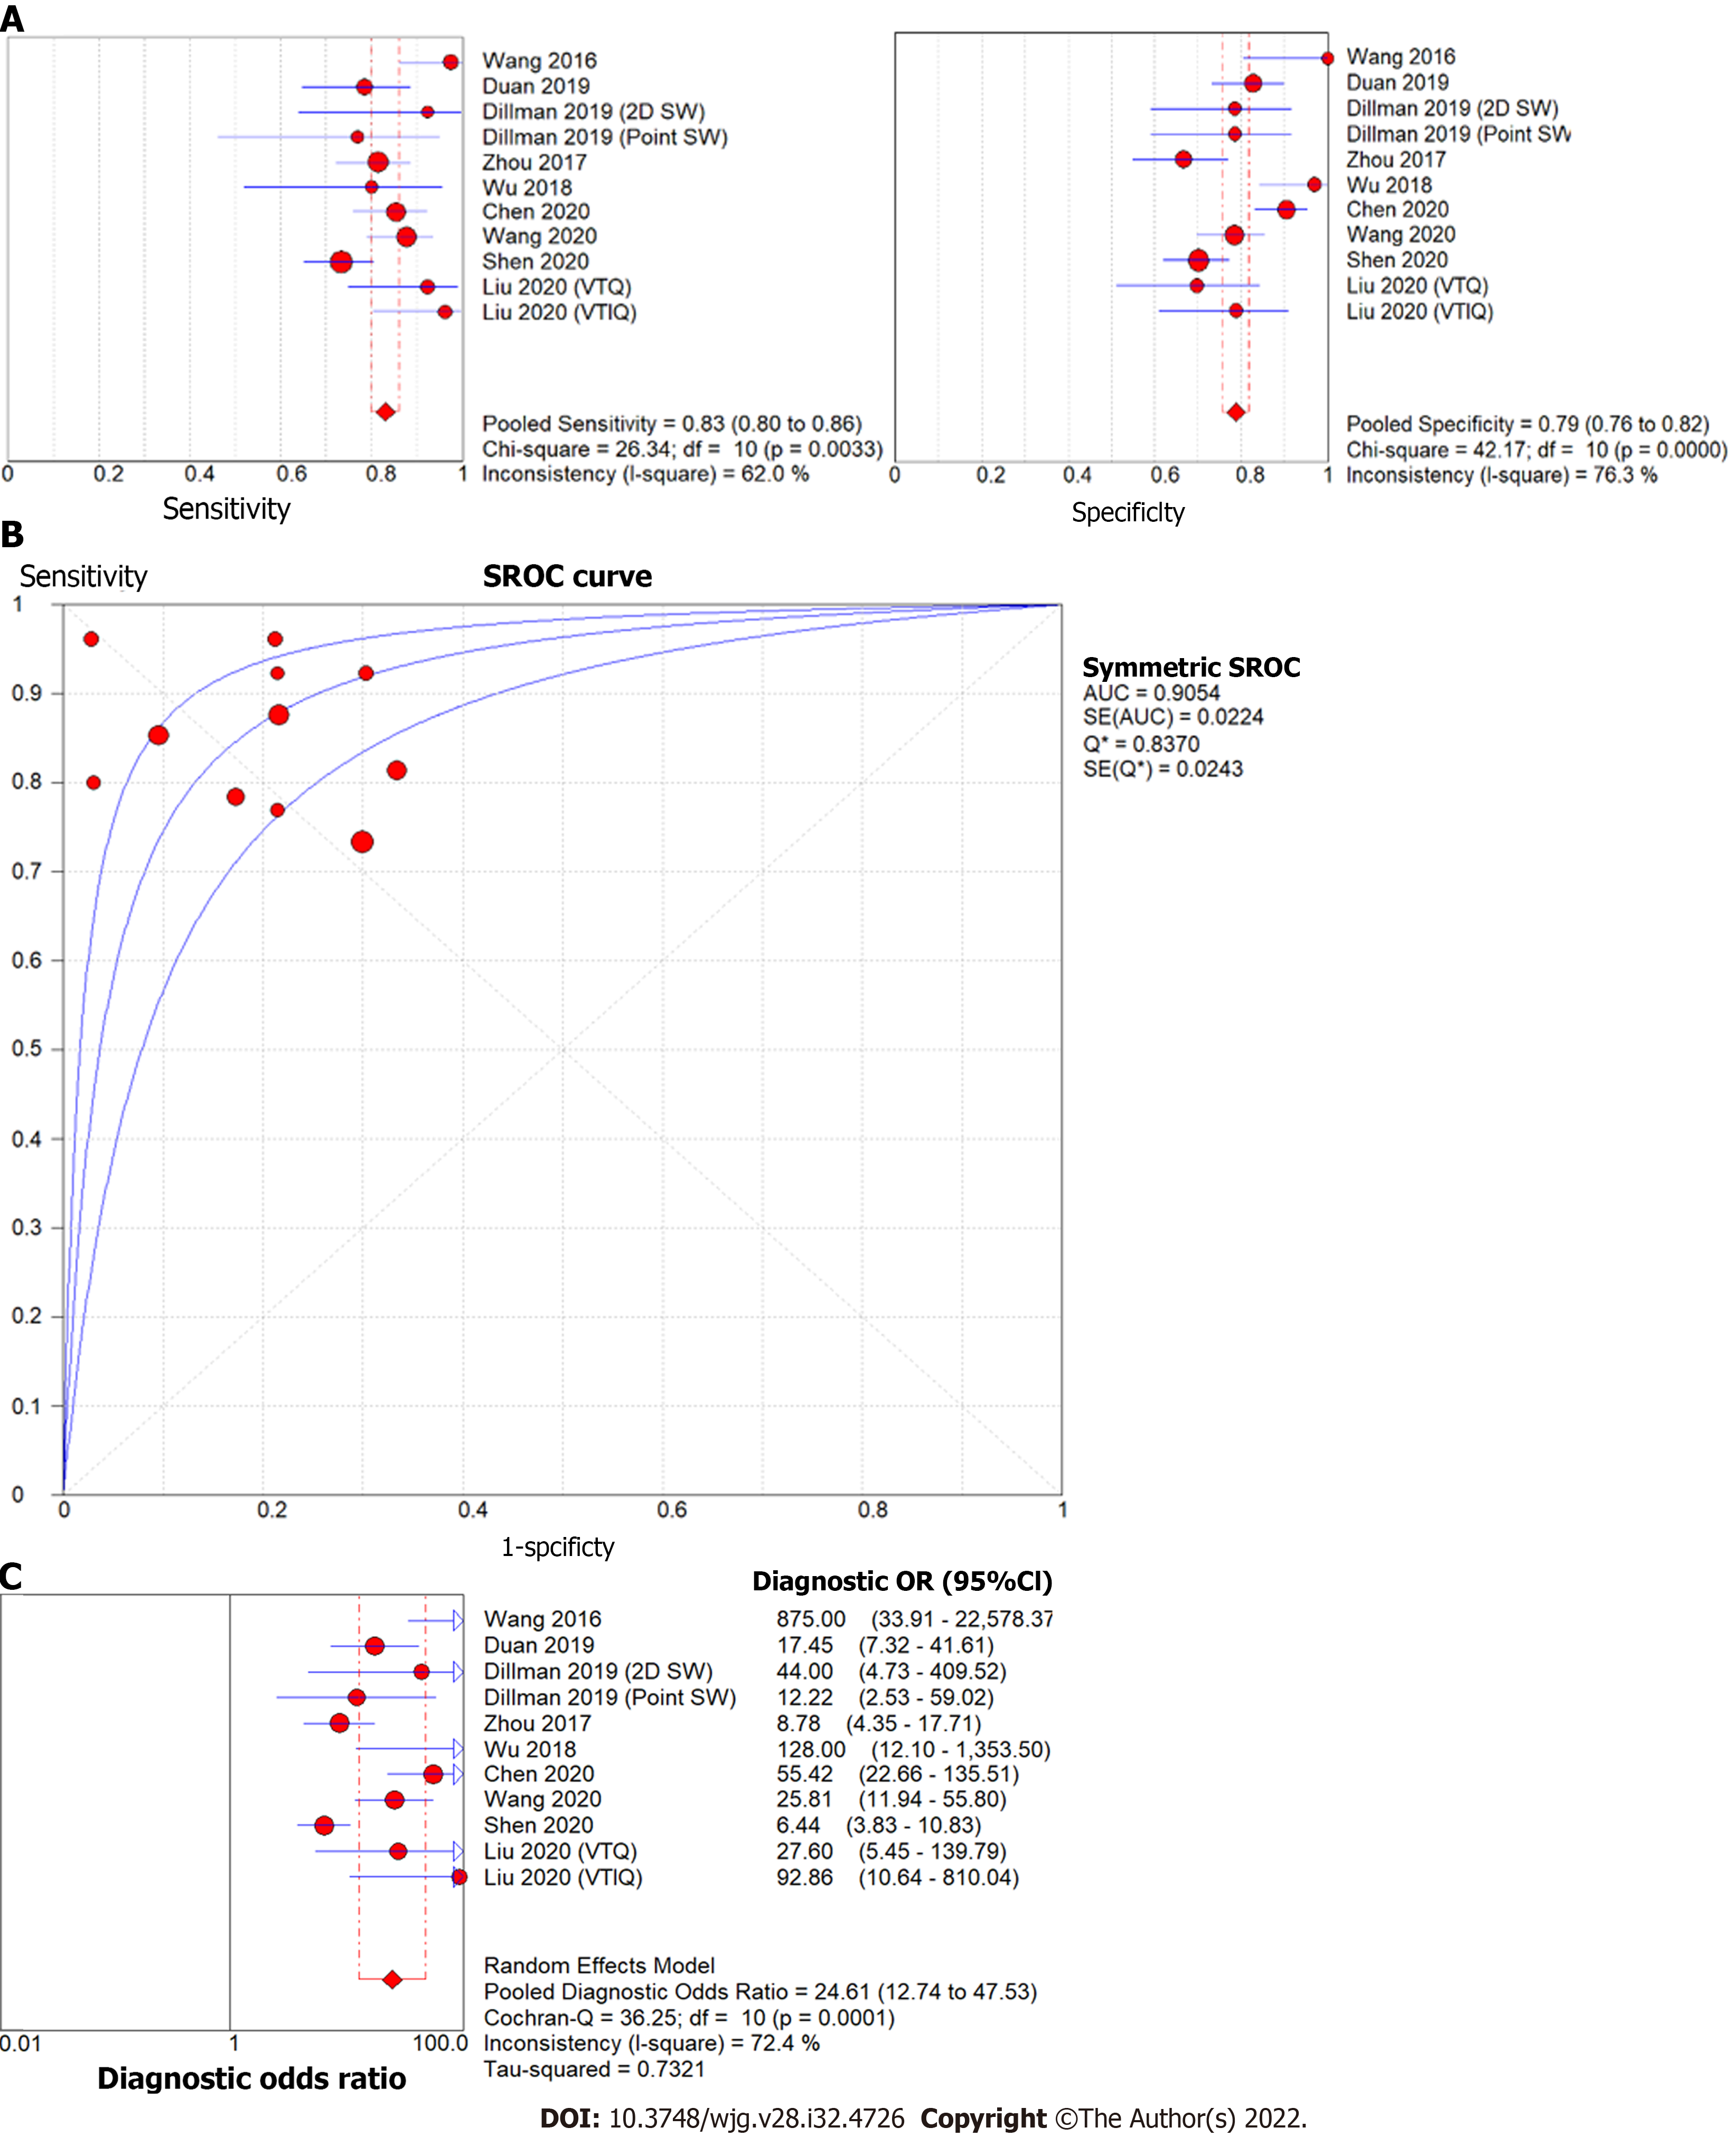
Figure 4 Forest plot of liver stiffness value measured by shear wave elastography to differentiate biliary atresia from other neonatal cholestasis.
A: Diagnostic sensitivity and specificity; B: Summary receiver operating characteristic curve; C: Diagnostic odds ratio. Point SW: Point shear wave elastography; 2D SW: Two-dimensional shear wave elastography; VTIQ: Virtual touch IQ, alternative nomenclature for two-dimensional shear wave elastography; VTQ: Virtual touch quantification, alternative nomenclature for point shear wave elastography.
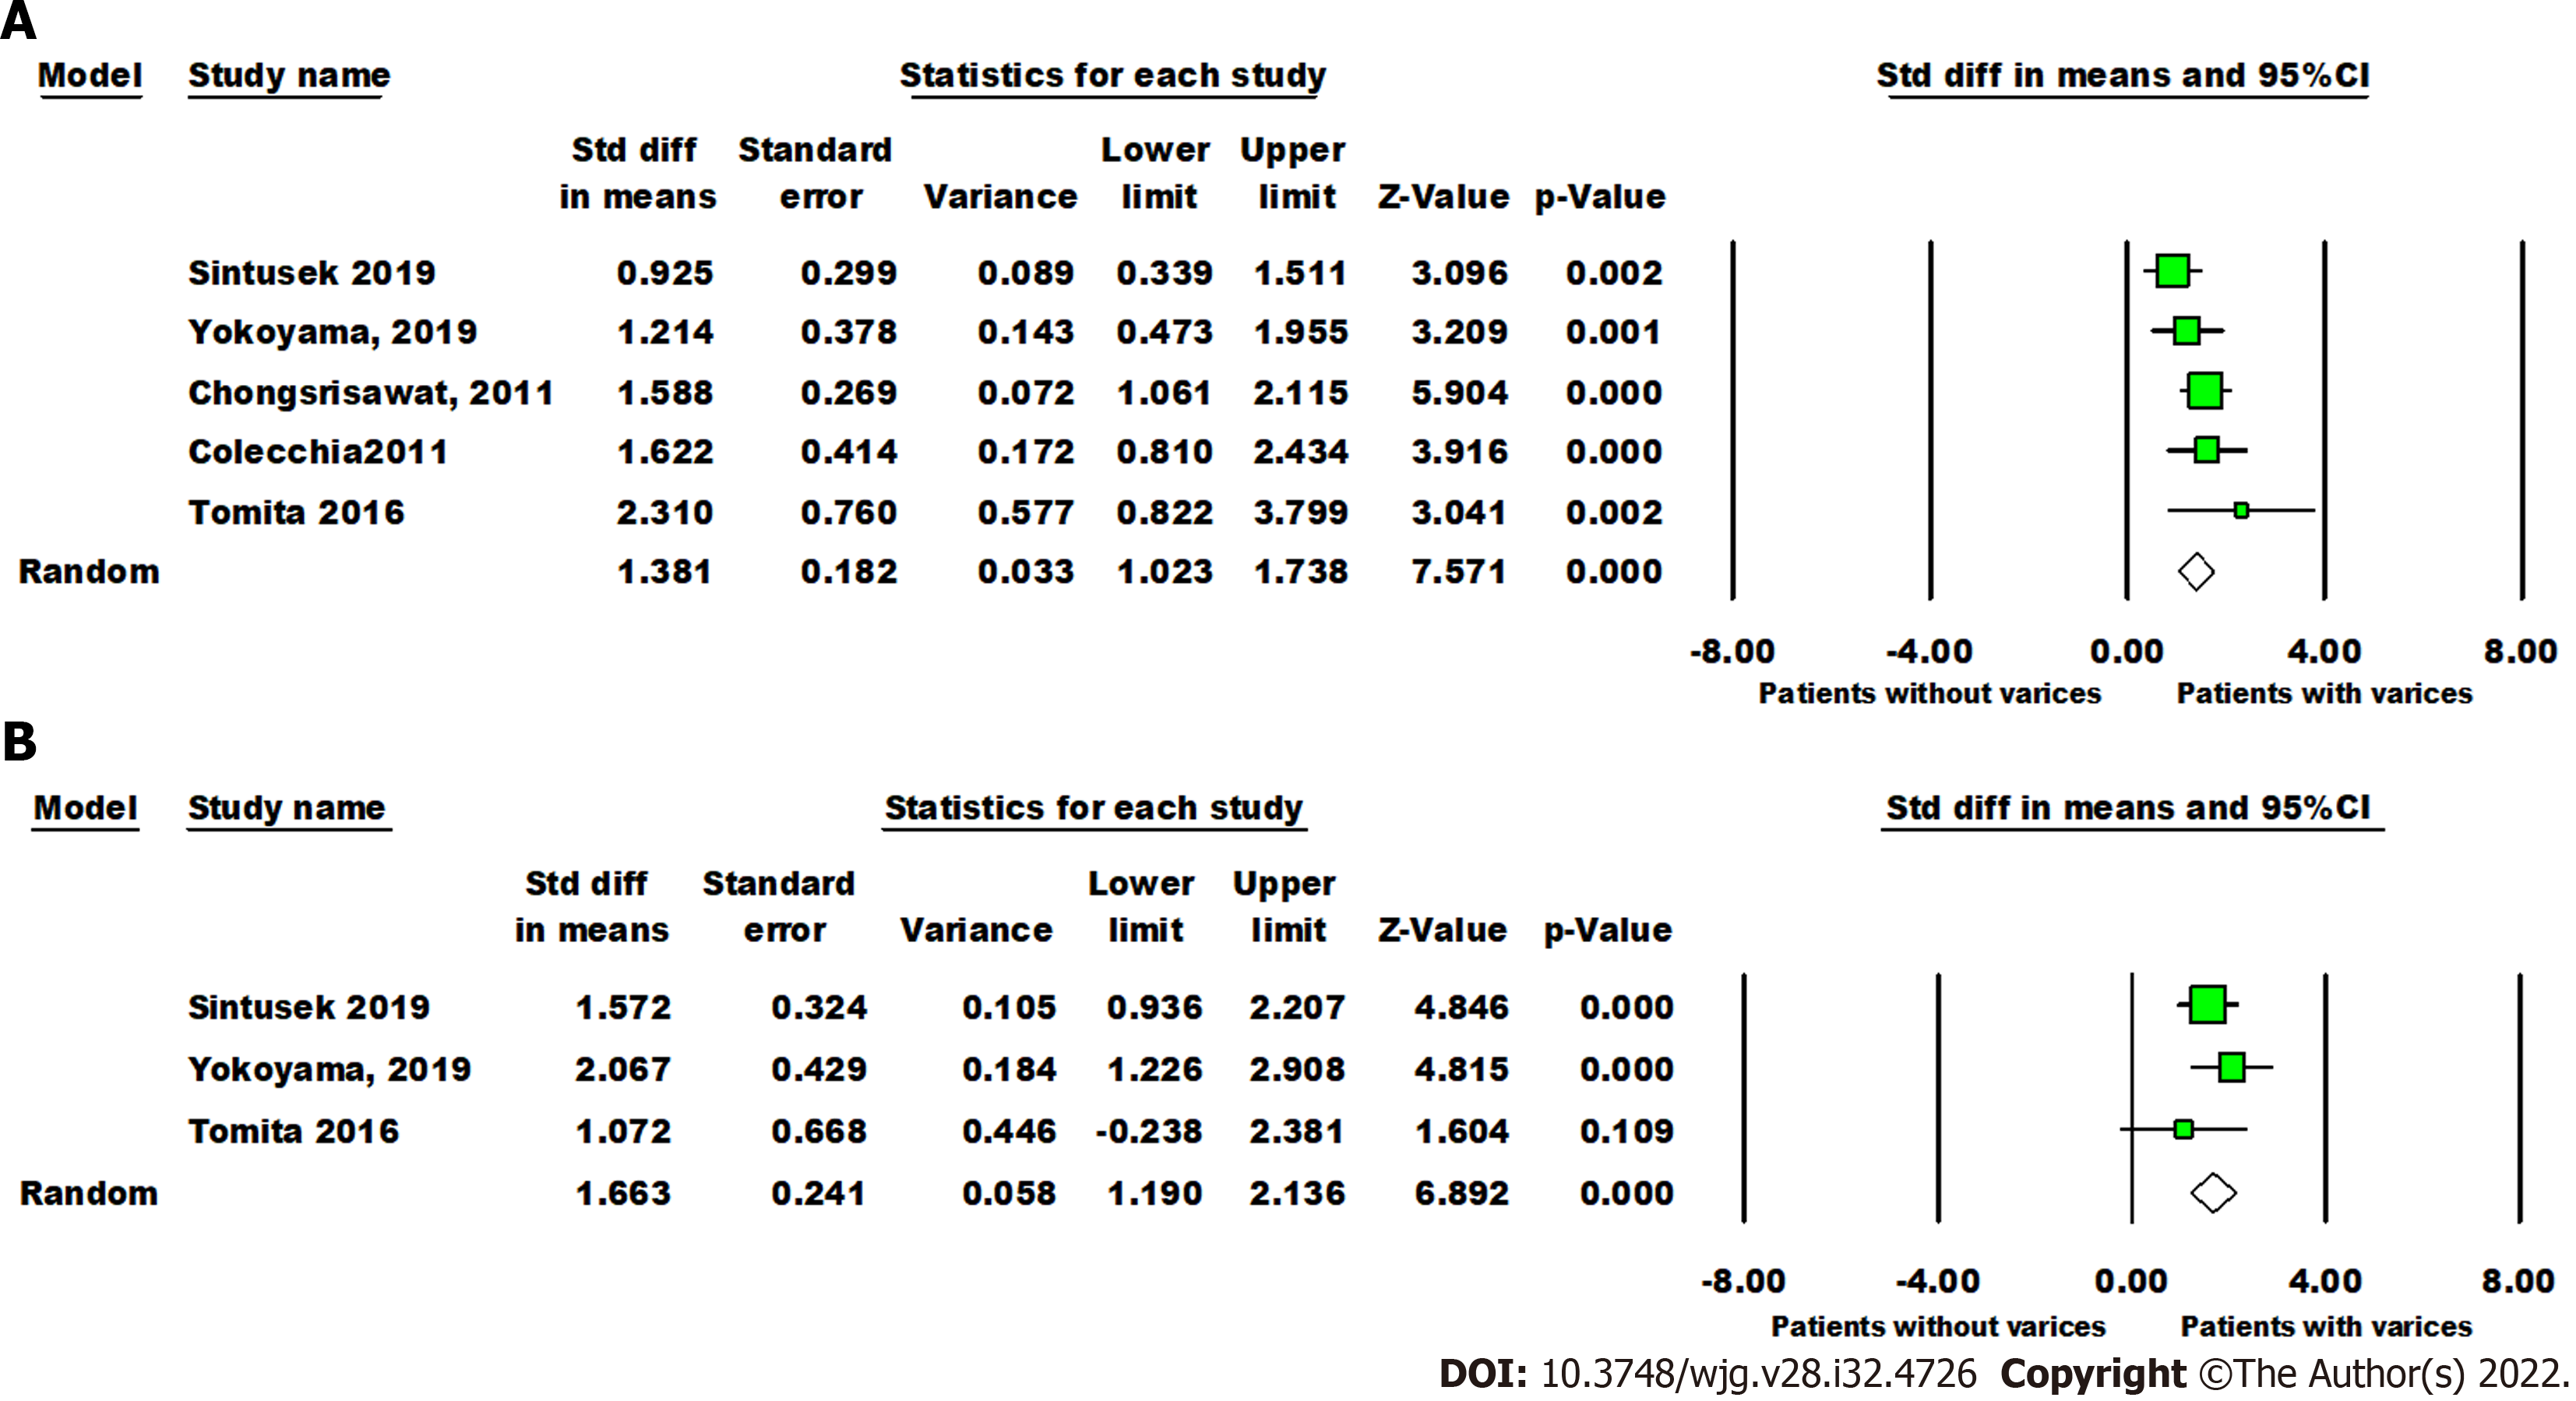
Figure 5 Forest plot comparing liver and spleen stiffness value between post-Kasai patients with or without varices.
A: The liver stiffness value (Kpa); B: Spleen stiffness value (Kpa).
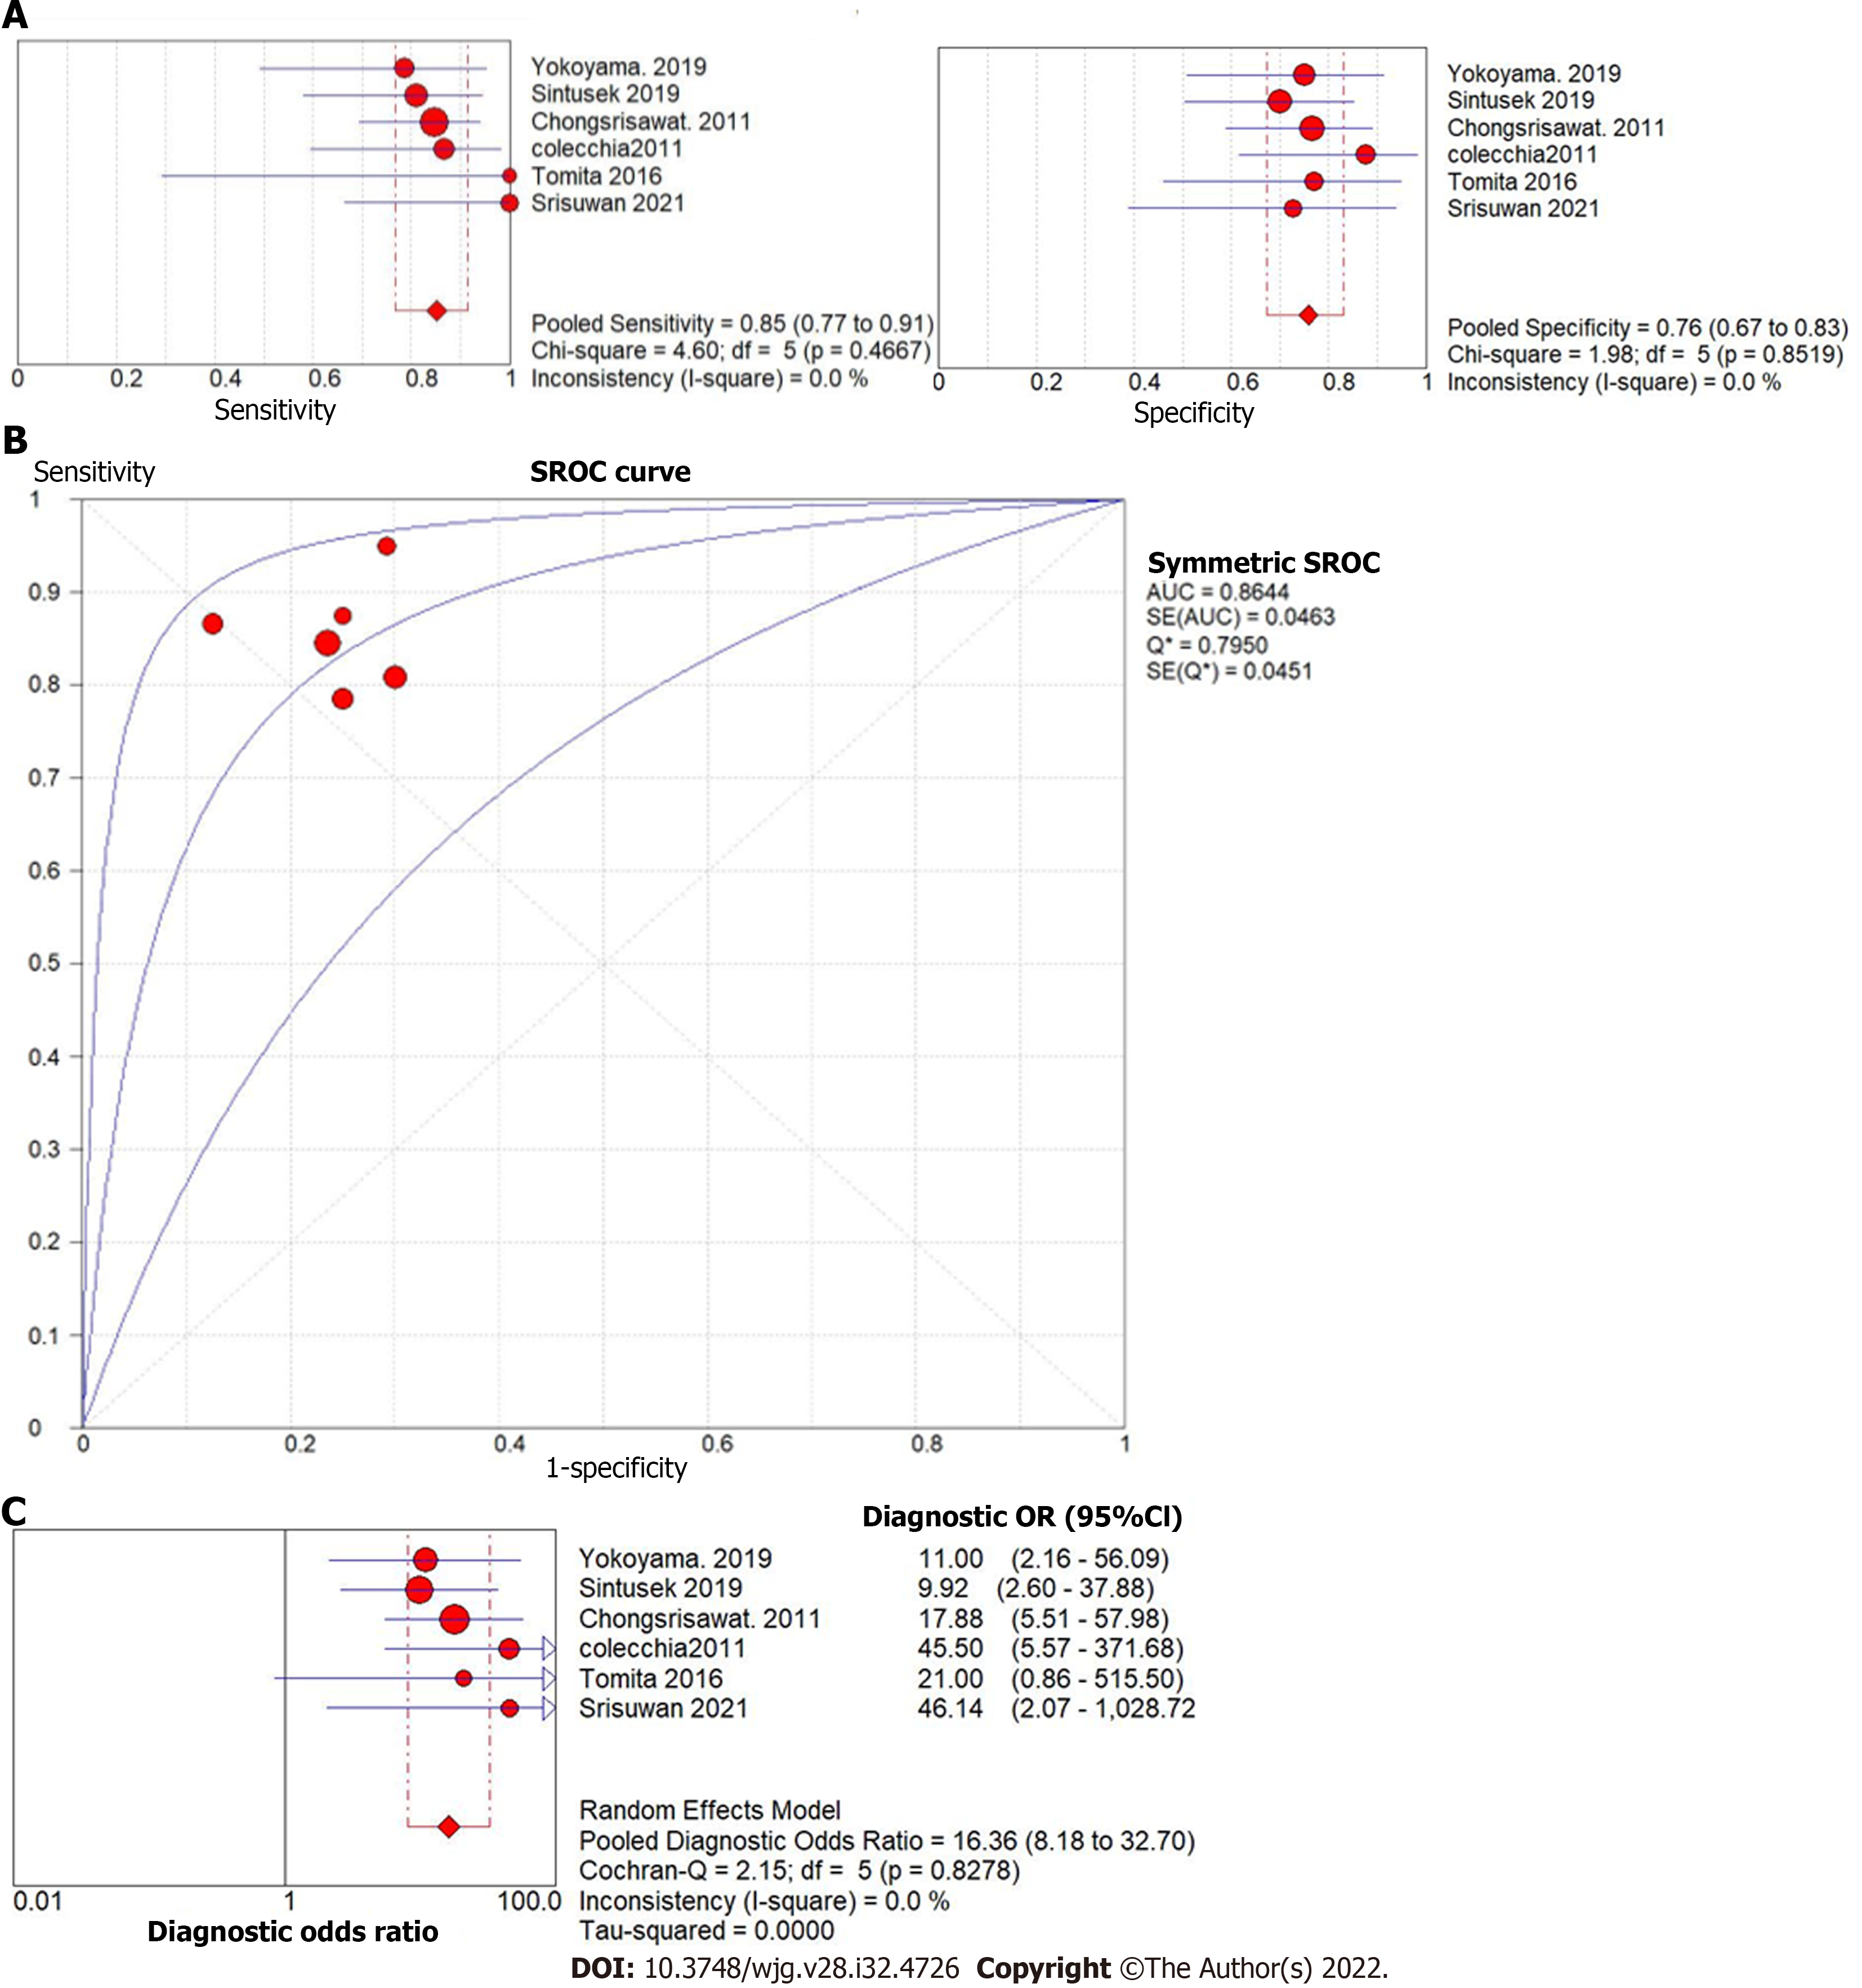
Figure 6 Forest plot of liver stiffness value measured by shear wave elastography to predict the presence of varices in post-Kasai patients.
A: Diagnostic sensitivity and specificity; B: Summary receiver operating characteristic curve; C: Diagnostic odds ratio.
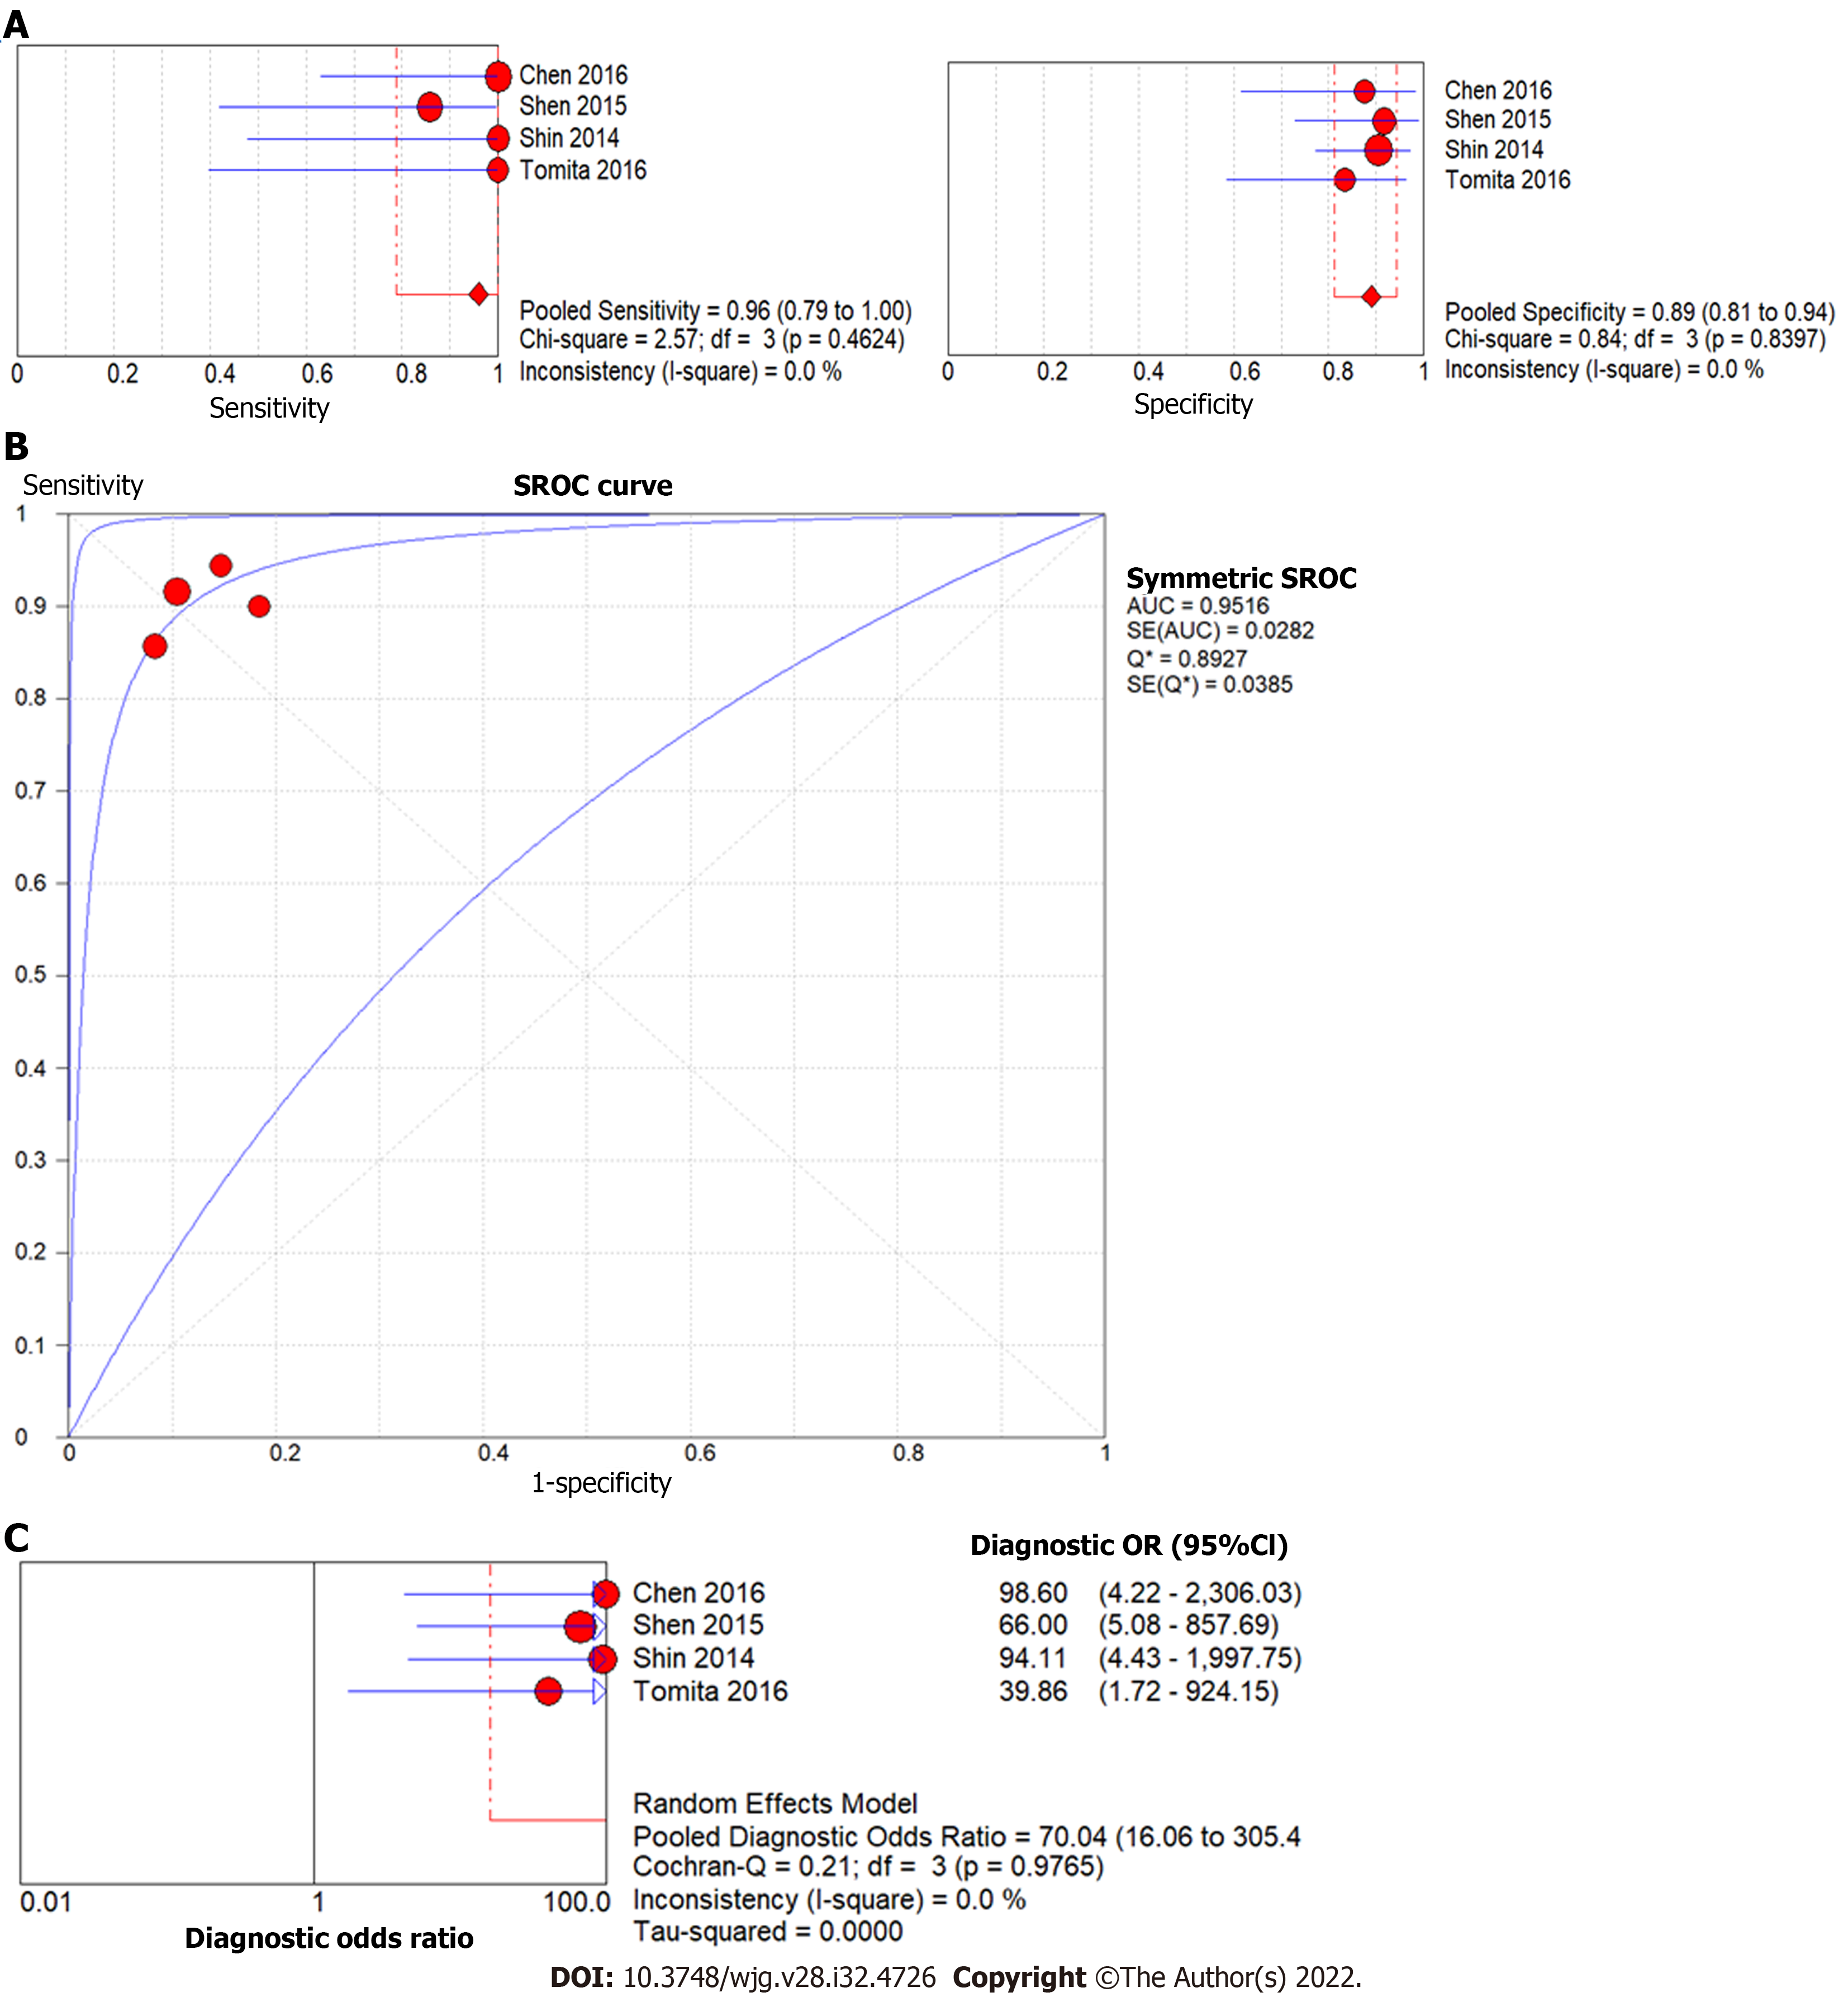
Figure 7 Forest plot of liver stiffness value measured by shear wave elastography to predict the presence of liver fibrosis F4 (vs F0-3) in post-Kasai patients.
A: Diagnostic sensitivity and specificity; B: Summary receiver operating characteristic curve; C: Diagnostic odds ratio.
- Citation: Wagner ES, Abdelgawad HAH, Landry M, Asfour B, Slidell MB, Azzam R. Use of shear wave elastography for the diagnosis and follow-up of biliary atresia: A meta-analysis. World J Gastroenterol 2022; 28(32): 4726-4740
- URL: https://www.wjgnet.com/1007-9327/full/v28/i32/4726.htm
- DOI: https://dx.doi.org/10.3748/wjg.v28.i32.4726


