Copyright
©The Author(s) 2022.
World J Gastroenterol. Aug 21, 2022; 28(31): 4399-4416
Published online Aug 21, 2022. doi: 10.3748/wjg.v28.i31.4399
Published online Aug 21, 2022. doi: 10.3748/wjg.v28.i31.4399
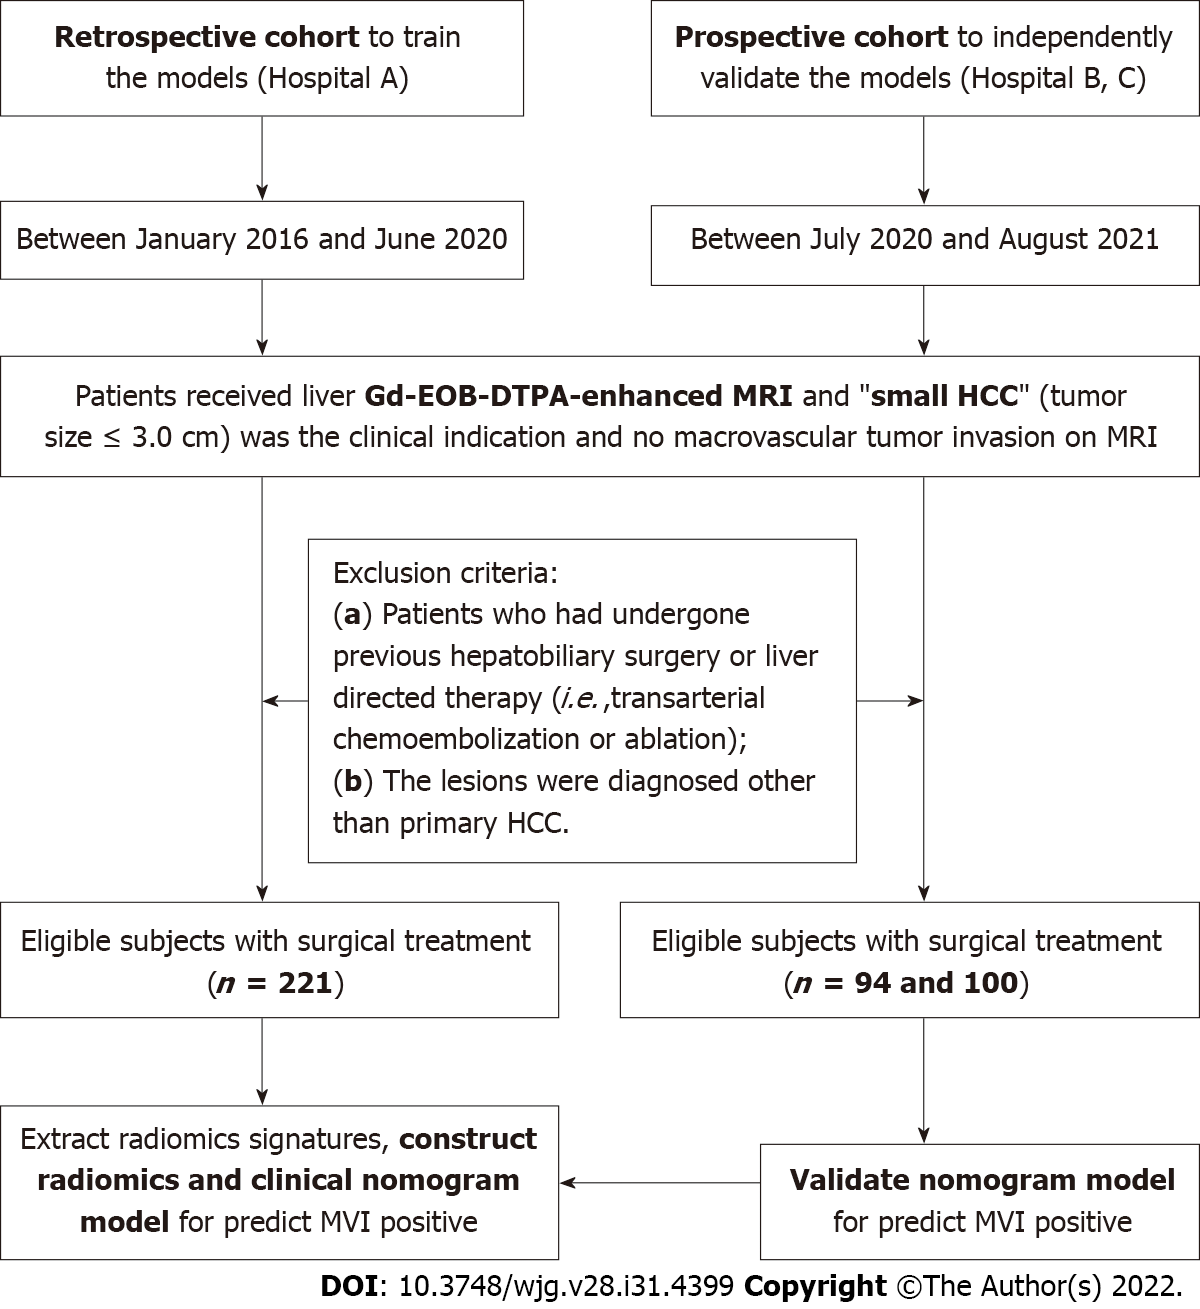
Figure 1 Flow diagram of the study cohort.
A total of 415 participants were included in this multi-center study.
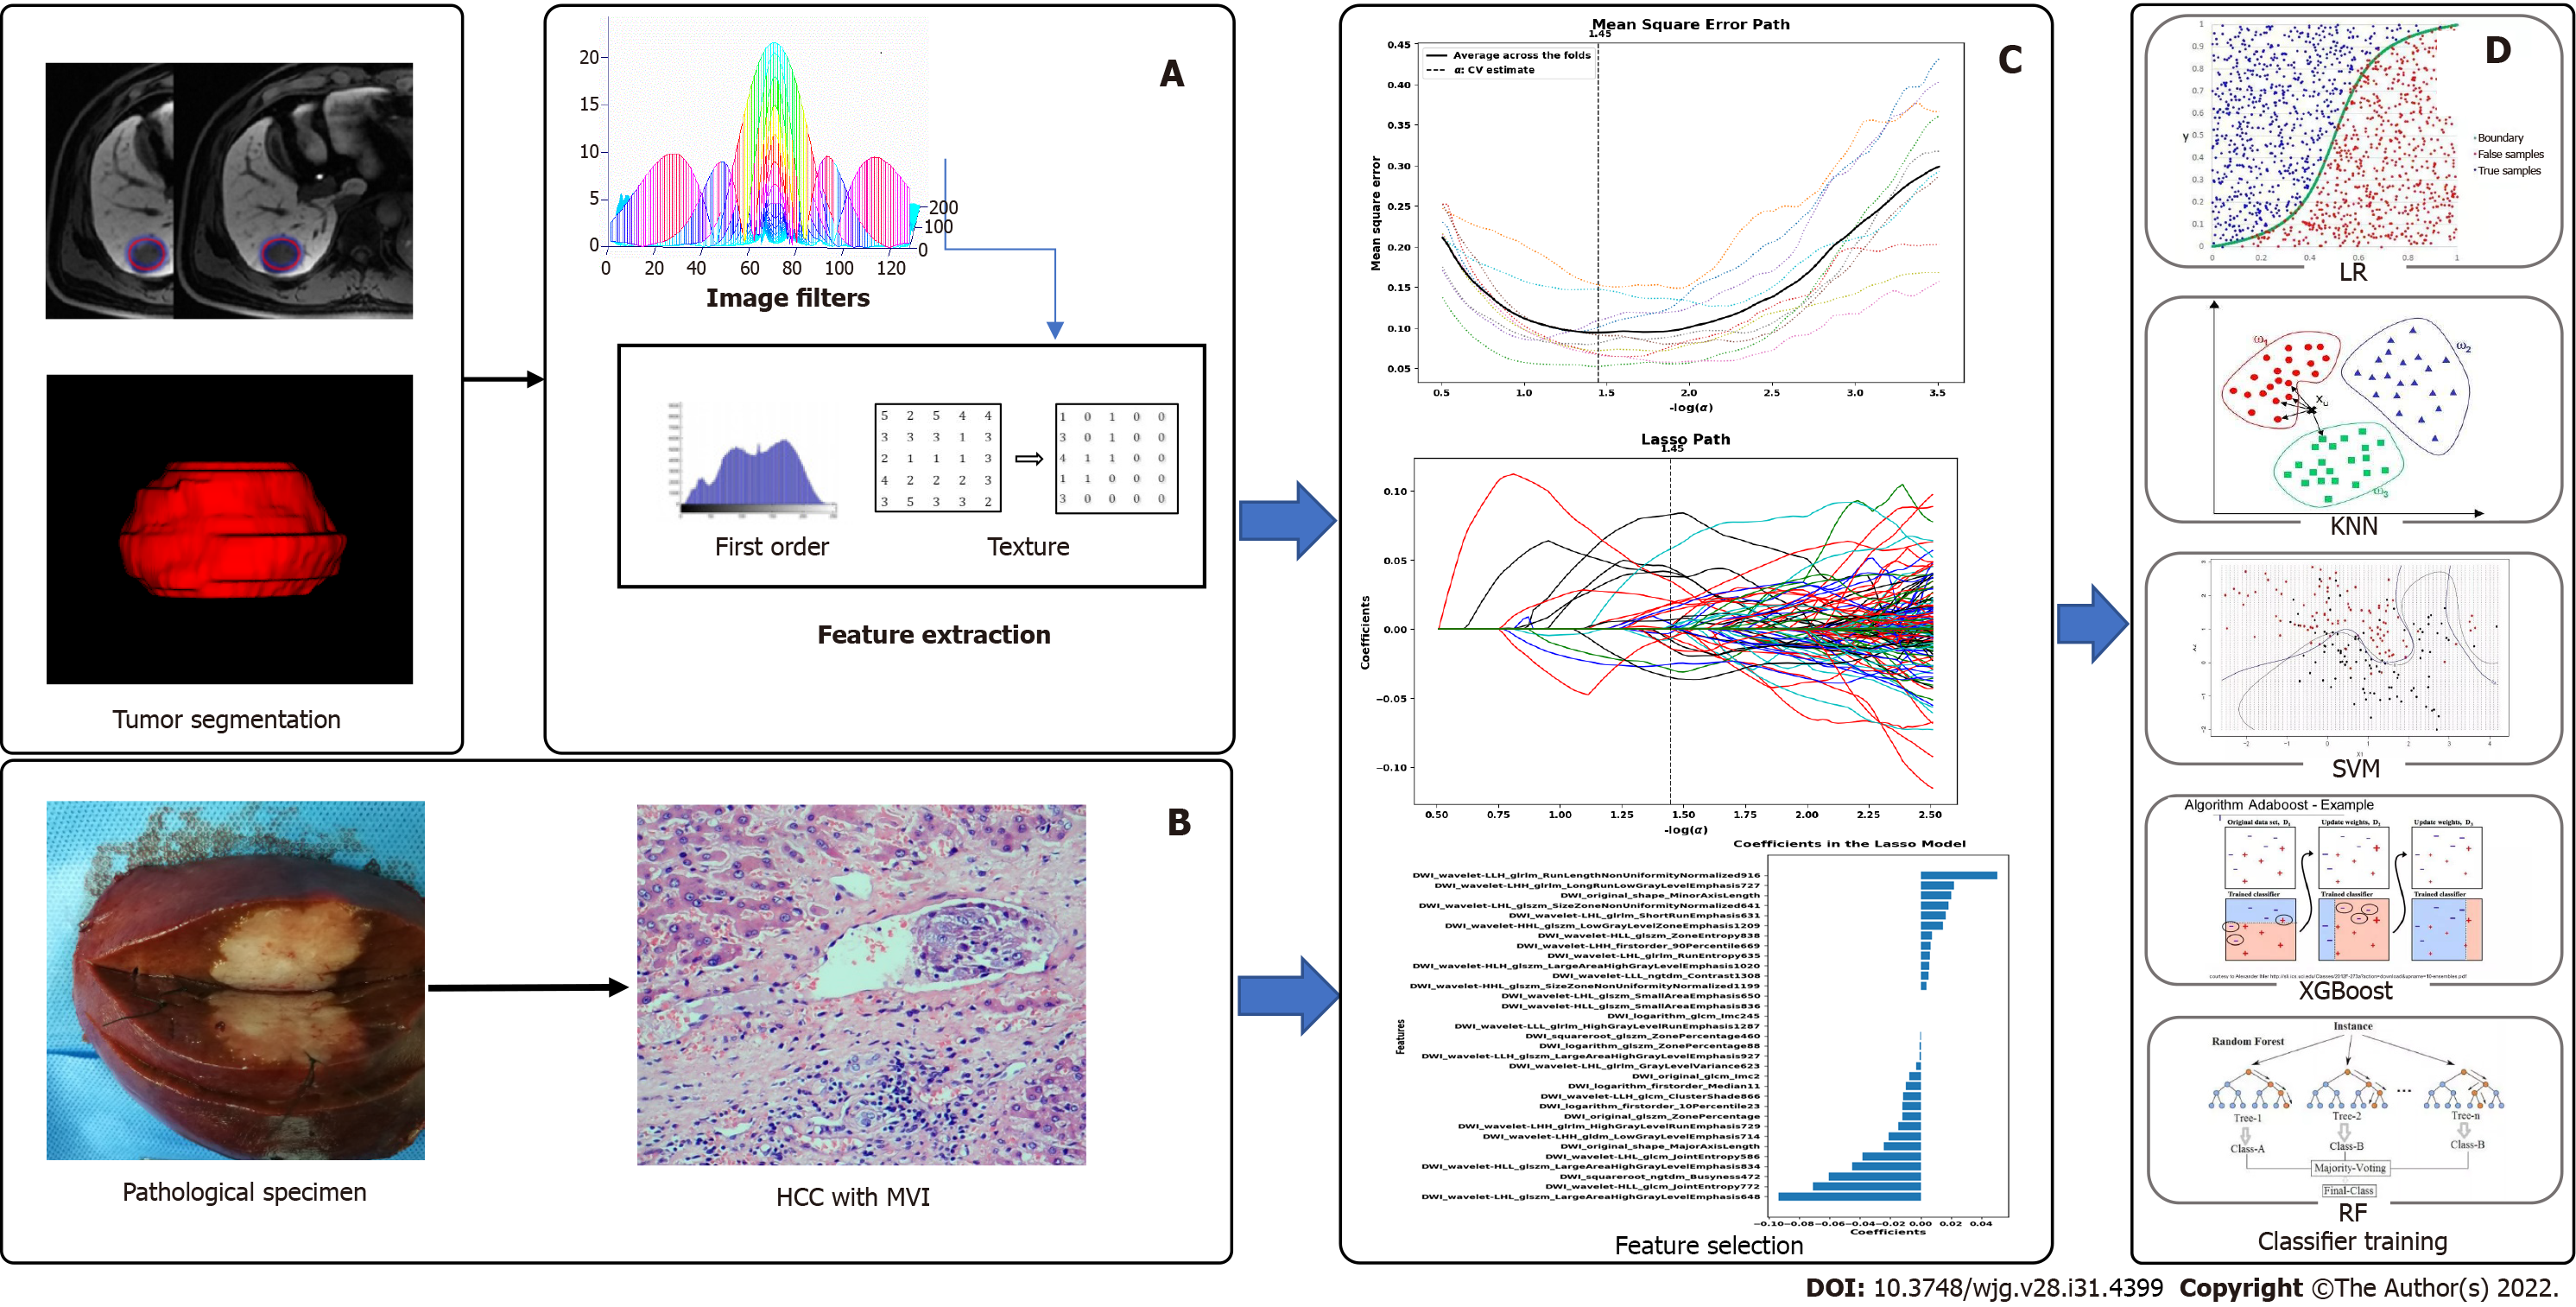
Figure 2 Flow diagram for the radiomics of machine learning.
A: Construct radiomics models, the volume of interest was delineated by experienced radiologists and three-dimensional images were formed, extracting quantitative features by software; B: Pathologic examination, firstly obtaining specimens of small hepatocellular carcinoma tissue, and then taking pathologic diagnosis for microvascular invasion; C: Data cleaning and dimensions reduction; D: Establishing the model for predicting microvascular invasion by machine learning. LR: Logistic regression; KNN: K-Nearest neighbor; SVM: Support vector machine; RF: Random forest.
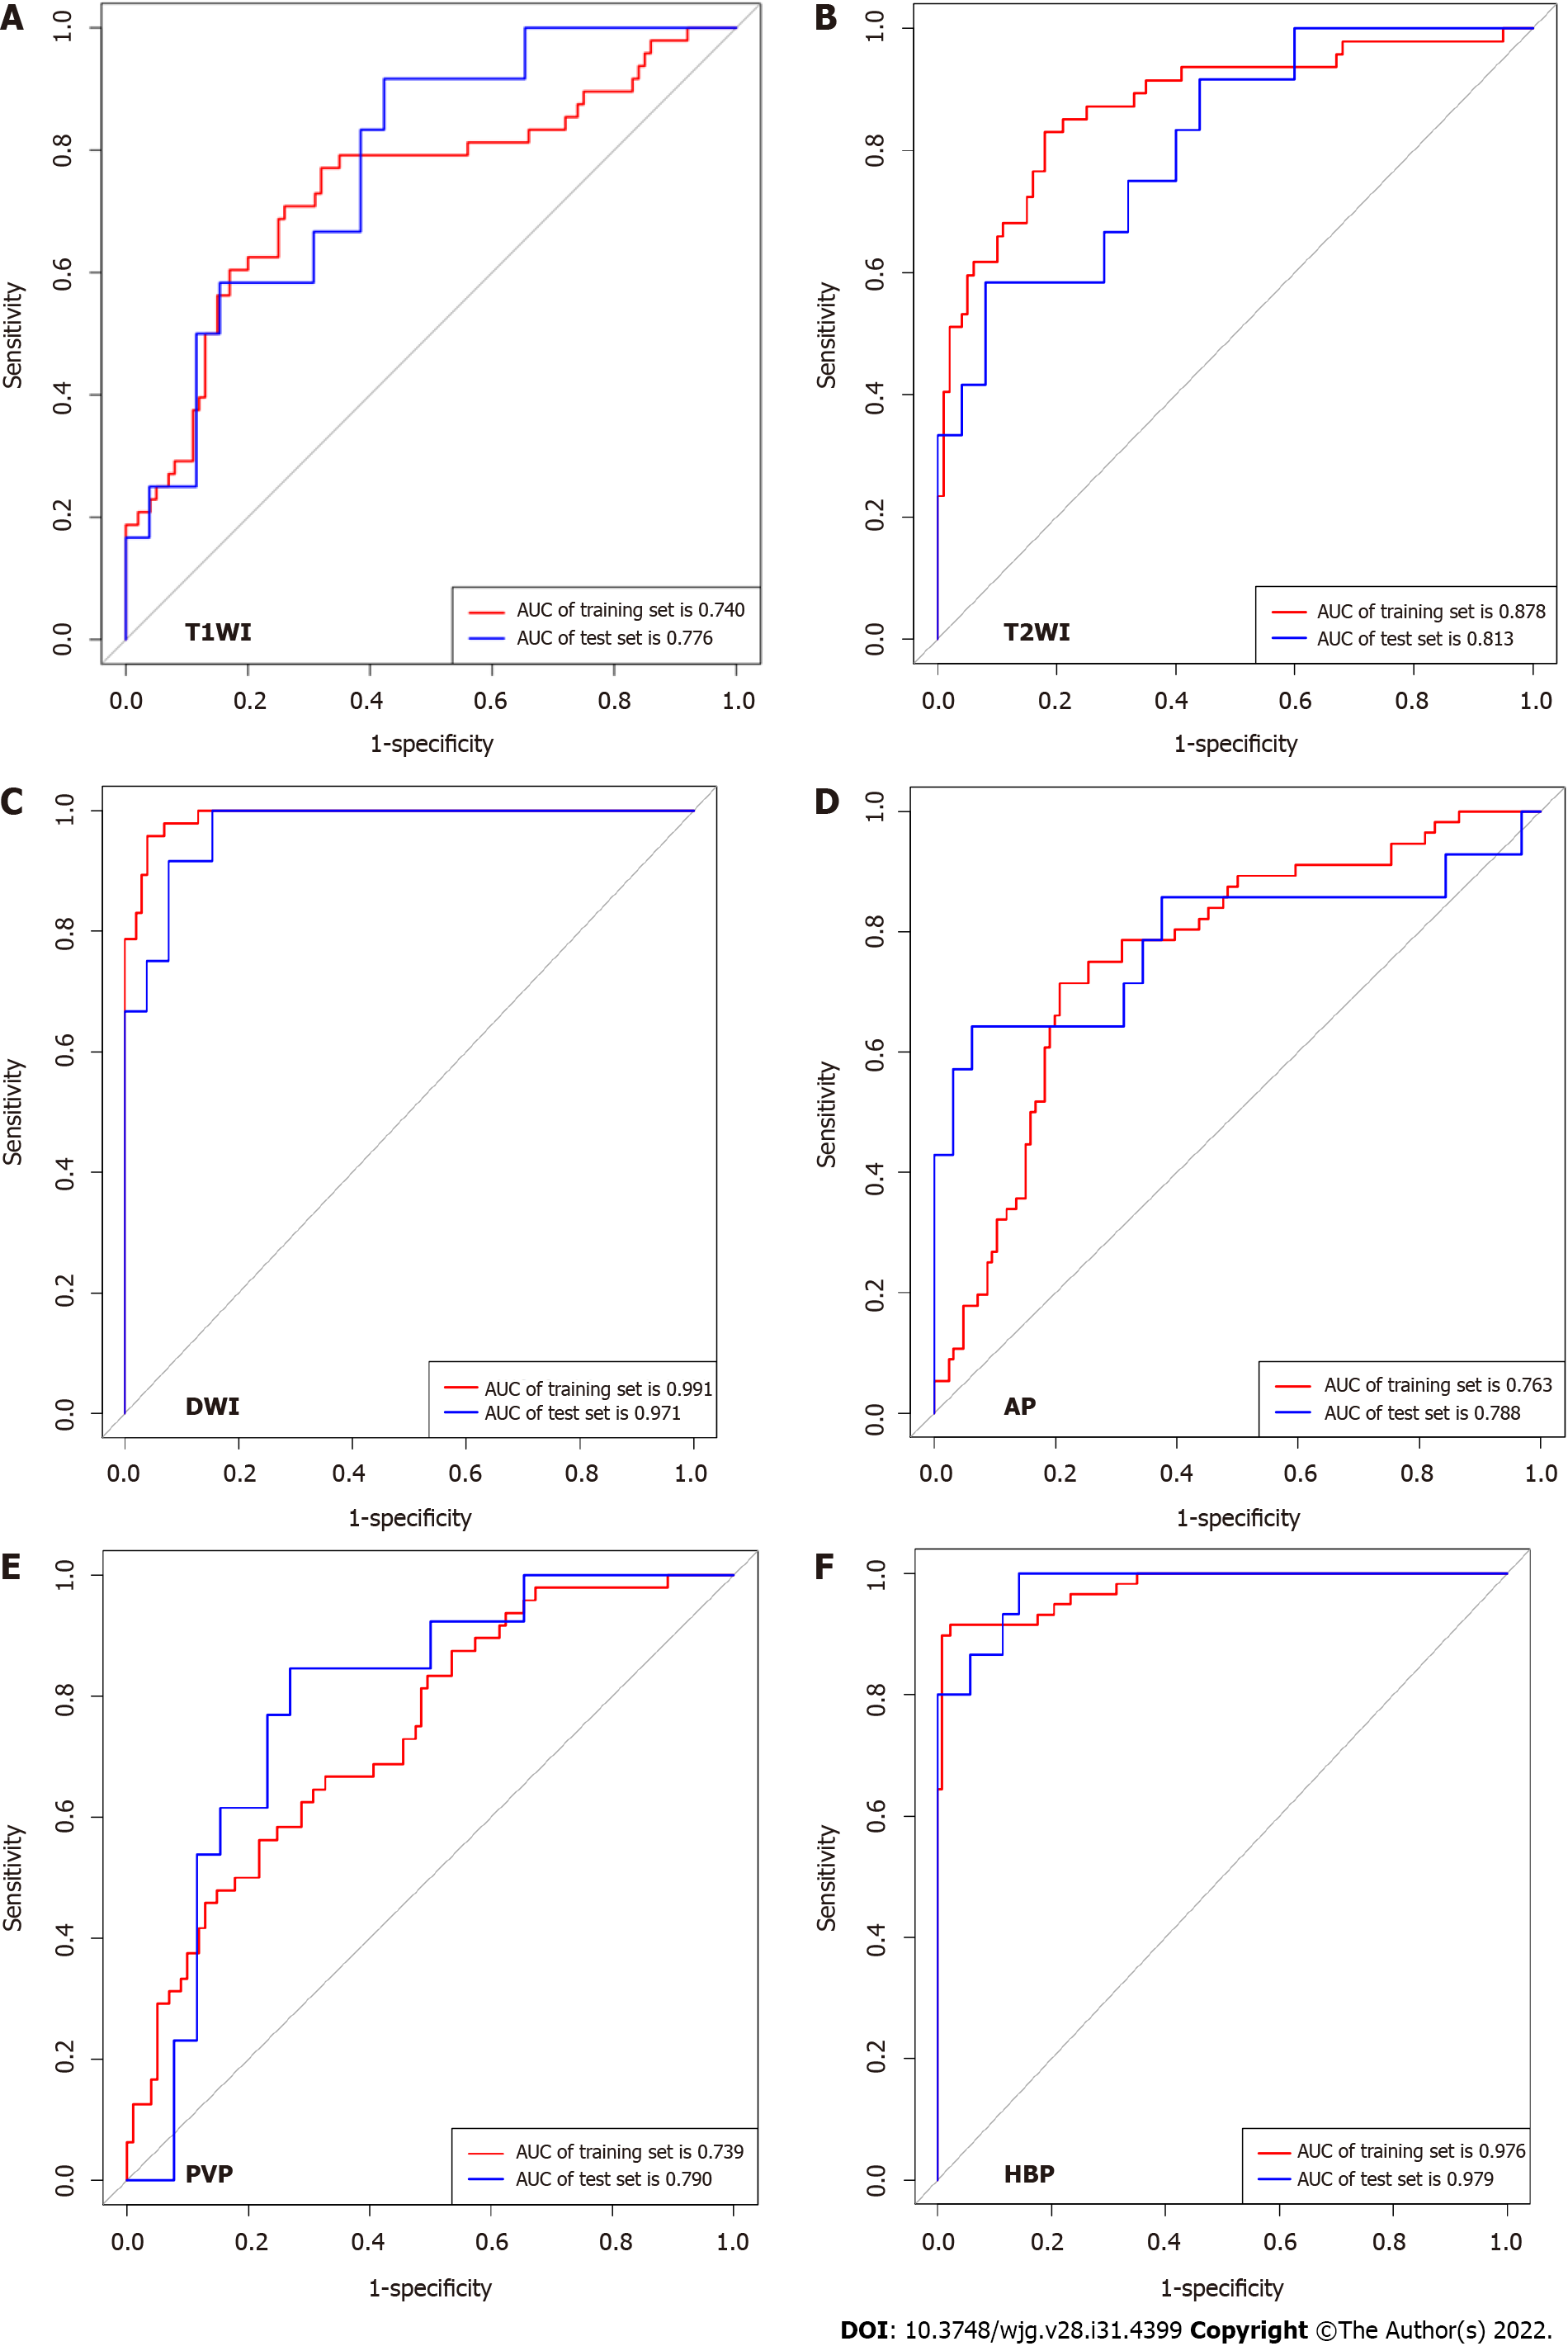
Figure 3 Receiver operating characteristic curve of different radiomics models for diagnosis microvascular invasion in small hepato
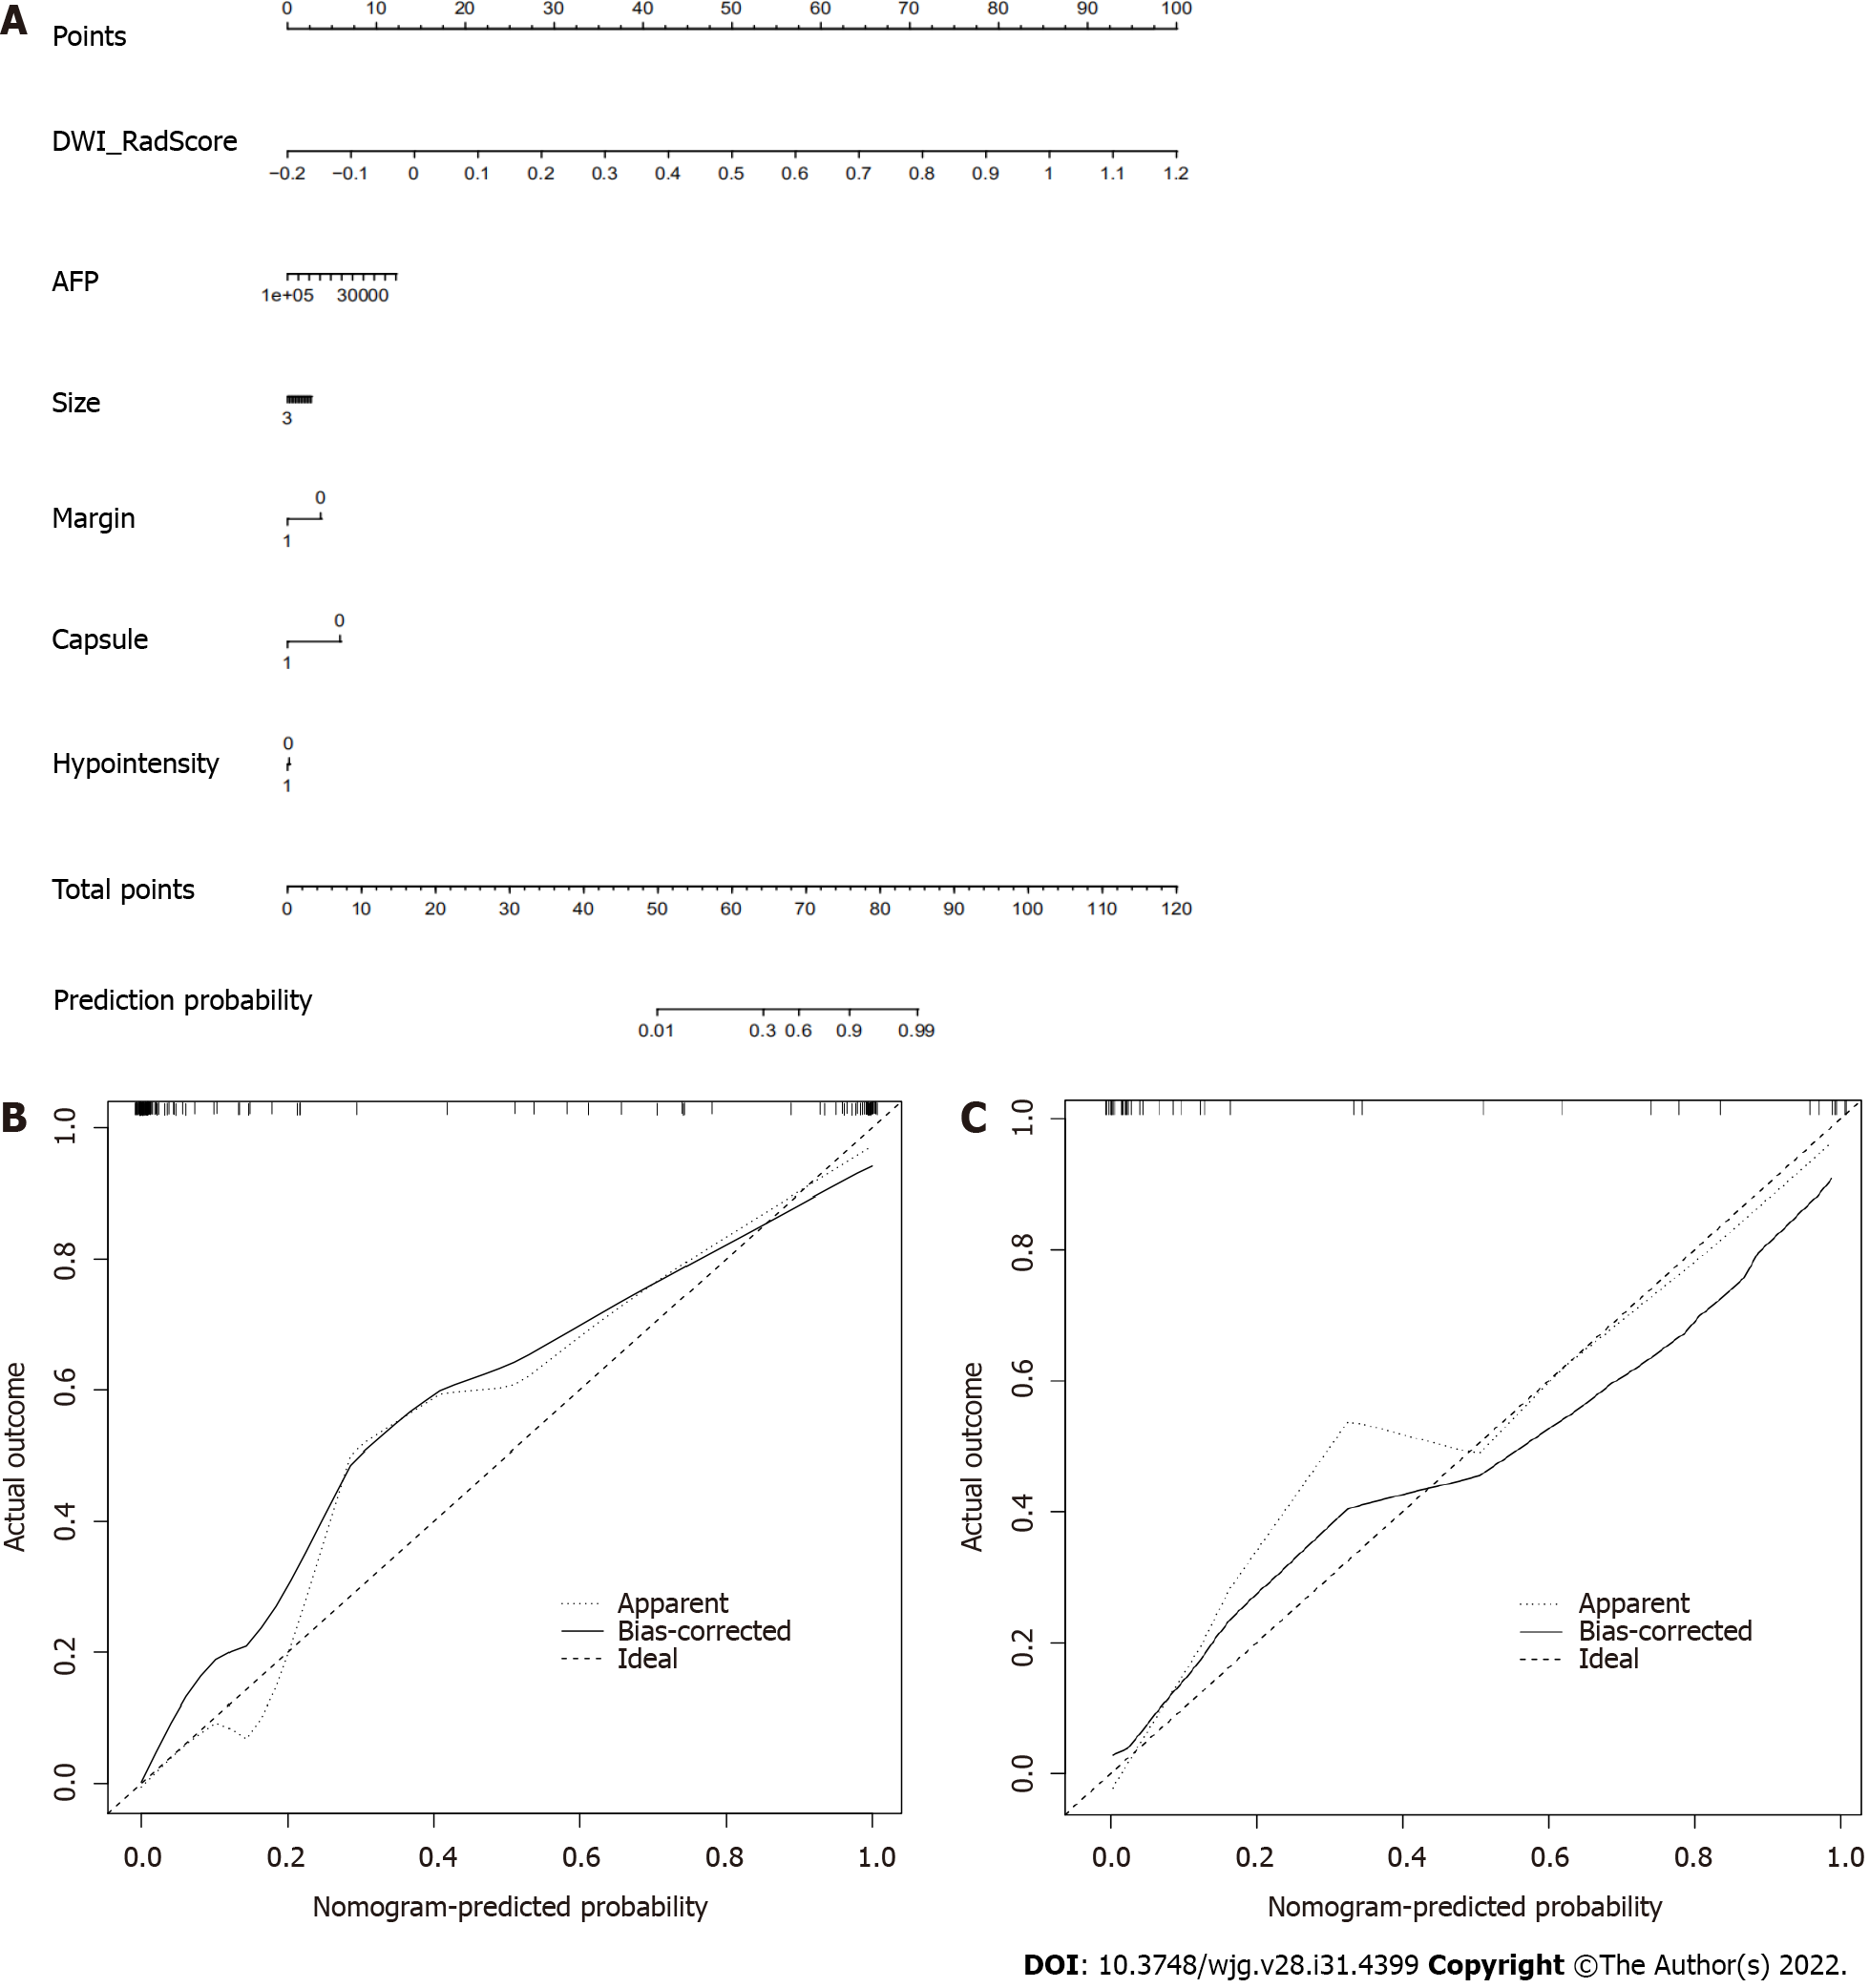
Figure 4 Nomogram of diffusion weighted imaging radiomics model to predict microvascular invasion in patients with small hepato
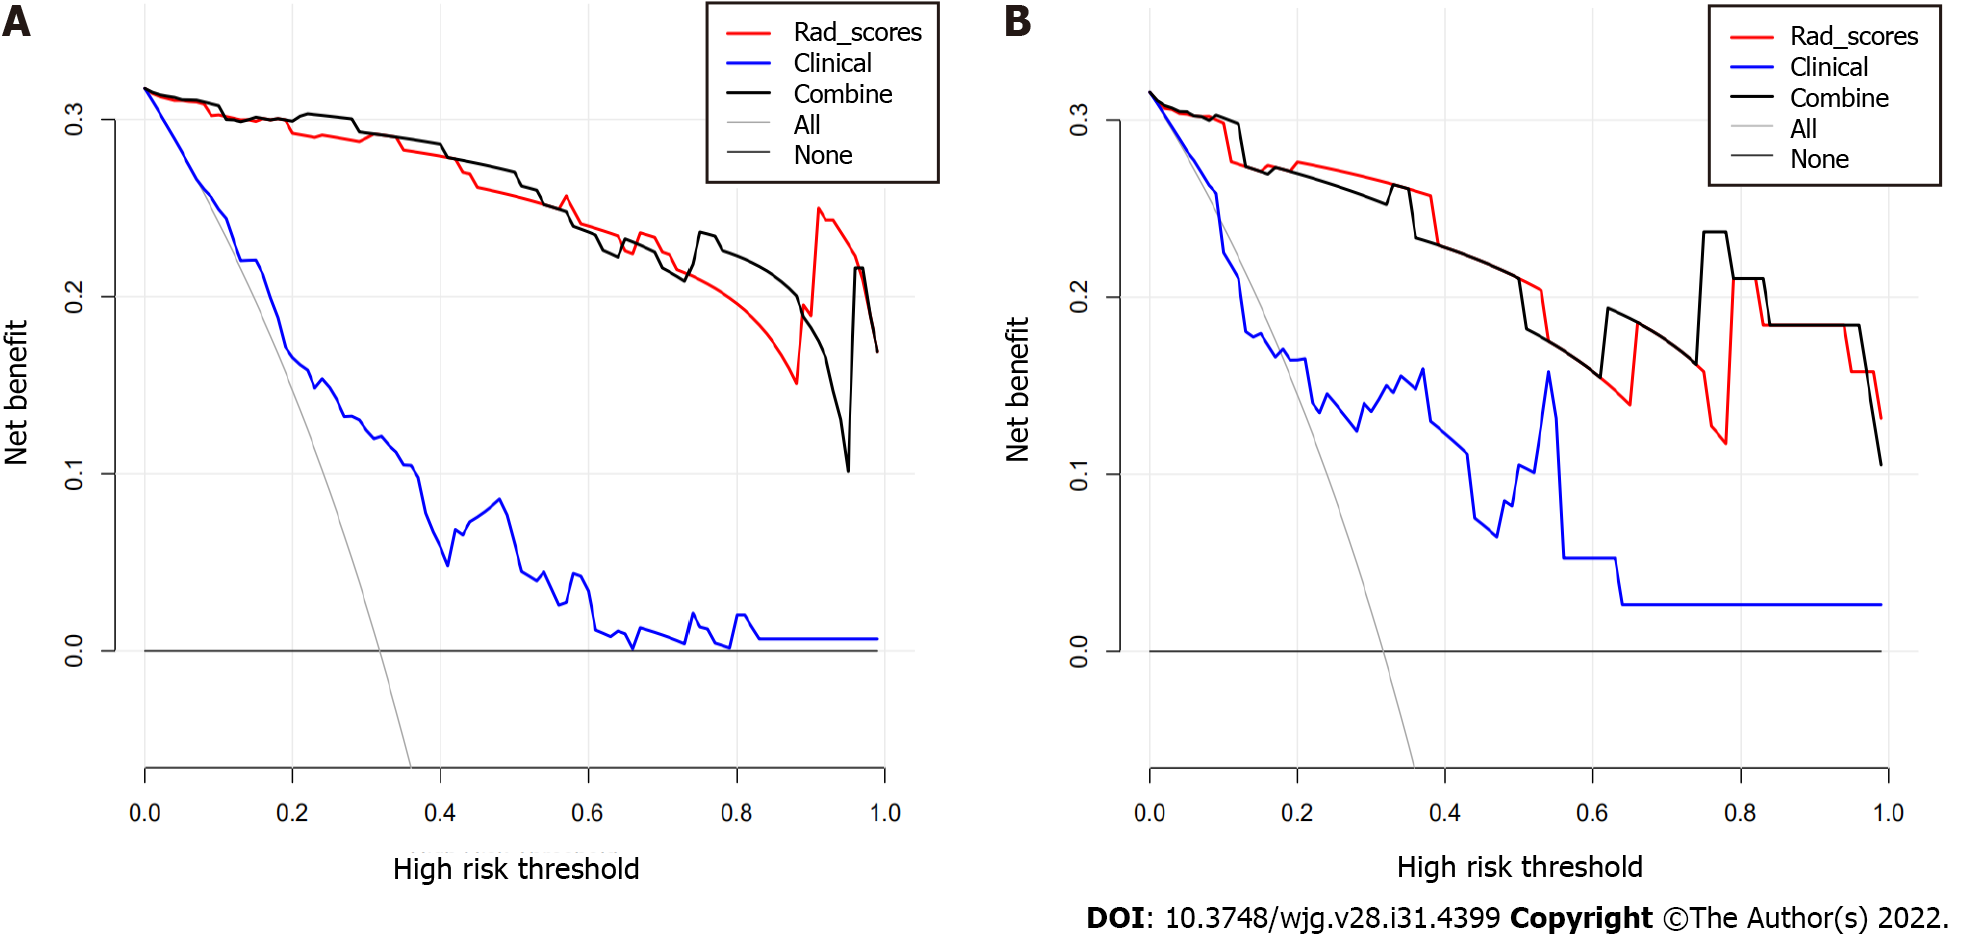
Figure 5 Decision curve analysis.
A and B: Decision curve analysis of the prediction model for training (A) and testing (B) cohort. Y-axis represents the net benefit, which is calculated by gaining true positives and deleting false positives. The X-axis is the probability threshold. The curve of the radiomics and combined nomogram over the clinical features that integrated AFP and radiological signatures showed the greatest benefit. AFP: Alpha-fetoprotein; Rad_score: Radiomics signatures score.
- Citation: Chen YD, Zhang L, Zhou ZP, Lin B, Jiang ZJ, Tang C, Dang YW, Xia YW, Song B, Long LL. Radiomics and nomogram of magnetic resonance imaging for preoperative prediction of microvascular invasion in small hepatocellular carcinoma. World J Gastroenterol 2022; 28(31): 4399-4416
- URL: https://www.wjgnet.com/1007-9327/full/v28/i31/4399.htm
- DOI: https://dx.doi.org/10.3748/wjg.v28.i31.4399


