Copyright
©The Author(s) 2022.
World J Gastroenterol. Aug 21, 2022; 28(31): 4376-4389
Published online Aug 21, 2022. doi: 10.3748/wjg.v28.i31.4376
Published online Aug 21, 2022. doi: 10.3748/wjg.v28.i31.4376
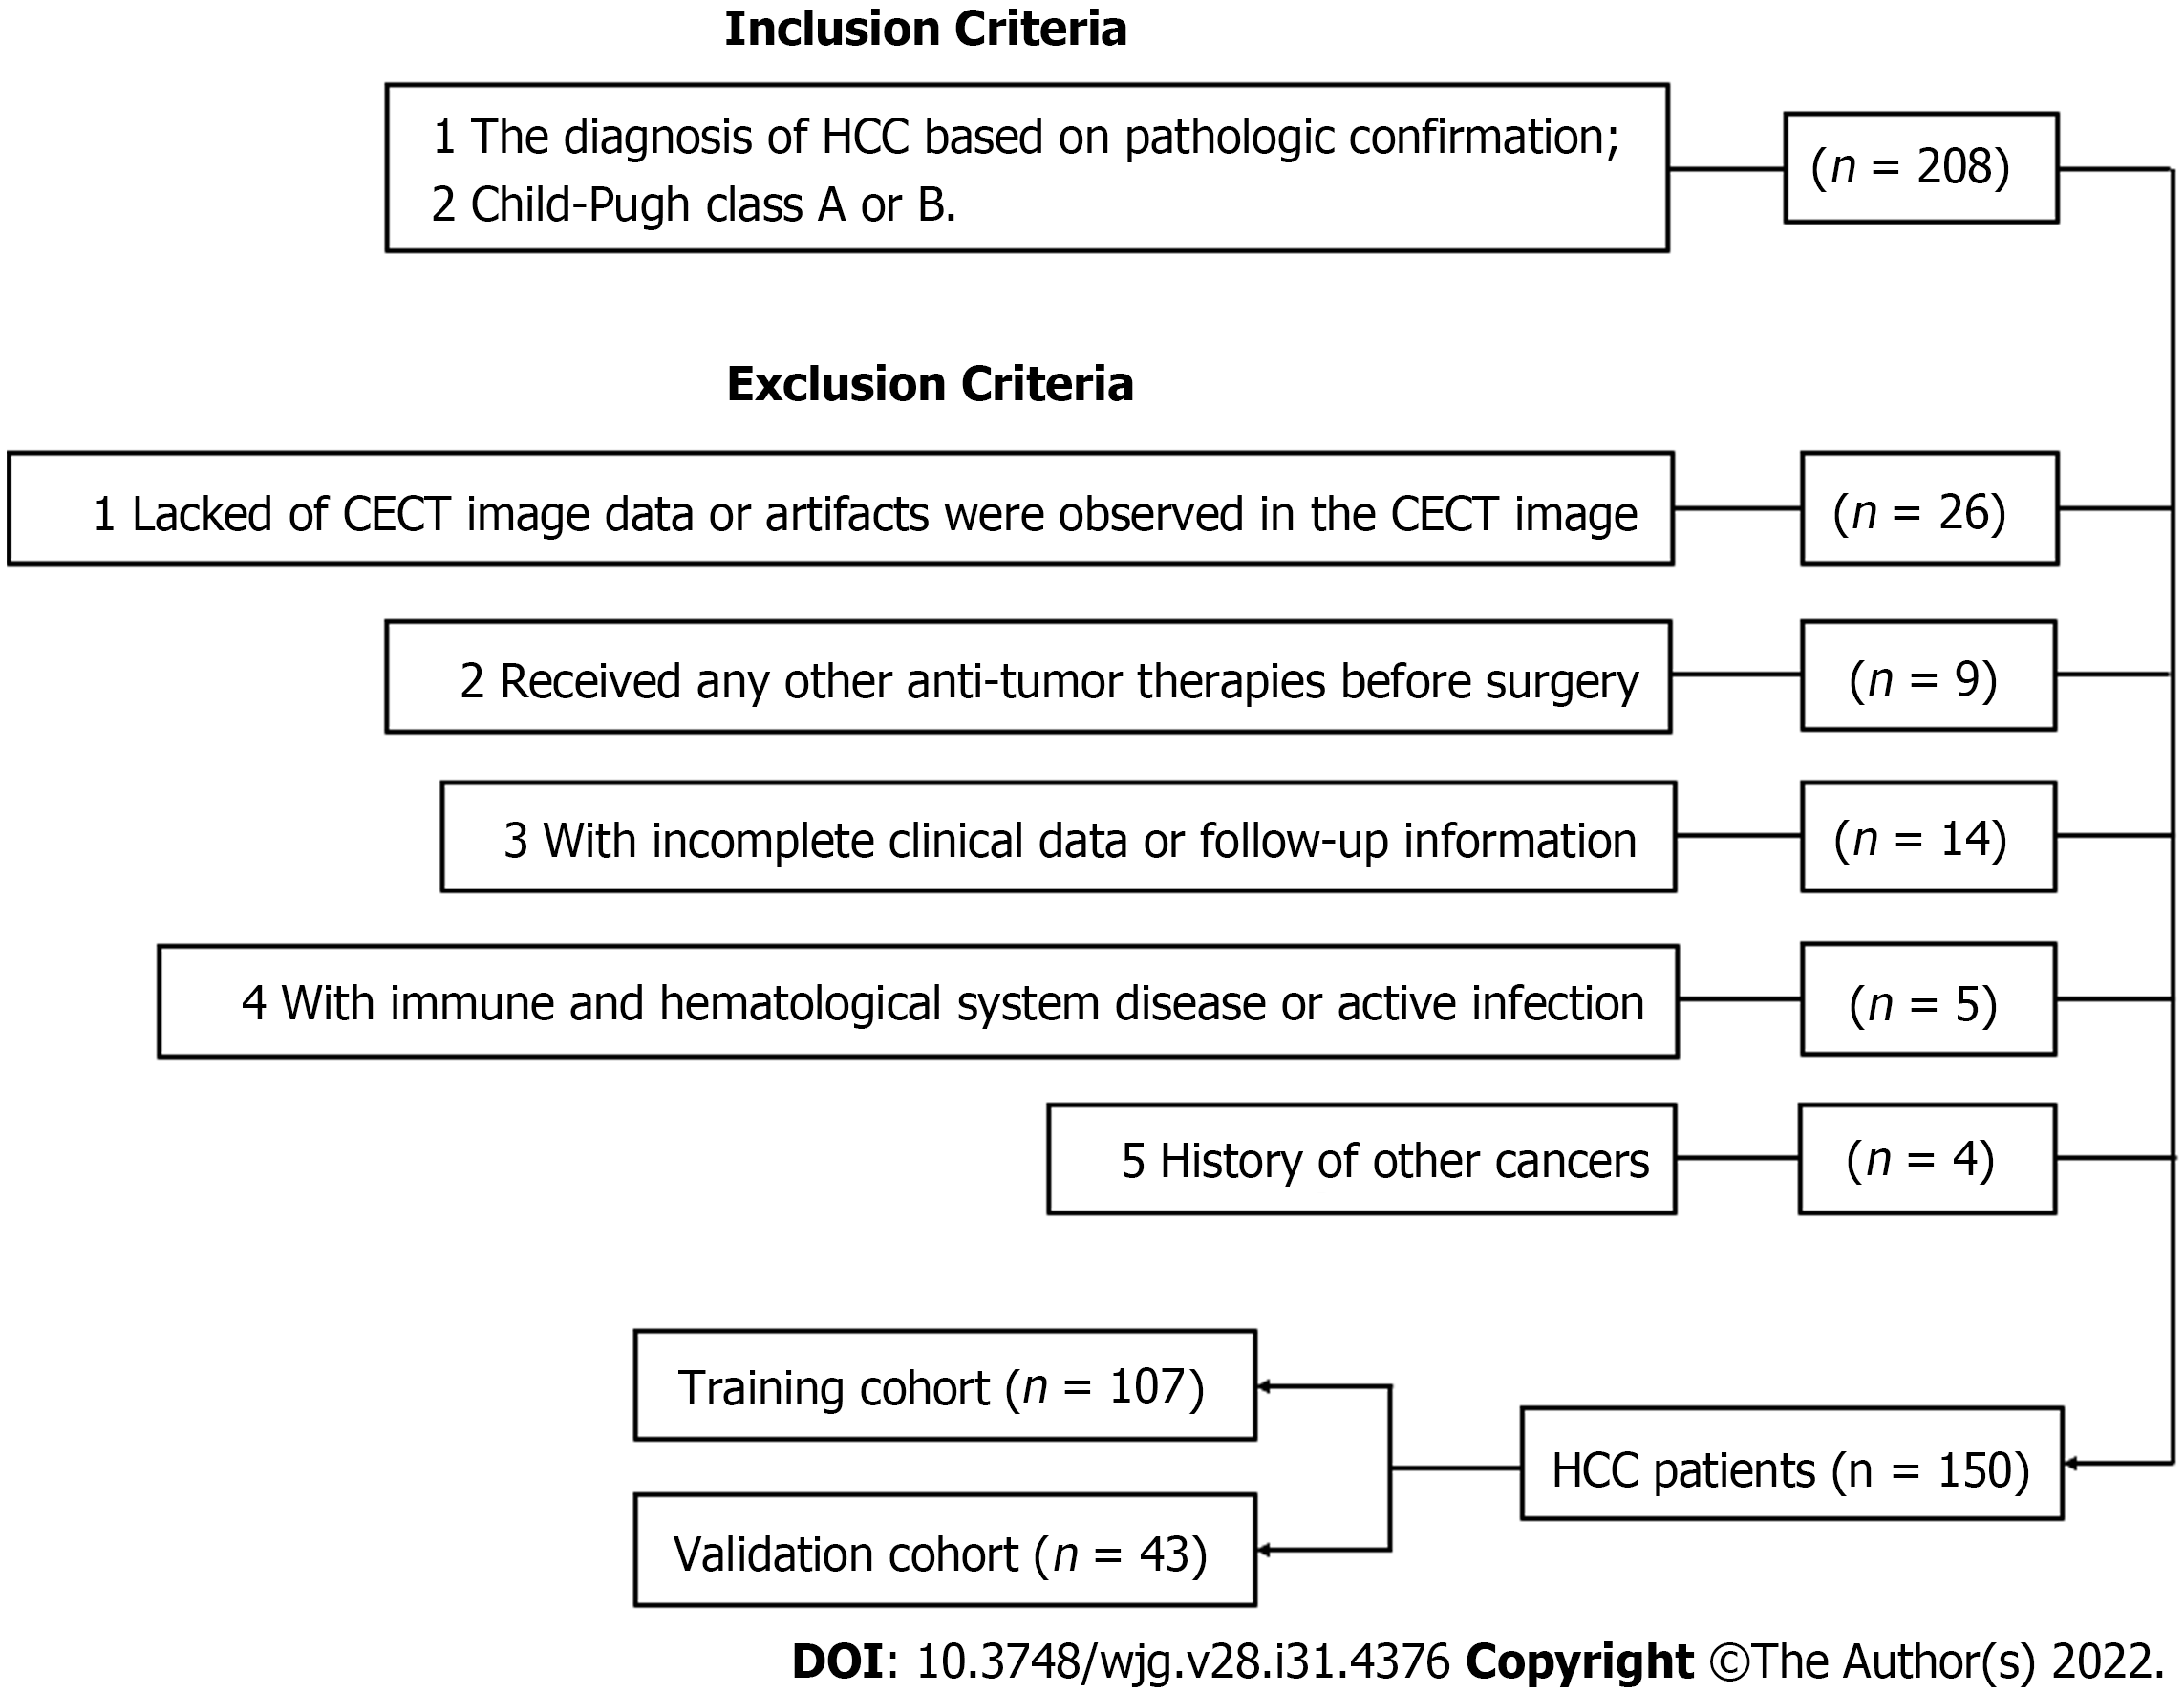
Figure 1 Flowchart of the patient selection process.
HCC: Hepatocellular carcinoma; CECT: Contrast-enhanced computed tomography.
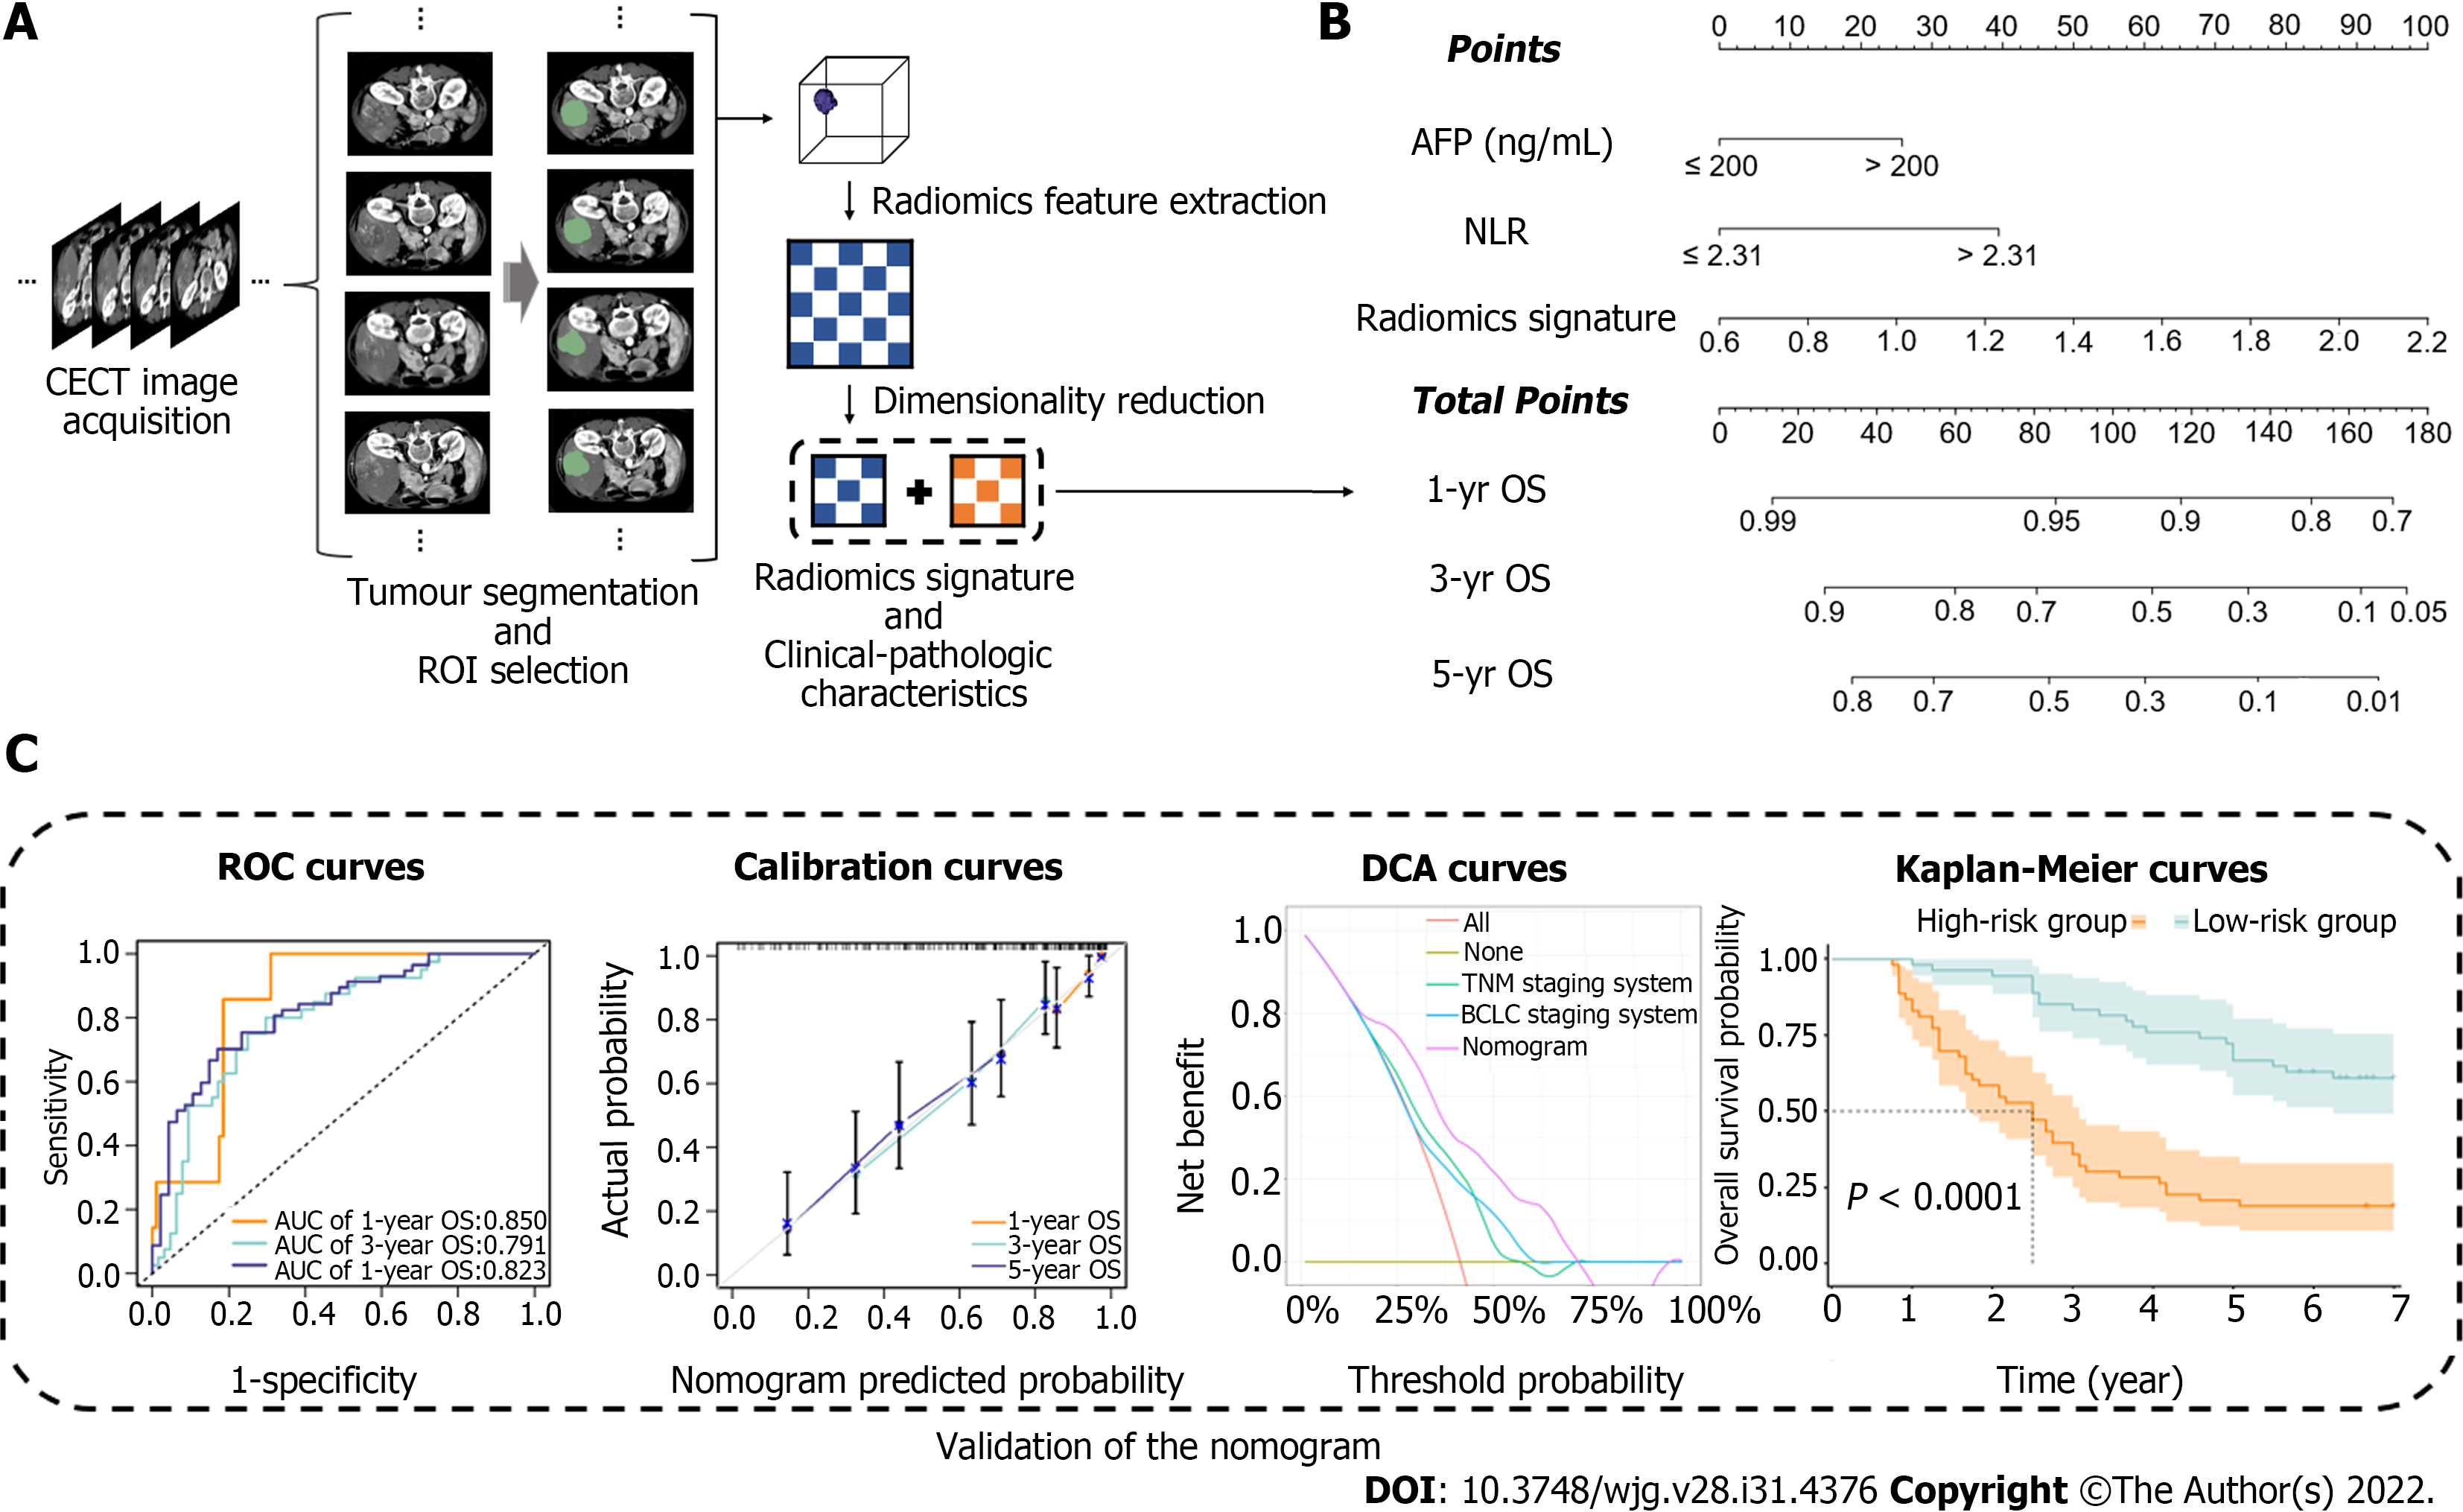
Figure 2 Workflow of model construction and validation.
A: Contrast-enhanced computed tomography image acquisition, tumour segmentation, region of interest selection, radiomics feature extraction and radiomics signature construction; B: Combination of the radiomics signature and clinical-pathologic characteristics to build the predictive model, the model was visualized via nomogram; C: Evaluation of the predictive model by using receiver operating characteristic curves, calibration curves, decision curve analysis curves and Kaplan–Meier curves. CECT: Contrast-enhanced computed tomography; ROI: Region of interest; AFP: Alpha fetoprotein; NLR: Neutrophil-to-lymphocyte ratio; OS: Overall survival; ROC: Receiver operating characteristic; AUC: Area under the curve; DCA: Decision curve analysis; BCLC: Barcelona Clinic Liver Cancer.
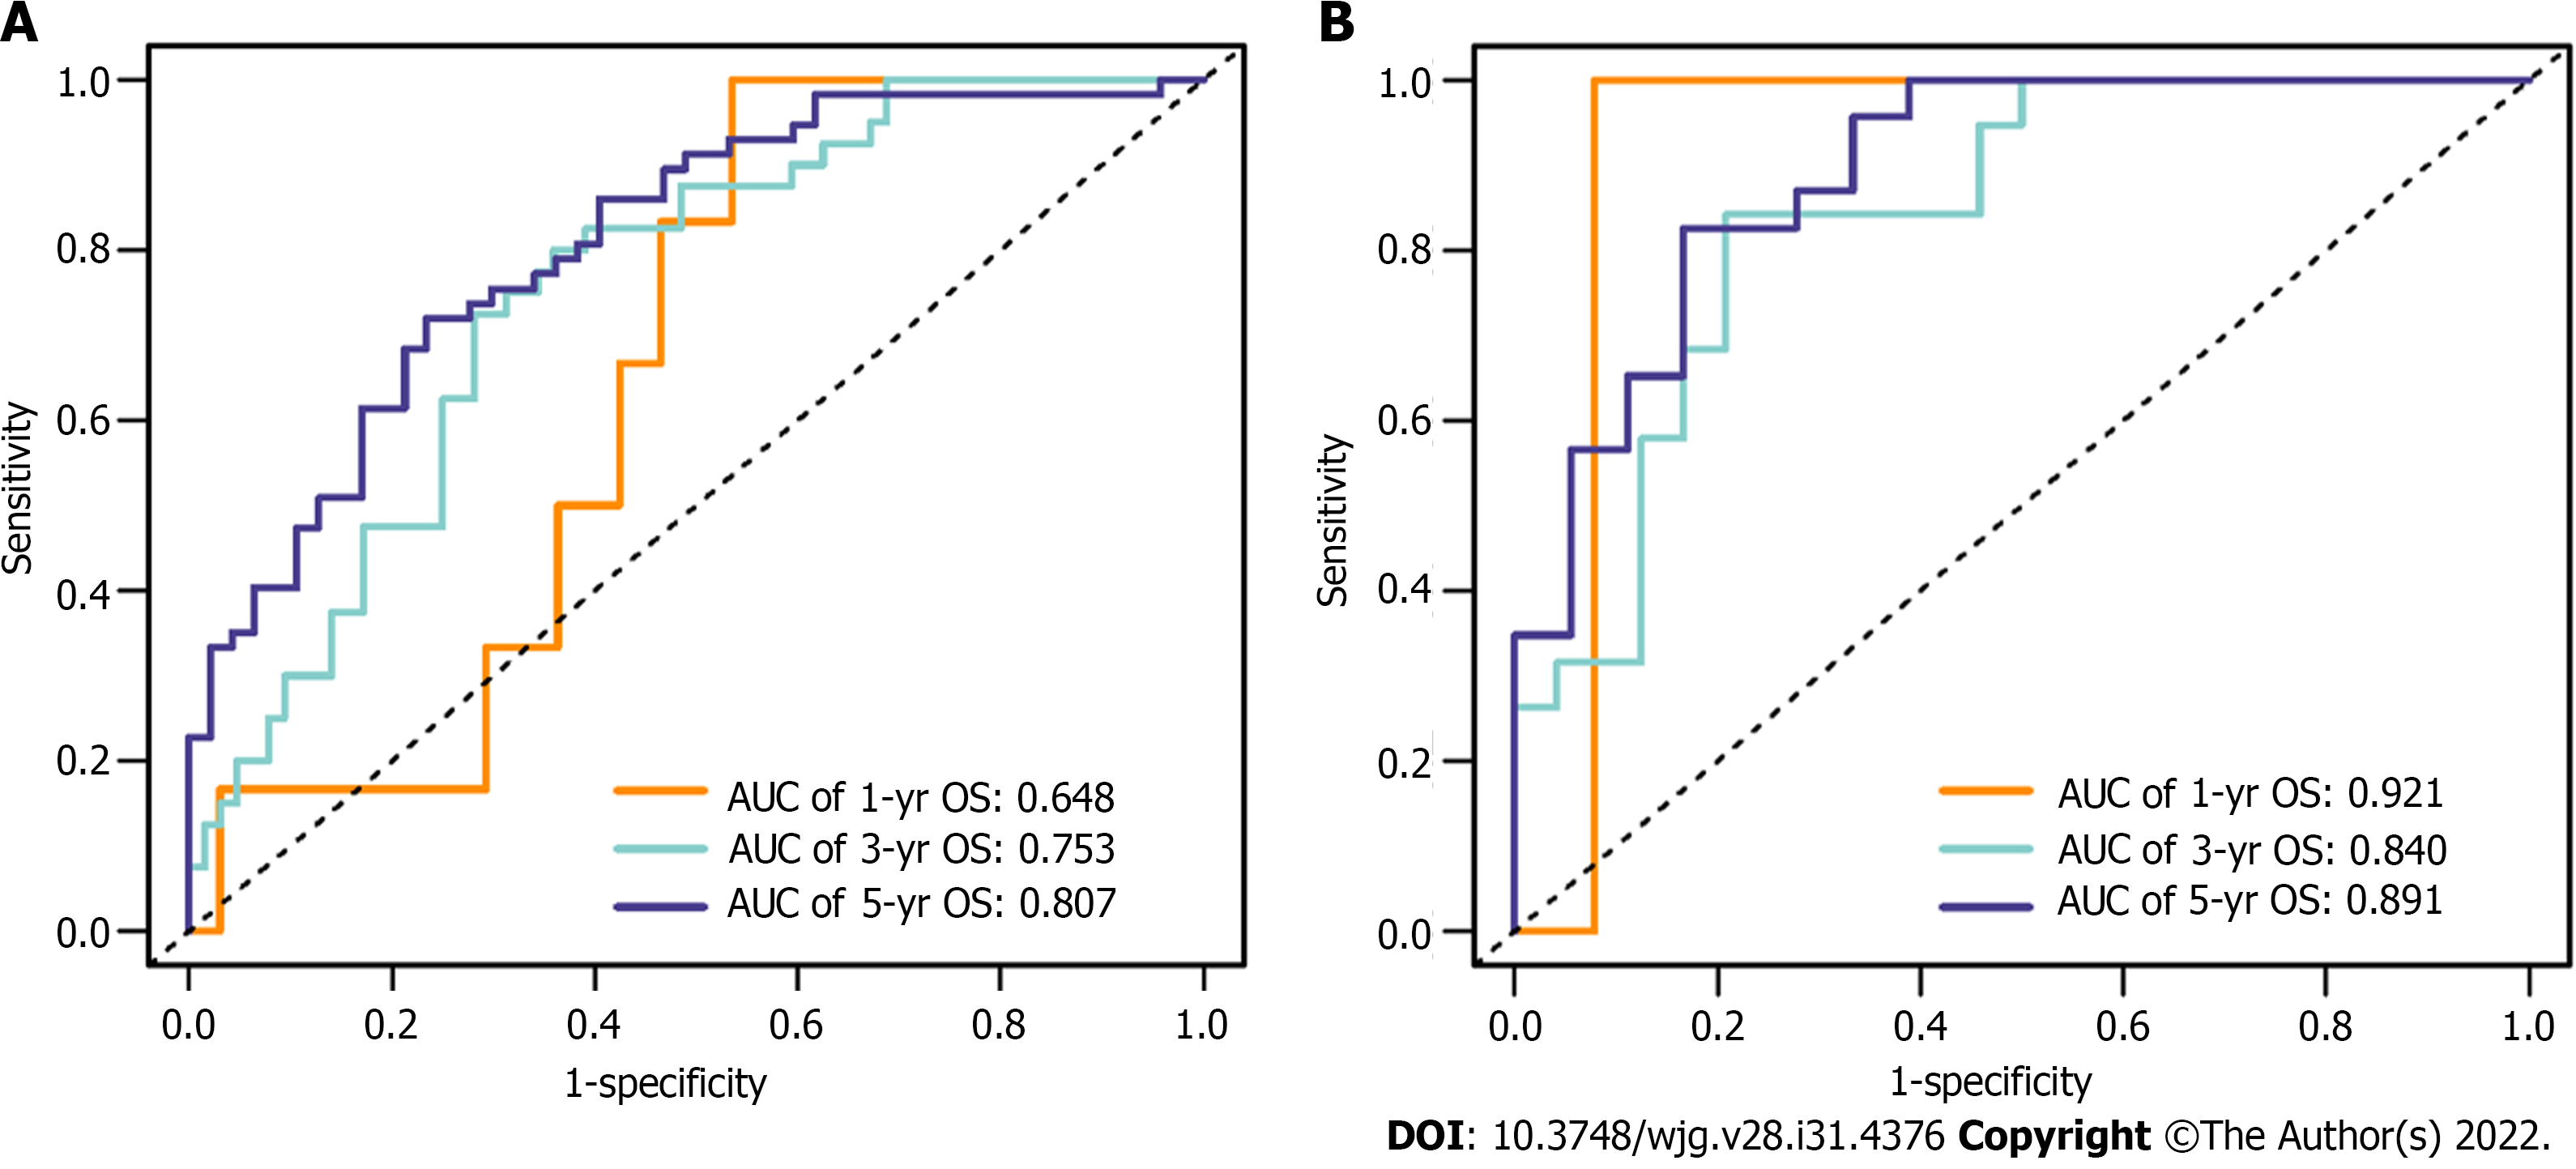
Figure 3 Receiver operating characteristic curves of the radiomics signature for predicting 1-, 3- and 5-year overall survival in the training and validation cohorts.
A: Training cohort; B: Validation cohort. OS: Overall survival; AUC: Area under the curve.
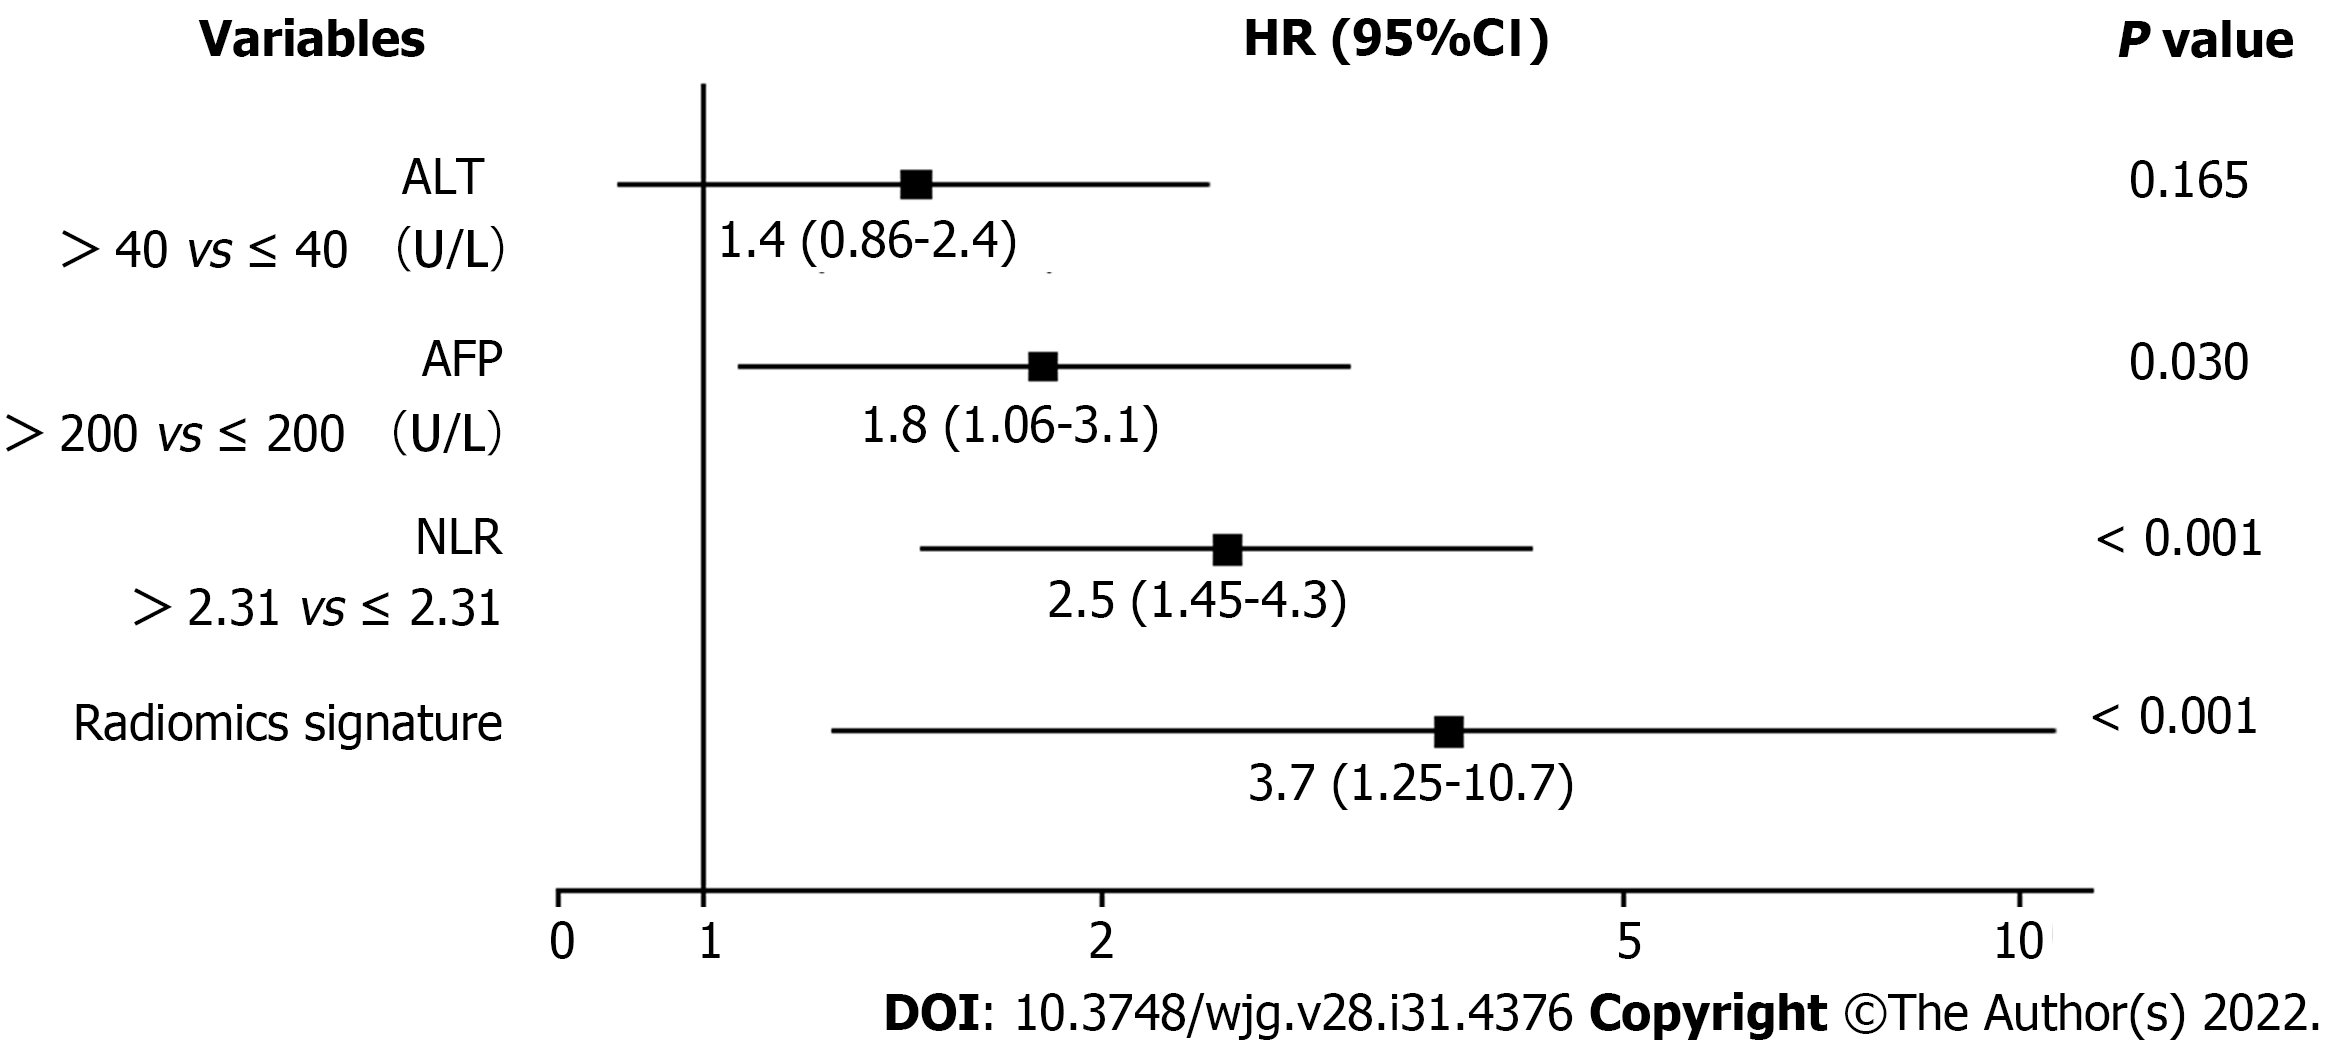
Figure 4 Forest plot of variables with multivariate regression analysis in the training cohort.
Variables with a P value < 0.05 were considered significantly associated with the overall survival of hepatocellular carcinoma patients. ALT: Alanine transaminase; AFP: Alpha fetoprotein; NLR: Neutrophil-to-lymphocyte ratio; HR: Hazard ratio.
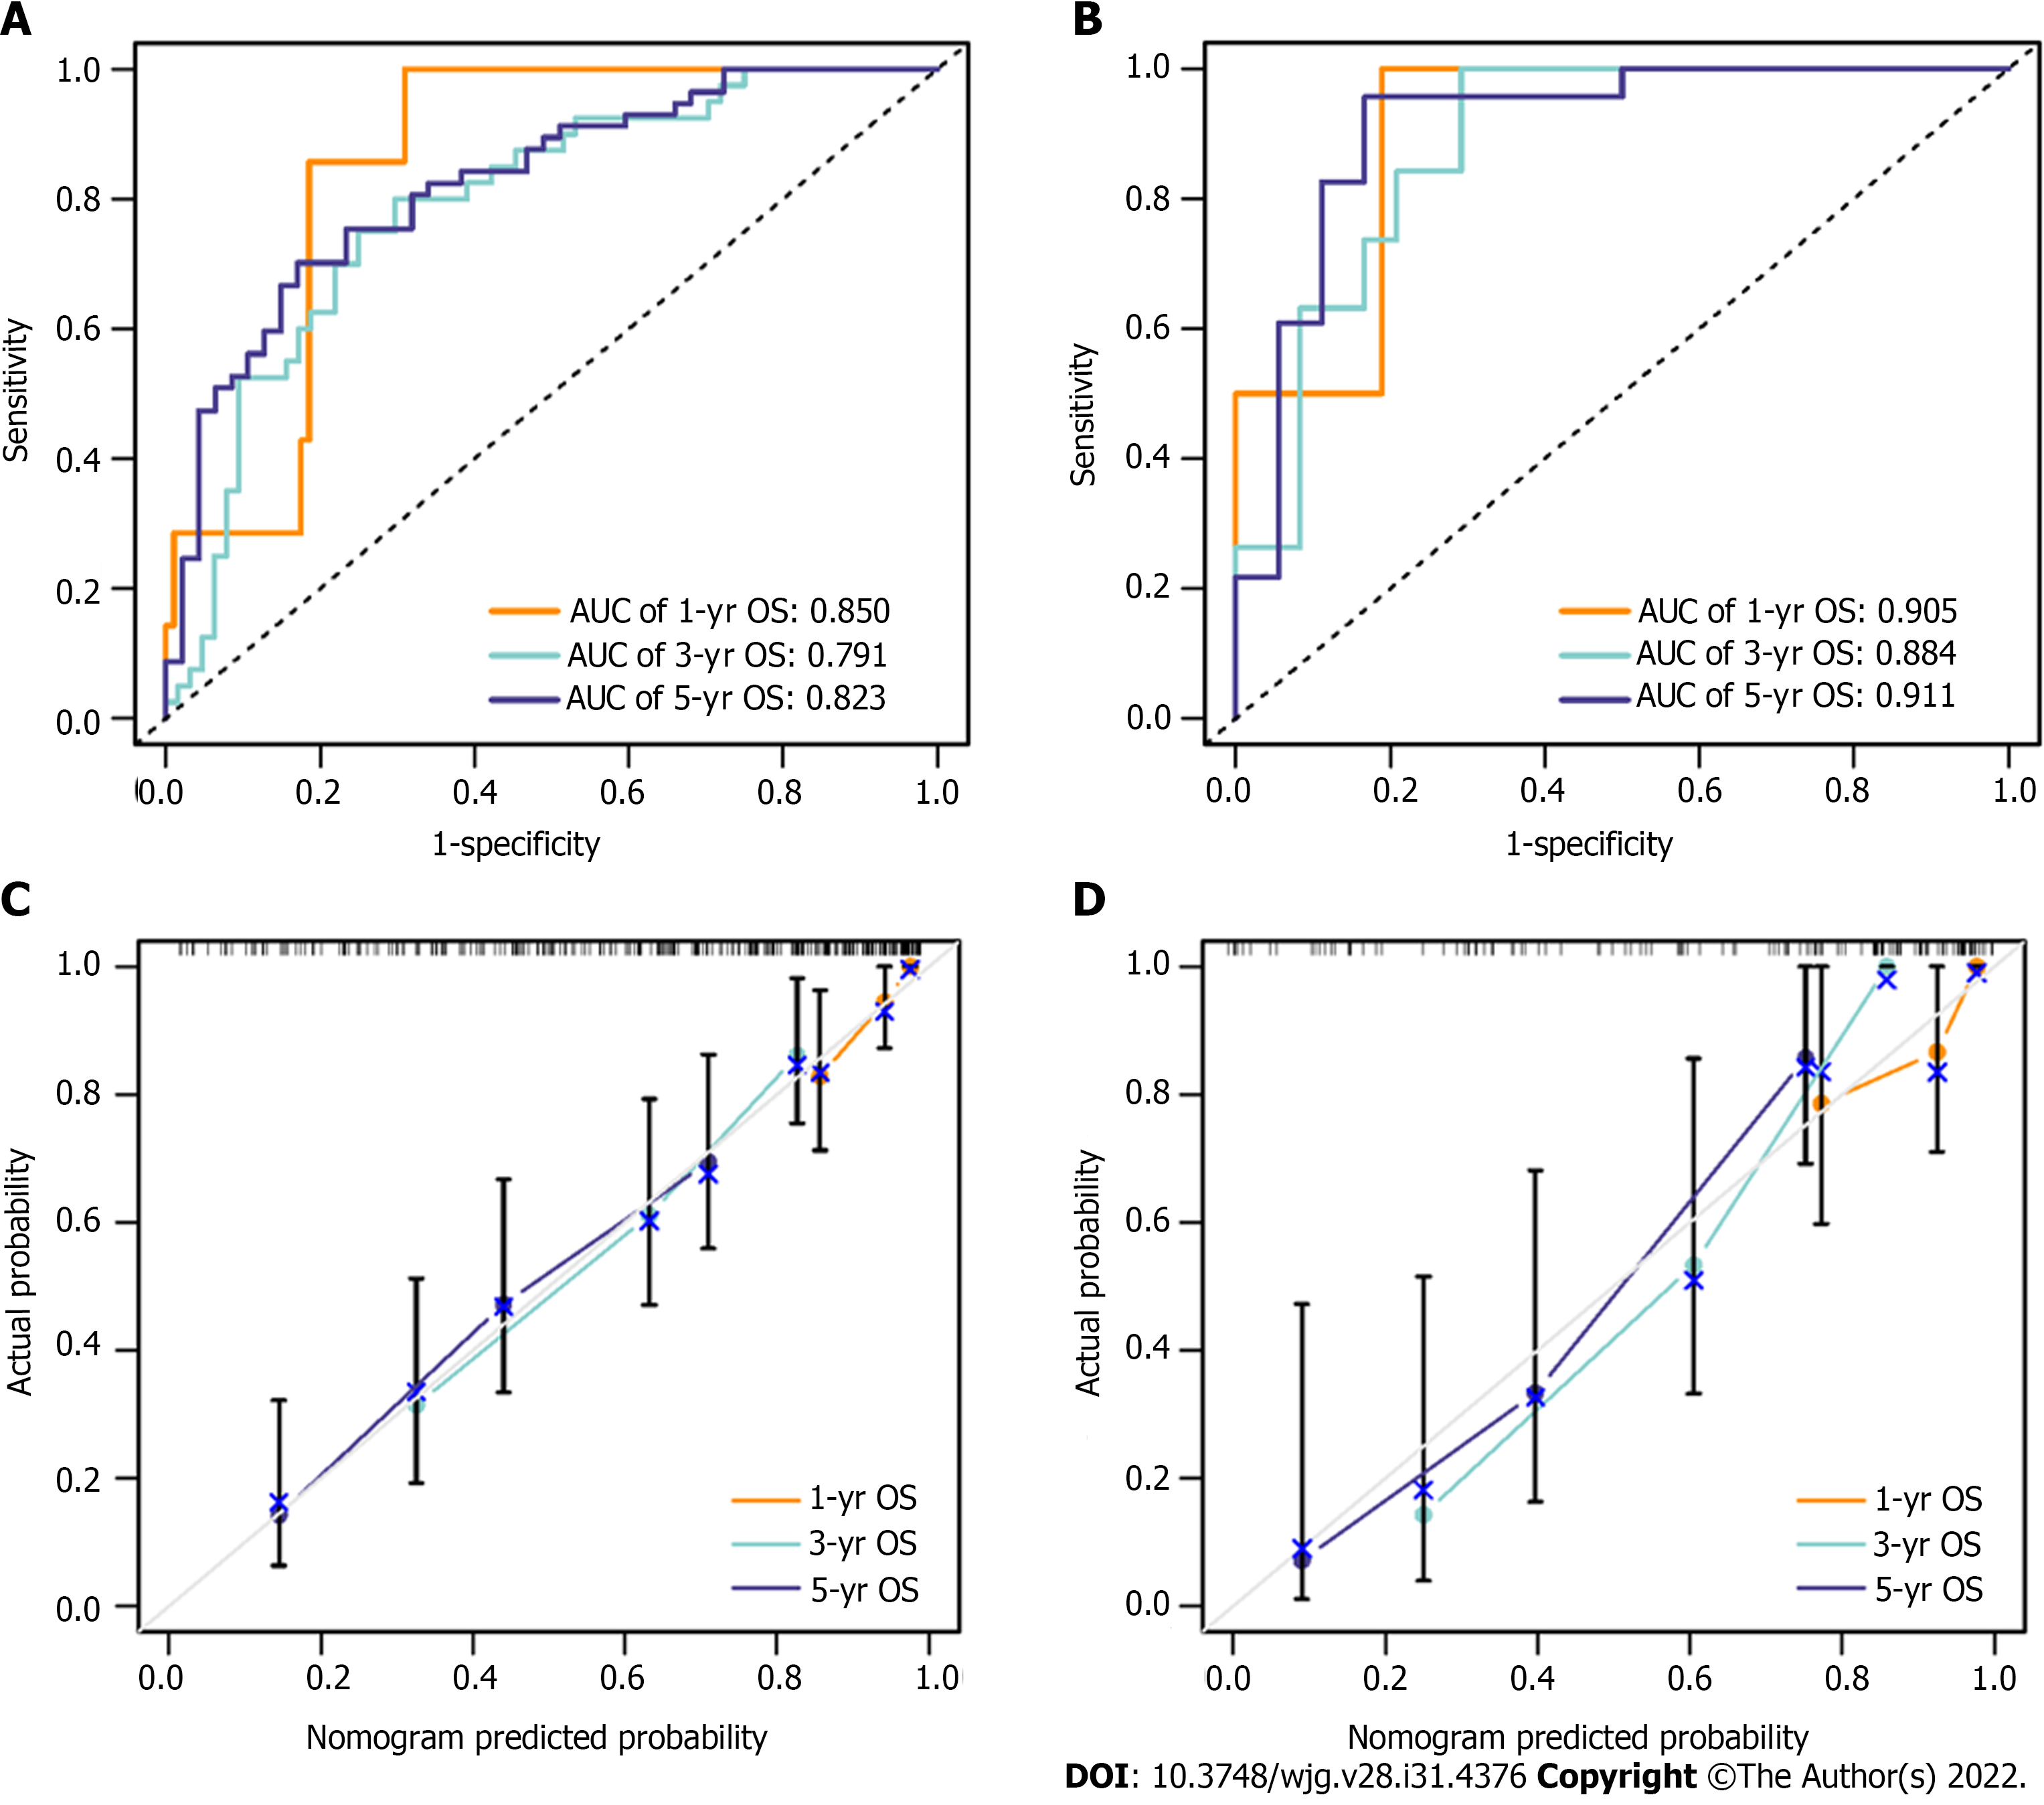
Figure 5 Accuracy of the nomogram for predicting 1-, 3- and 5-year OS in the training and validation cohorts was evaluated by receiver operating characteristic curves and calibration curves.
A and B: Receiver operating characteristic curves of the nomogram in the training cohort (A) and validation cohort (B); C and D: Calibration curves of the nomogram in the training cohort (C) and validation cohort (D). In the calibration curve, the nomogram-predicted survival probability is represented on the x-axis, and the actual outcome of overall survival is represented on the y-axis. A closer fit of the coloured lines to the ideal grey line indicates better accuracy in predicting OS. OS: Overall survival; AUC: Area under the curve.
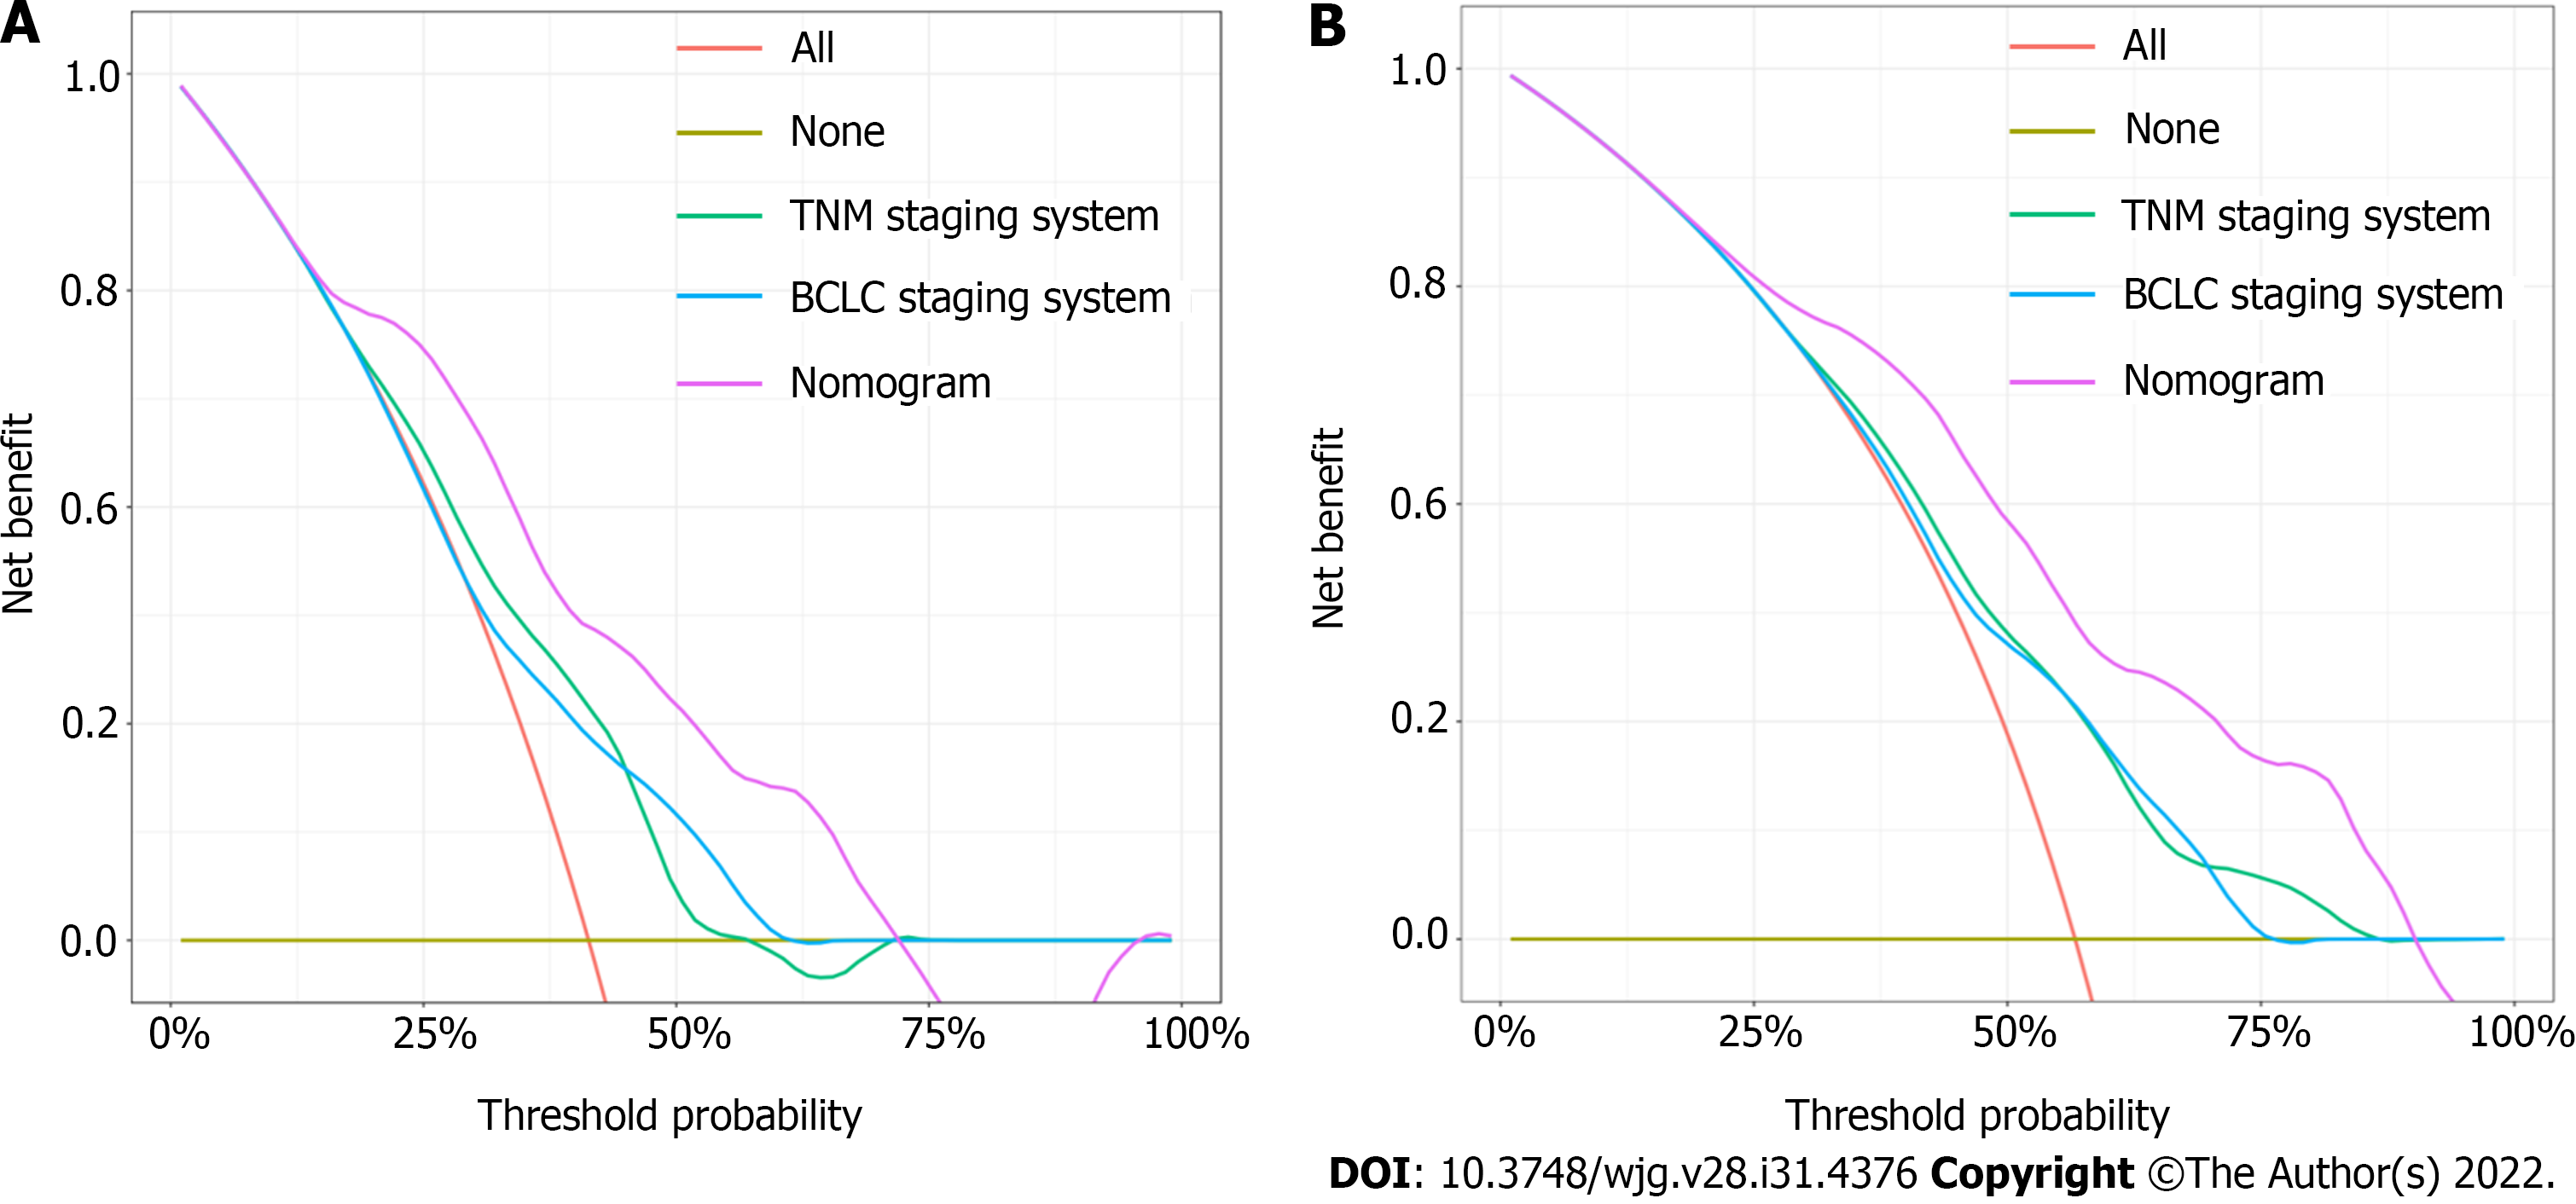
Figure 6 Decision curve analysis was performed in all hepatocellular carcinoma patients to evaluate the clinical practicality of the nomogram for predicting 3- and 5-year overall survival compared with the Barcelona clinic liver cancer staging system model and tumor, node and metastasis staging system model.
A and B: Decision curve analysis of the nomogram, Barcelona clinic liver cancer staging system model and tumor, node and metastasis staging system model in predicting 3- (A) and 5-year (B) OS. In the decision curve, the threshold probability is represented on the x-axis, and the net benefit is represented on the y-axis. A higher curve indicates a greater net benefit at any given threshold probability. The decision curve showed that the nomogram adds more net benefit than traditional staging system models. BCLC: Barcelona clinic liver cancer; TNM: Tumor, node and metastasis.
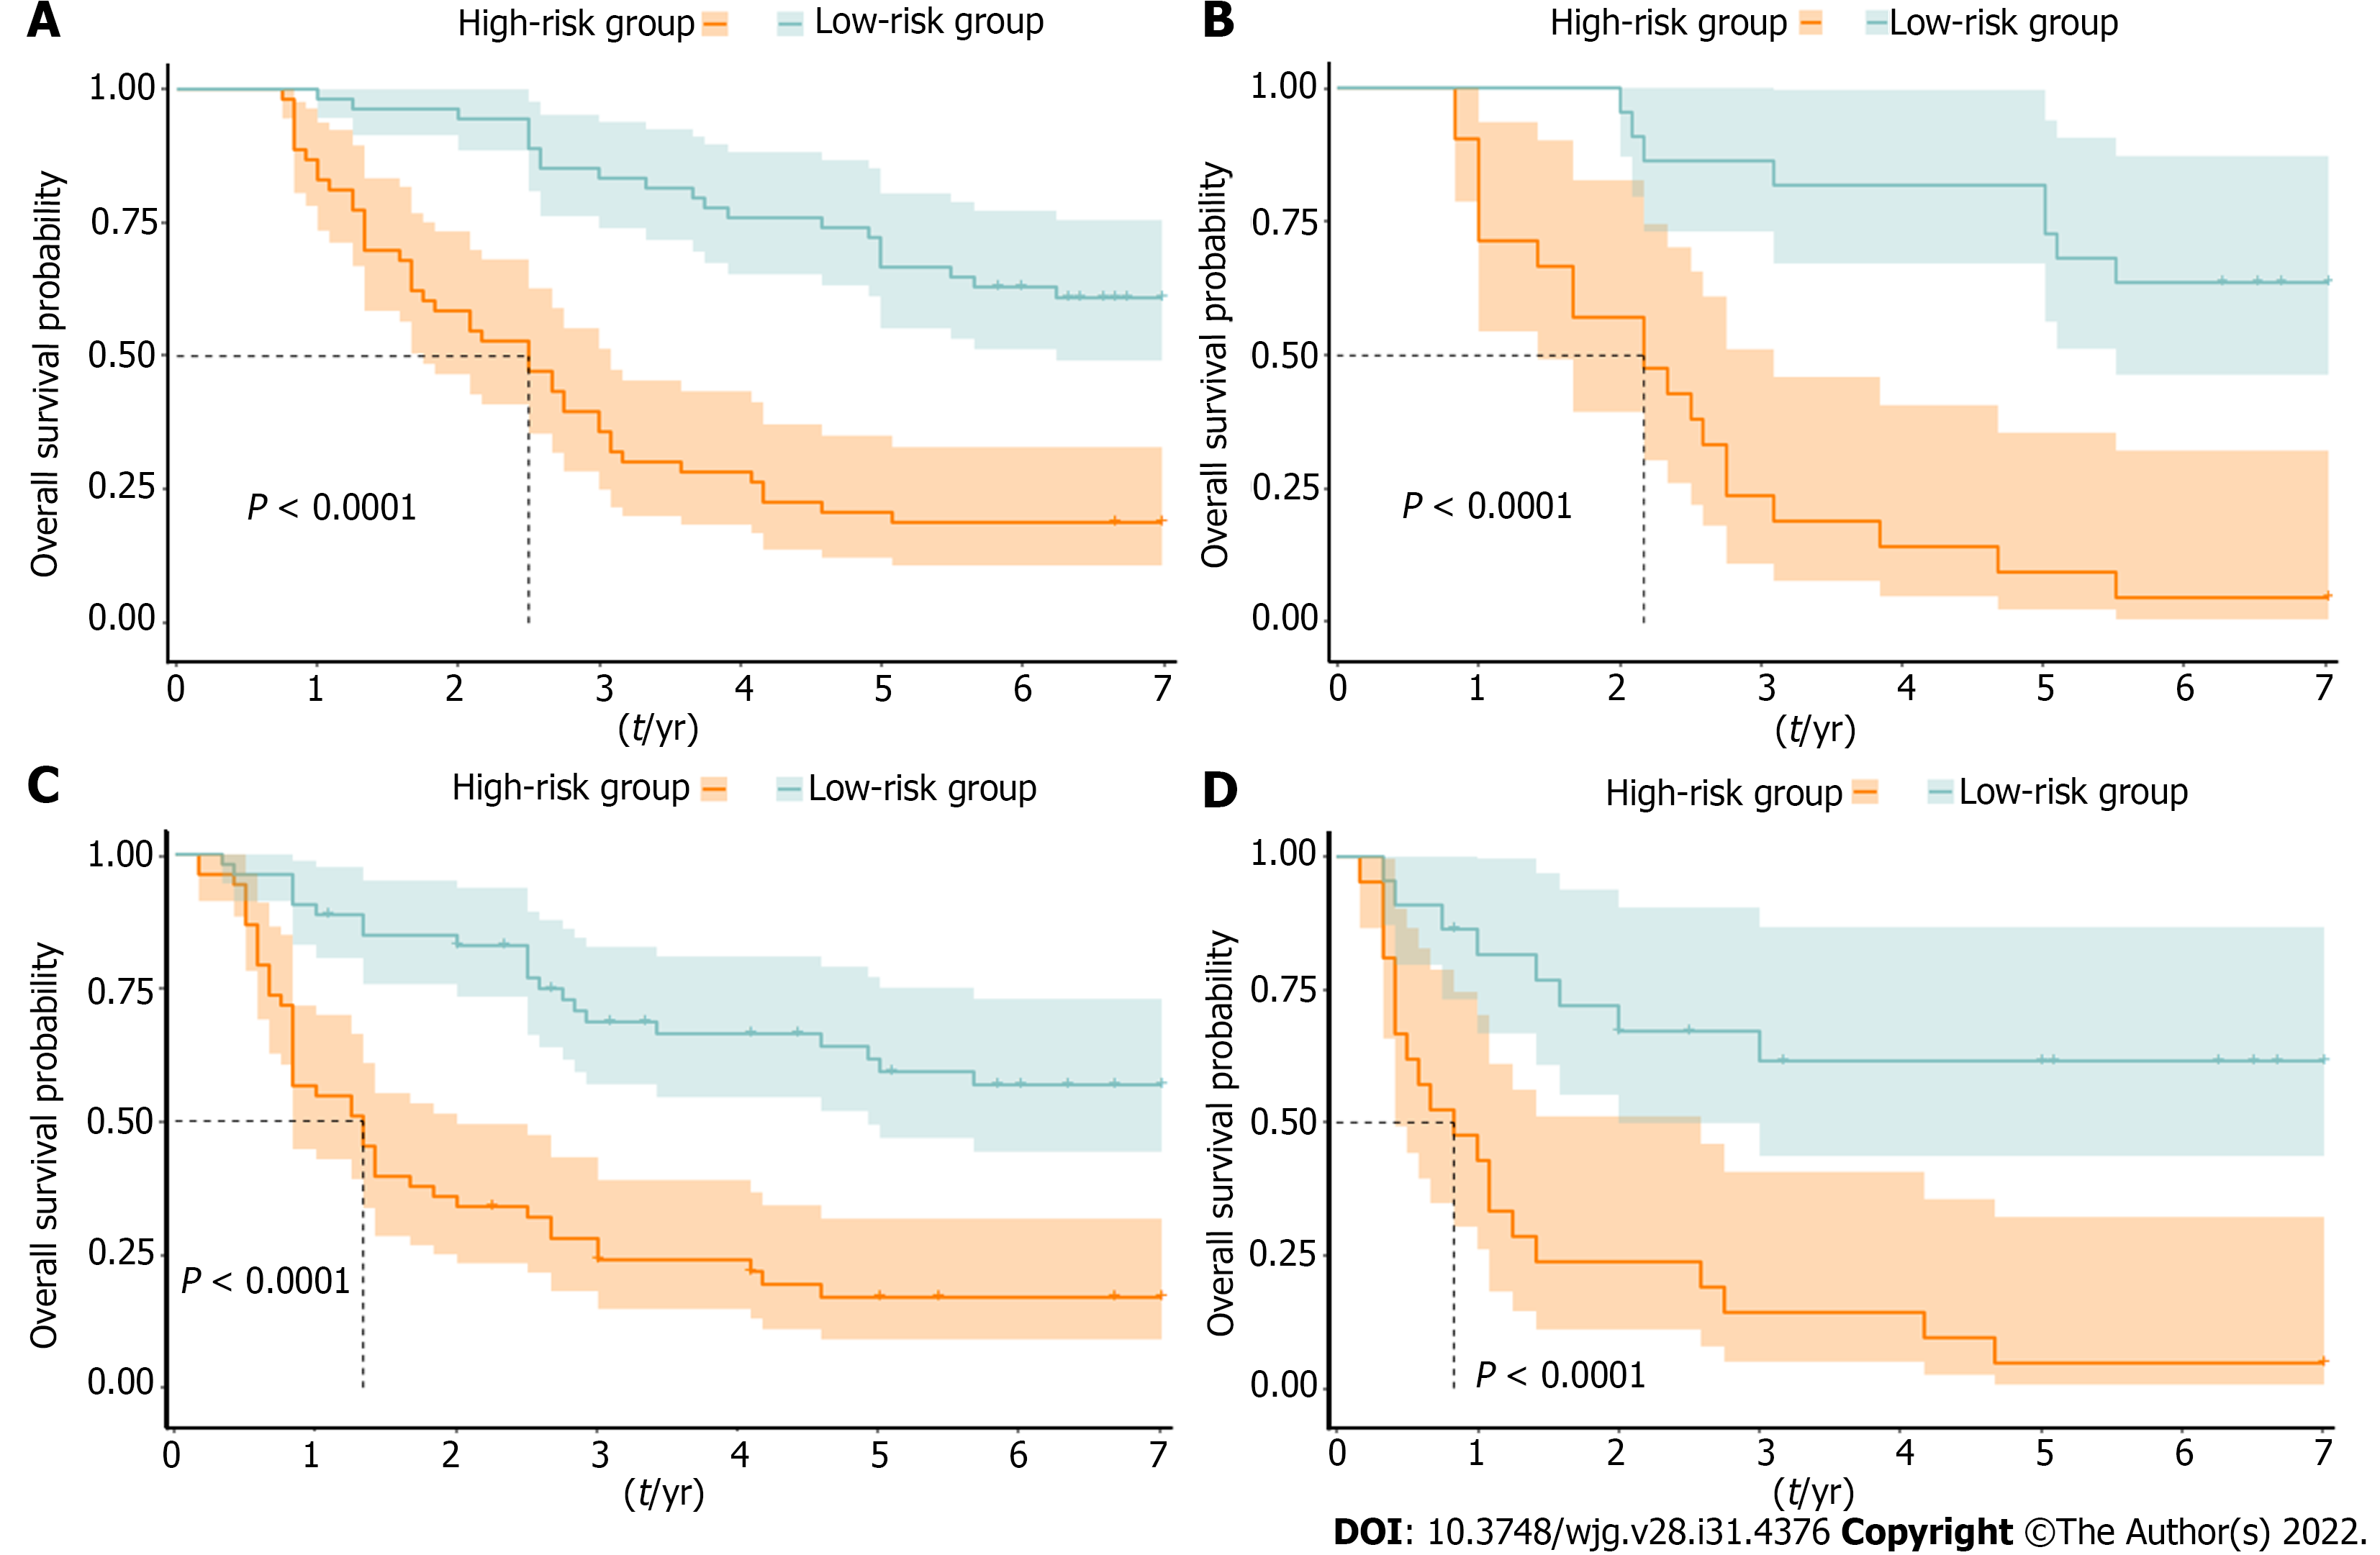
Figure 7 Risk stratification ability of the nomogram was estimated by the Kaplan–Meier method and log-rank test in the training and validation cohorts.
A and B: Kaplan–Meier curves between the low- and high-risk subgroups of overall survival in the training cohort (A) and validation cohort (B); C and D: Kaplan–Meier curves between the low- and high-risk subgroups of disease-free survival in the training cohort (C) and validation cohort (D). Patients with hepatocellular carcinoma in the training and validation cohorts were divided into low- and high-risk subgroups according to whether the total points of each patient were lower or higher than the median points of each cohort.
- Citation: Deng PZ, Zhao BG, Huang XH, Xu TF, Chen ZJ, Wei QF, Liu XY, Guo YQ, Yuan SG, Liao WJ. Preoperative contrast-enhanced computed tomography-based radiomics model for overall survival prediction in hepatocellular carcinoma. World J Gastroenterol 2022; 28(31): 4376-4389
- URL: https://www.wjgnet.com/1007-9327/full/v28/i31/4376.htm
- DOI: https://dx.doi.org/10.3748/wjg.v28.i31.4376


