Copyright
©The Author(s) 2022.
World J Gastroenterol. Aug 21, 2022; 28(31): 4310-4327
Published online Aug 21, 2022. doi: 10.3748/wjg.v28.i31.4310
Published online Aug 21, 2022. doi: 10.3748/wjg.v28.i31.4310
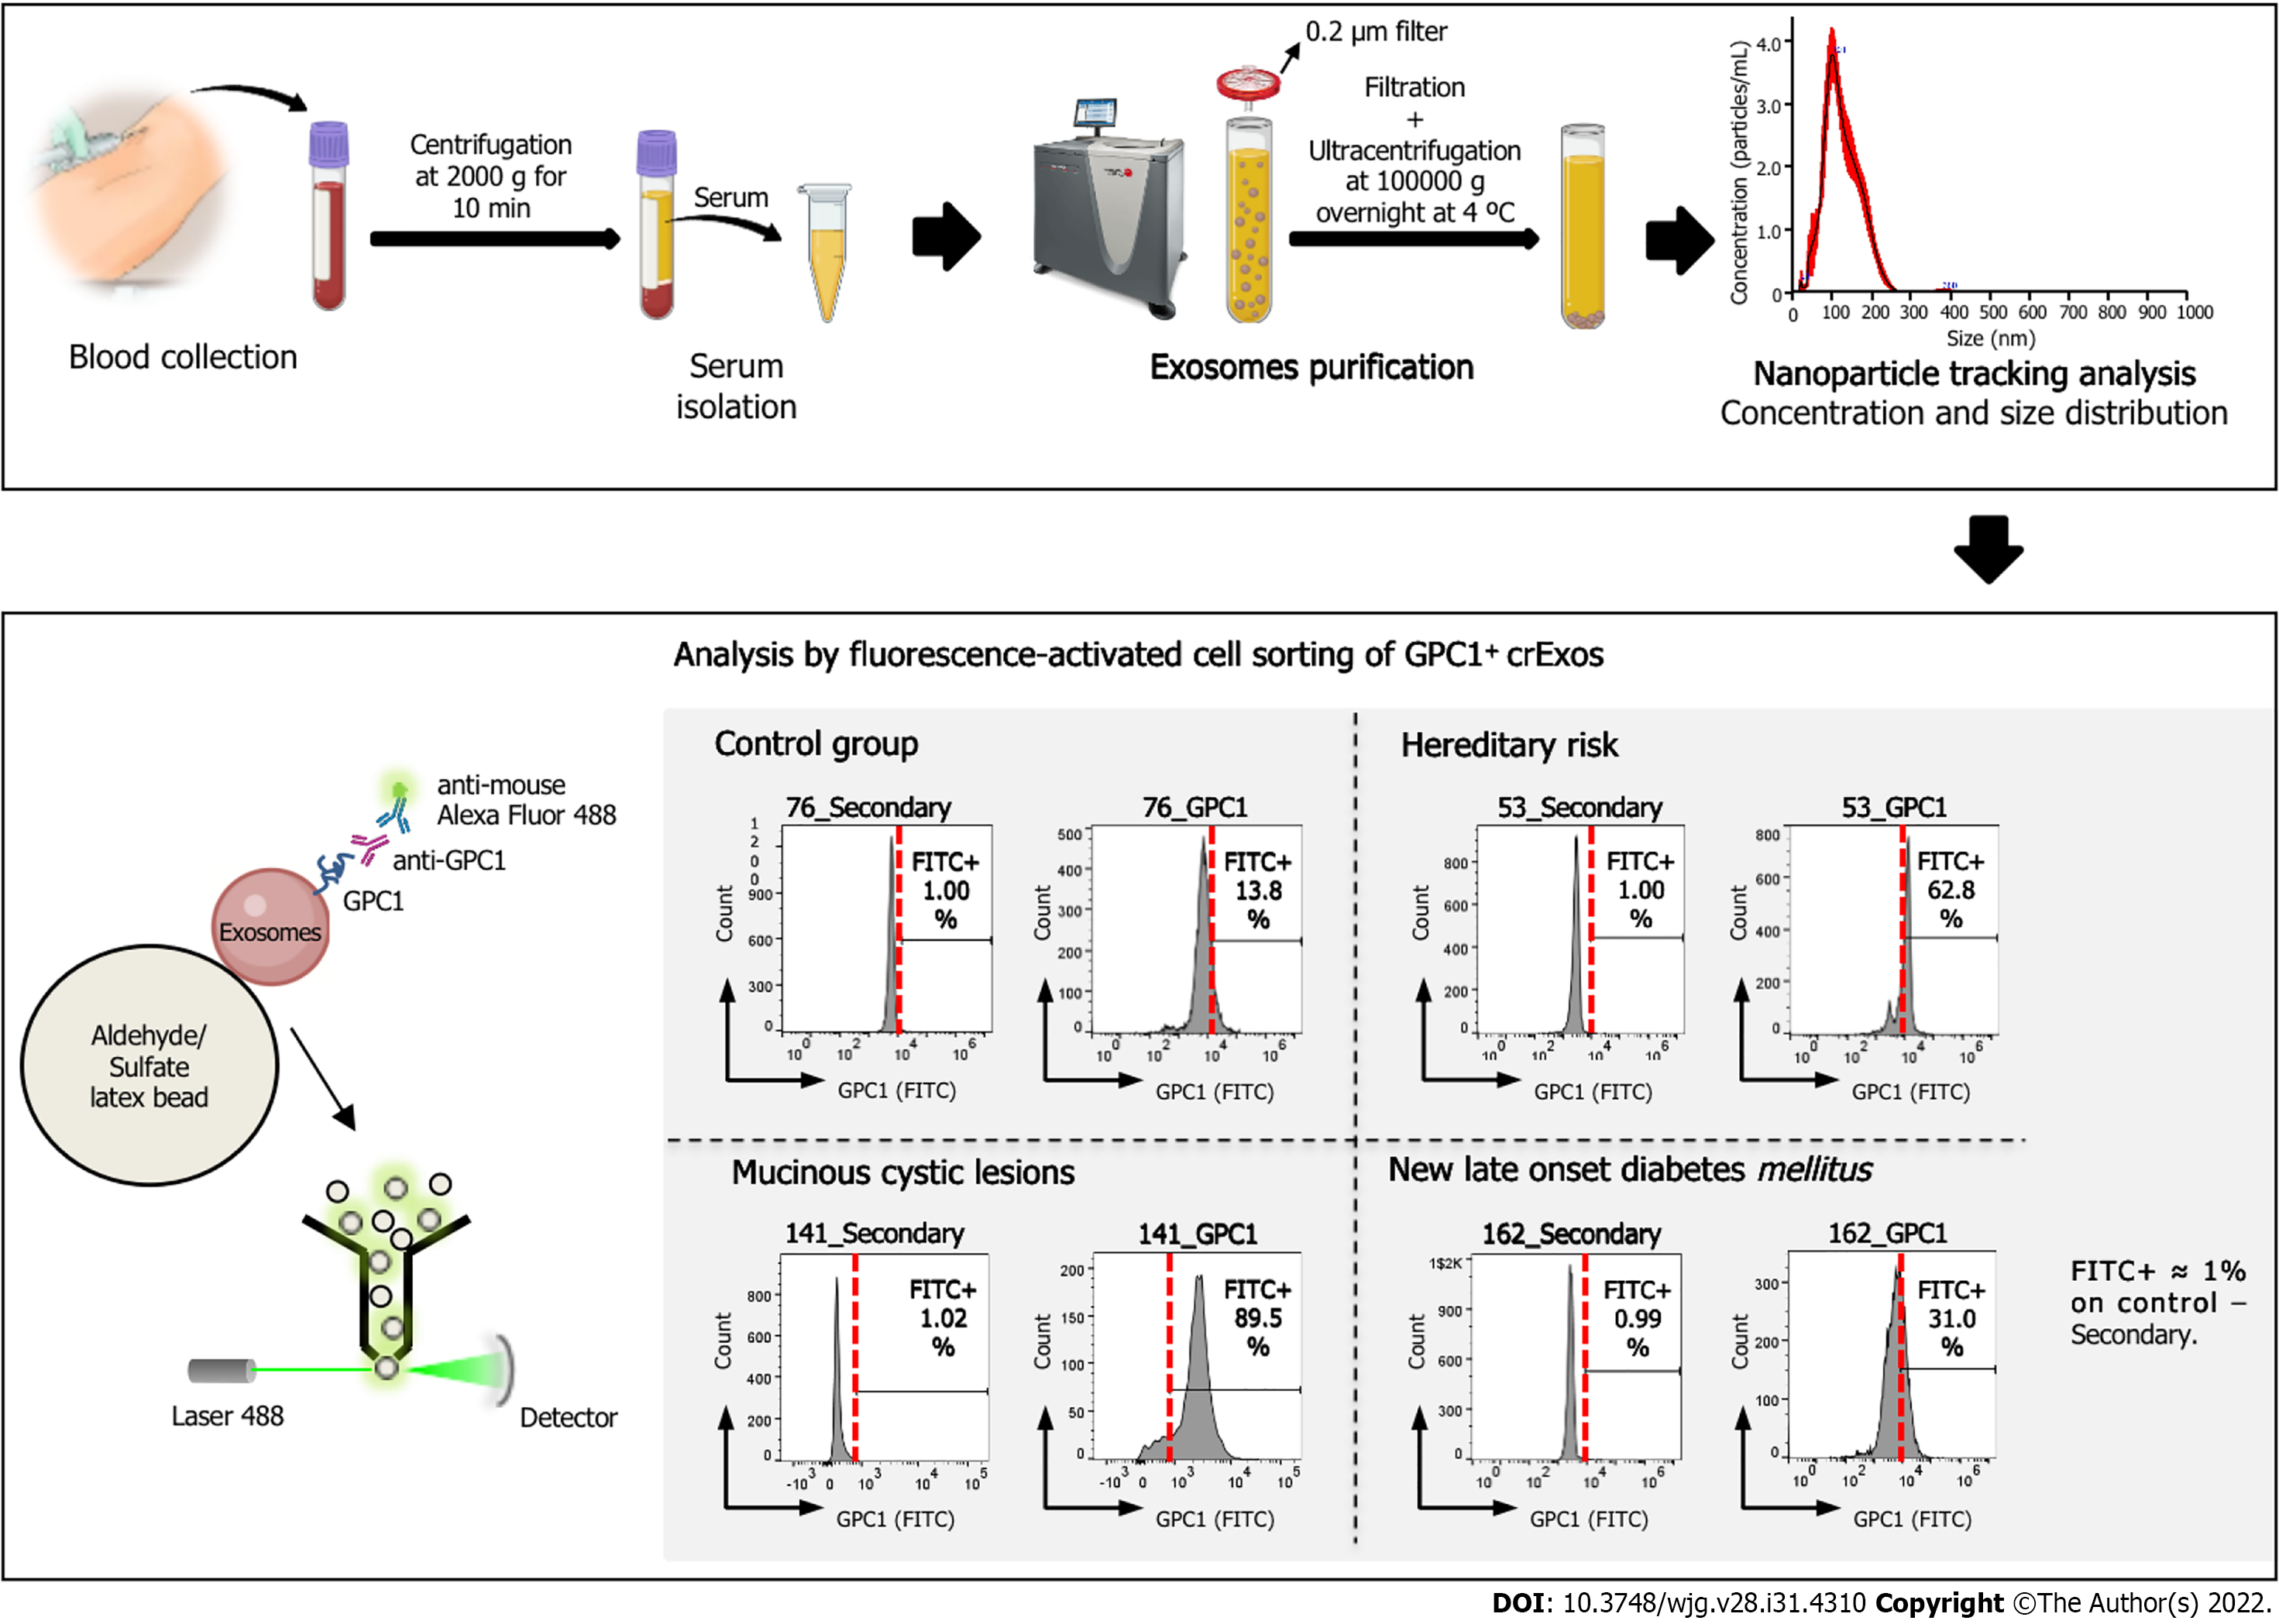
Figure 1 Schematic representation of the workflow for the analysis of circulating exosomes from control group, mucinous cystic lesions, hereditary risk and new-late onset diabetes mellitus patients for the expression of glypican-1.
Scheme illustrating the workflow of our study of the expression of glypican-1 (GPC1) on exosomes retrieved from patients’ blood samples, from blood collection to the analysis by flow cytometry of GPC1+ circulating exosomes (crExos). A representative histogram of the percentage of beads bound to GPC1-positive crExos (GPC1+ crExos) that were isolated from the serum of a control group, composed by individuals submitted to endoscopic ultrasound for other reasons than pancreatic pathology, as well as the following pancreatic ductal adenocarcinoma risk groups: Mucinous cystic lesions, hereditary risk, and new-late onset diabetes mellitus. Red dashed lines in each histogram depict the start of the fluorescein isothiocyanate (FITC)-positive gate (anti-immunoglobulin G) Alexa Fluor 488), which was determined for each patient separately by considering FITC+ approximately 1% on control–secondary–but maintained between control and GPC1 samples. GPC1: Glypican-1; FITC: Fluorescein isothiocyanate; crExos: Circulating exosomes.
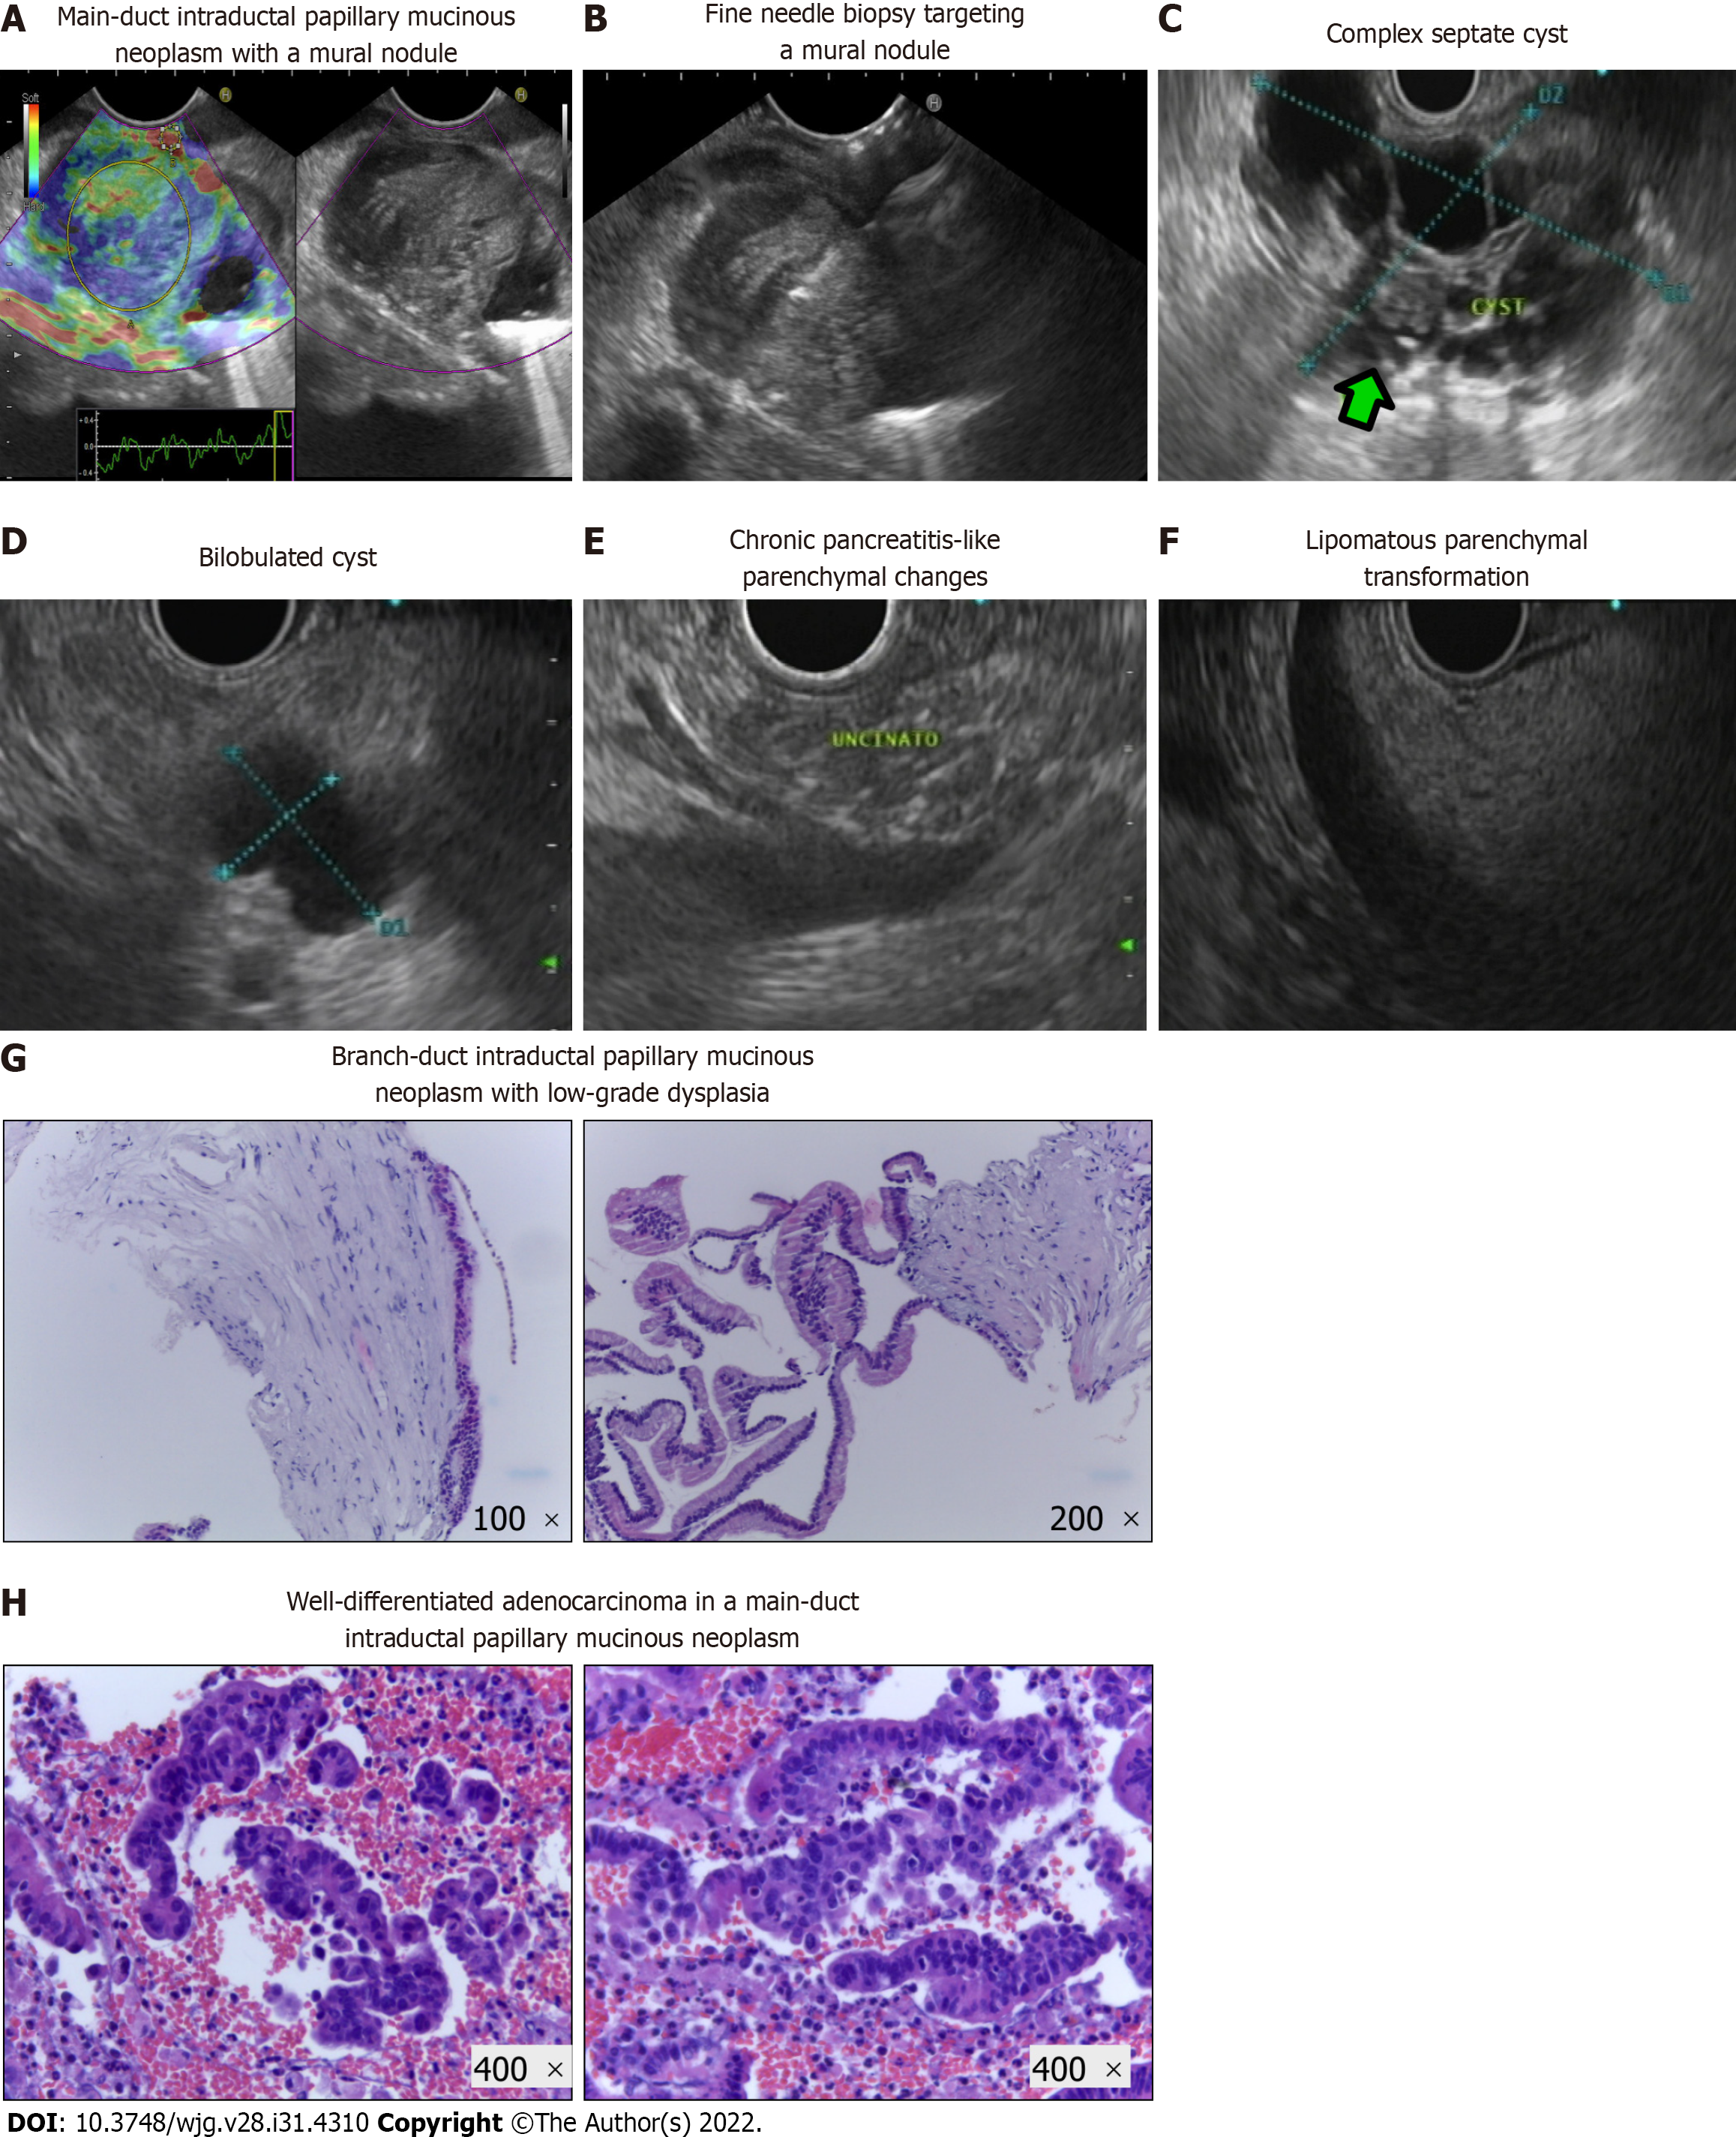
Figure 2 Pancreatic abnormalities in endoscopy ultrasound examination and pathological exams of endoscopic ultrasound-guided fine needle aspiration/biopsy specimens from intraductal papillary mucinous neoplasms.
A: Main-duct intraductal papillary mucinous neoplasm (MD-IPMN) with a large mural nodule, visualized in B-mode (right panel) and characterized with qualitative elastography (left panel) that revealed areas of hard consistency (blue color); B: Endoscopic ultrasound-guided fine needle biopsy with a 22 G needle targeting the harder lesions in the described mural nodule (pathological exam showed malignant degeneration); C: Complex septate cyst with areas of wall focal thickenings and a mural nodule (green arrow); D: Simple bilobulated cyst without worrisome features or high-risk stigmata; E: Chronic pancreatitis-like parenchymal changes (lobulation, hyperechoic foci, and strands); F: Homogenous hyperechogenic appearance of pancreatic parenchyma suggestive of lipomatous transformation; G: Branch-duct IPMN with low-grade dysplasia [hematoxylin and eosin (H&E)-stained cellblock]. These images show the wall of a cystic lesion, partly lined by a cylindrical mucosecretory epithelium with low-grade atypia (left: 100 ×; right: 200 ×); H: Well-differentiated adenocarcinoma originated in a MD-IPMN (H&E-stained cellblock: 400 ×). These images show an epithelial neoplasm with marked architectural disorganization and severe cytological atypia. The cells have a high nucleus-cytoplasmic ratio, with anisokaryosis, irregular nuclei with coarse chromatin and some with an exuberant nucleolus.
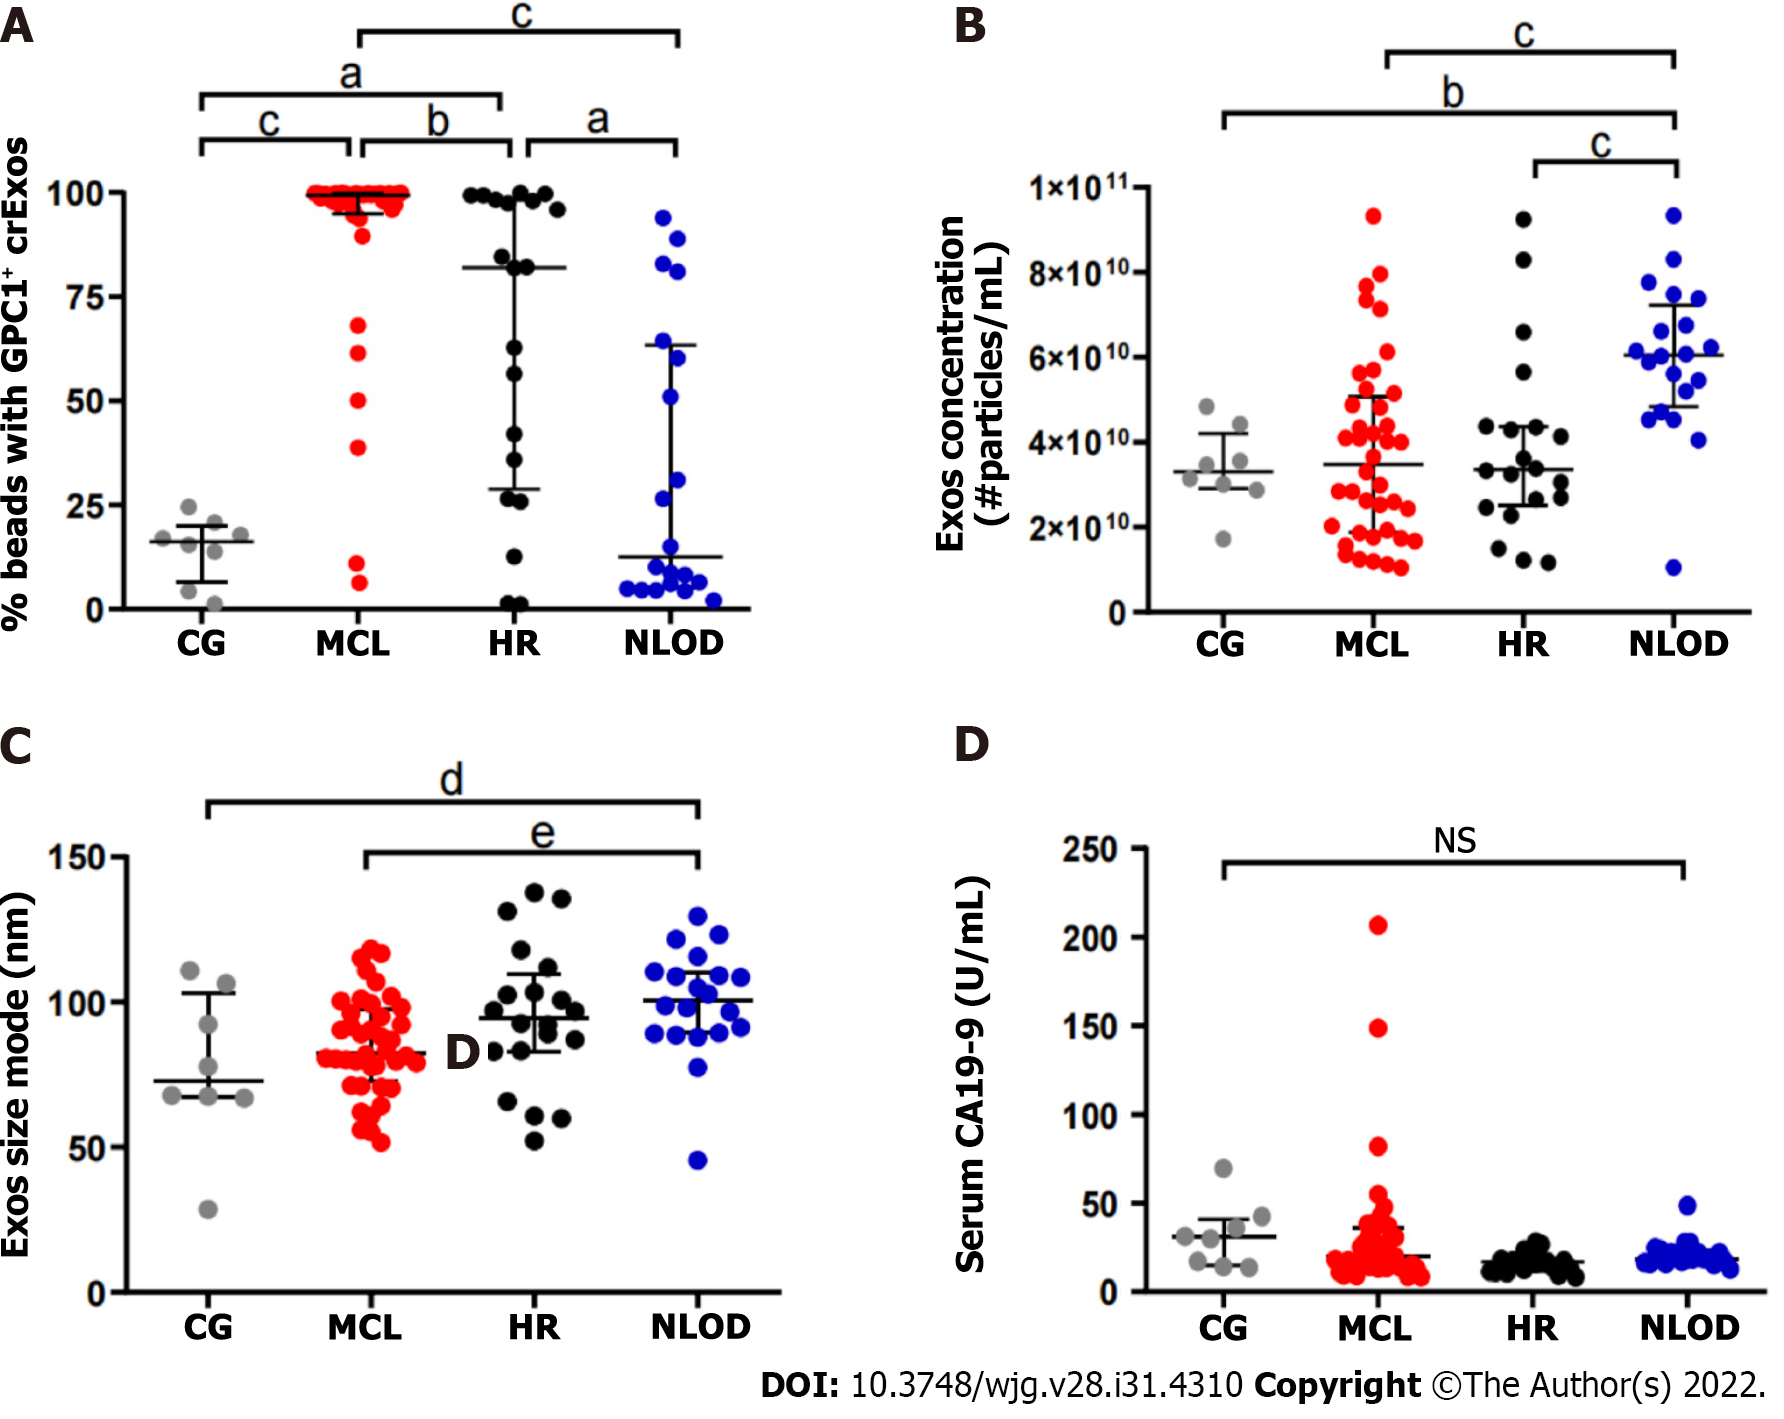
Figure 3 Glypican-1-positive circulating exosomes levels are different among the studied groups, whereas the levels of carbohydrate antigen 19-9 do not differ and are within the normal range in the entire population.
A: Scatter dot plot representing the percentage of beads bound to glypican-1-positive exosomes (GPC1+ crExos) in the control group (CG) (n = 8), mucinous cystic lesions (MCLs) (n = 40), hereditary risk (HR) (n = 20) and new-late onset diabetes mellitus (NLOD) (n = 20), (Mann-Whitney U Test, aP < 0.02, bP = 0.005, cP < 0.001); B: Scatter dot plot representing exosomes concentration measured by nanoparticle tracking analysis depicting the number of exosomes/0.666 mL serum derived from CG (n = 8), MCL (n = 40), HR (n = 20), and NLOD (n = 20) donors (Mann-Whitney U Test, bP = 0.005, cP < 0.001); C: Scatter dot plot representing exosomes mode size distribution determined by nanoparticle tracking analysis from CG (n = 8), MCL (n = 40), HR (n = 20), and NLOD (n = 20) donors (Mann-Whitney U Test, dP = 0.018, eP = 0.04); D: Scatter dot plot representing the serum carbohydrate antigen 19-9 concentration (U/mL) as determined by enzyme-linked immunoassay in CG (n = 8), MCL (n = 40), HR (n = 20), and NLOD (n = 20), (Kruskal-Wallis Test, P = NS). Data are shown as the median ± interquartile range. NS: Non-significant; GPC1: Glypican-1; CA 19-9: Carbohydrate antigen 19-9; crExos: Circulating exosomes.
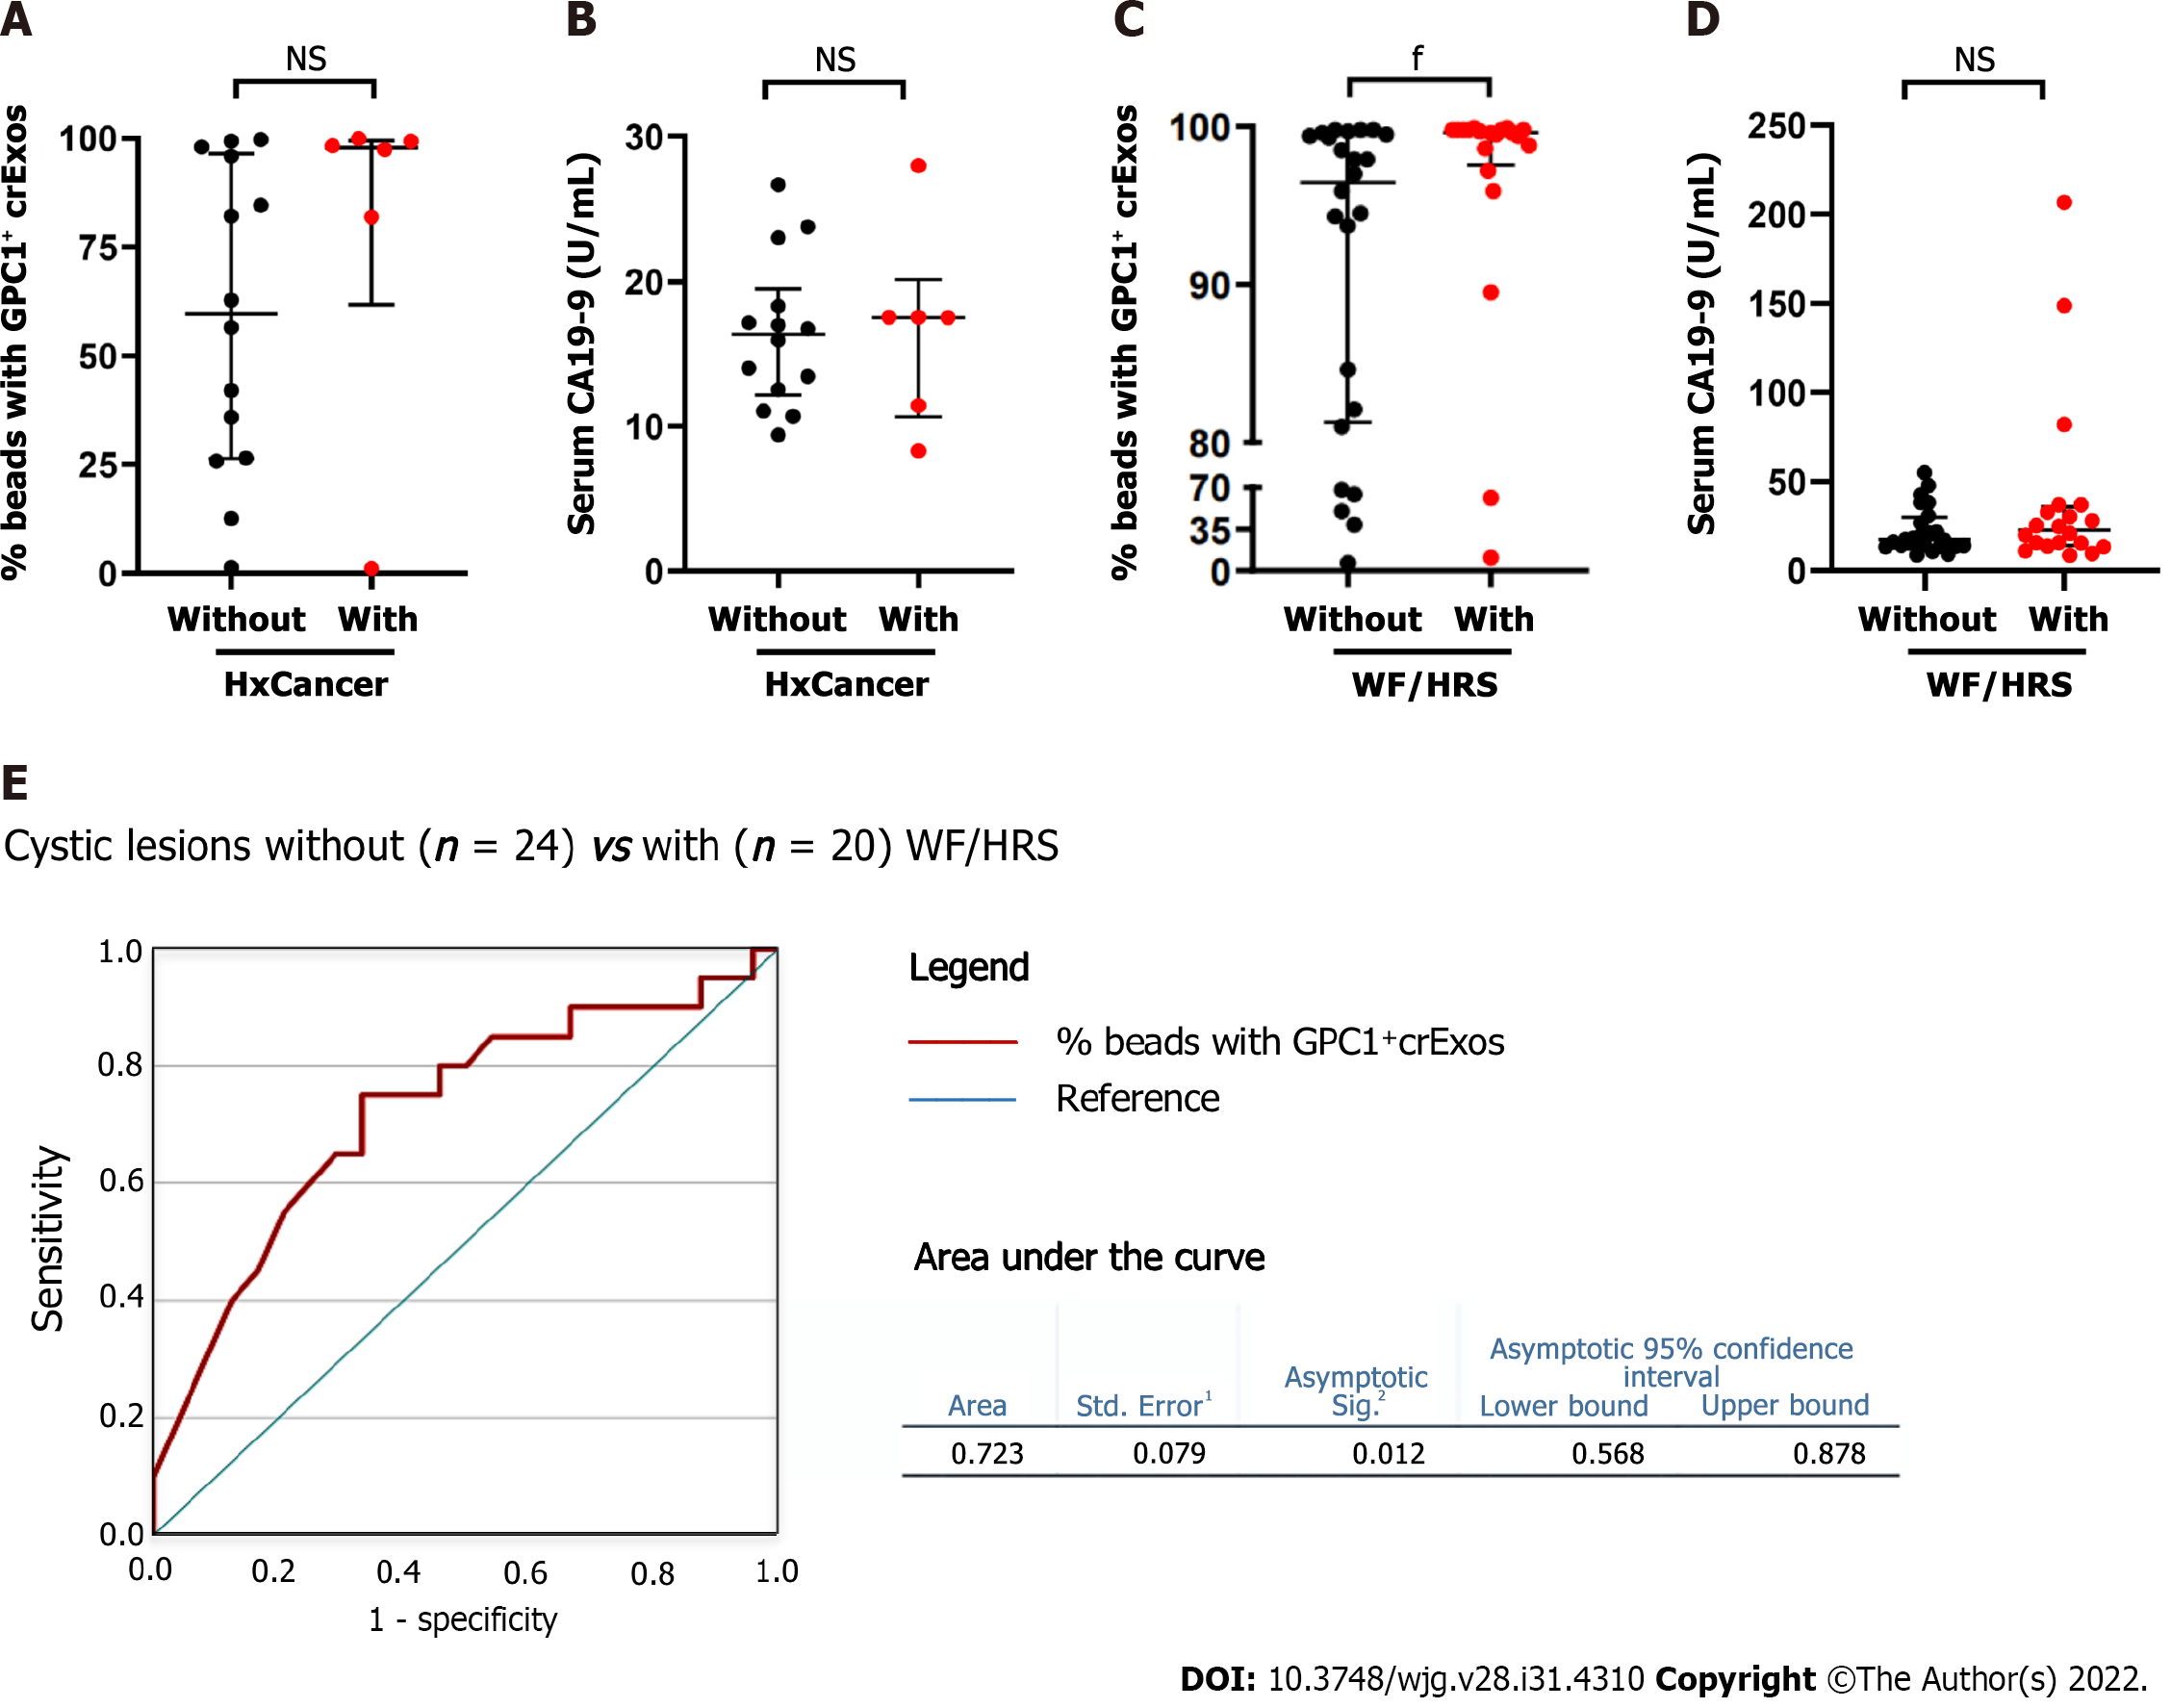
Figure 4 Glypican-1-positive circulating exosomes are higher in individuals with personal history of cancer within the hereditary risk group, and among patients harboring pancreatic cystic lesions when worrisome features/high-risk stigmata are present.
A: Scatter dot plot representing the percentage of beads bound to glypican-1 (GPC1)-positive circulating exosomes (GPC1+ crExos) in subjects in the hereditary risk (HR) group, without (n = 14) and with (n = 6) a personal history of cancer (HxCancer) [Mann-Whitney U Test, P = non-significant (NS)]; B: Scatter dot plot representing the serum carbohydrate antigen 19-9 (CA 19-9) concentration (U/mL) as determined by enzyme-linked immunoassay (ELISA) in subjects in the HR group, without (n = 14) and with (n = 6) HxCancer (Mann-Whitney U Test, P = 0.21); C: Scatter dot plot representing the percentage of GPC1+ crExos coupled to beads in subjects harboring pancreatic cystic lesions, without (n = 24) and with (n = 20) worrisome features (WF) or high-risk stigmata (HRS) (Mann-Whitney U Test, fP = 0.011); D: Scatter dot plot representing the serum CA 19-9 concentration (U/mL) as determined by ELISA in subjects harboring pancreatic cystic lesions, without (n = 24) and with (n = 20) WF/HRS (Mann-Whitney U Test, P = NS); E: Receiver operating characteristic curve of the cohort of pancreatic cystic lesions without (n = 24) or with (n = 20) WF/HRS, regarding the GPC1+ crExos levels (% beads with GPC1+ crExos). 1Under nonparametric assumption; 2Null hypothesis: True area = 0.5. Data are shown as the median ± interquartile range. NS: Non-significant; GPC1: Glypican-1; crExos: Circulating exosomes; WF: Worrisome features; HRS: High-risk stigmata.
- Citation: Moutinho-Ribeiro P, Batista IA, Quintas ST, Adem B, Silva M, Morais R, Peixoto A, Coelho R, Costa-Moreira P, Medas R, Lopes S, Vilas-Boas F, Baptista M, Dias-Silva D, Esteves AL, Martins F, Lopes J, Barroca H, Carneiro F, Macedo G, Melo SA. Exosomal glypican-1 is elevated in pancreatic cancer precursors and can signal genetic predisposition in the absence of endoscopic ultrasound abnormalities. World J Gastroenterol 2022; 28(31): 4310-4327
- URL: https://www.wjgnet.com/1007-9327/full/v28/i31/4310.htm
- DOI: https://dx.doi.org/10.3748/wjg.v28.i31.4310


