Copyright
©The Author(s) 2022.
World J Gastroenterol. Aug 7, 2022; 28(29): 3903-3916
Published online Aug 7, 2022. doi: 10.3748/wjg.v28.i29.3903
Published online Aug 7, 2022. doi: 10.3748/wjg.v28.i29.3903
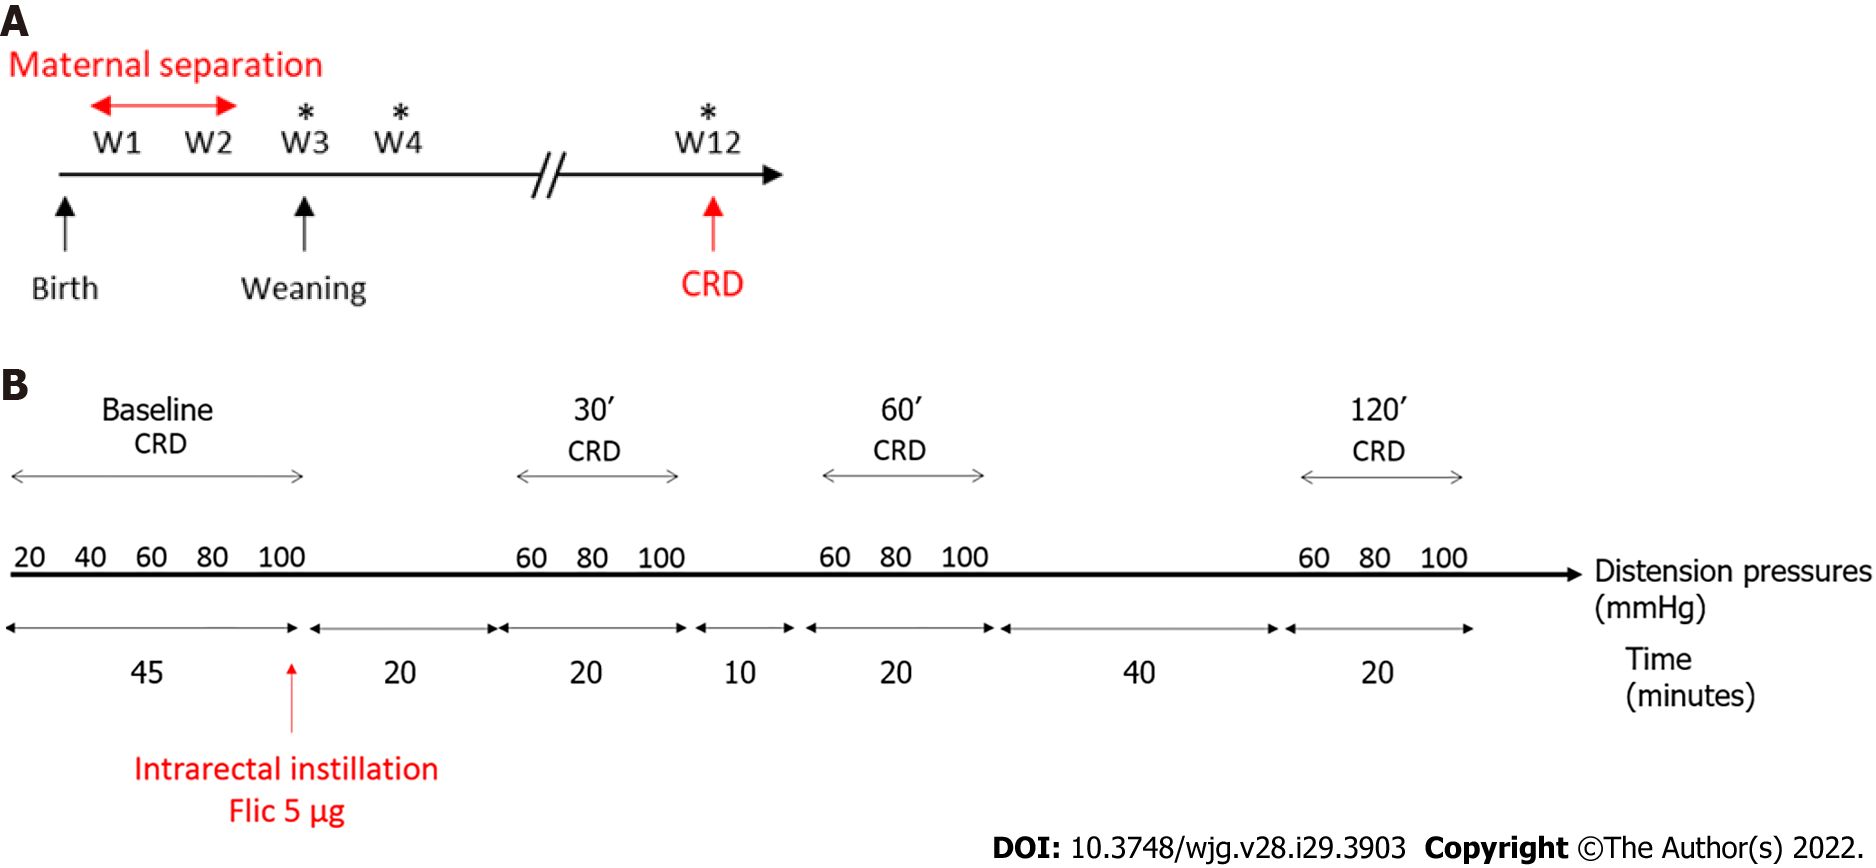
Figure 1 Time course protocols used in this study.
A: Time course protocol for neonatal maternal separation experiment; B: Time course protocol for flagellin intrarectal instillation experiment. *Feces sample collection for Next Generation Sequencing; CRD: Colorectal distention test.
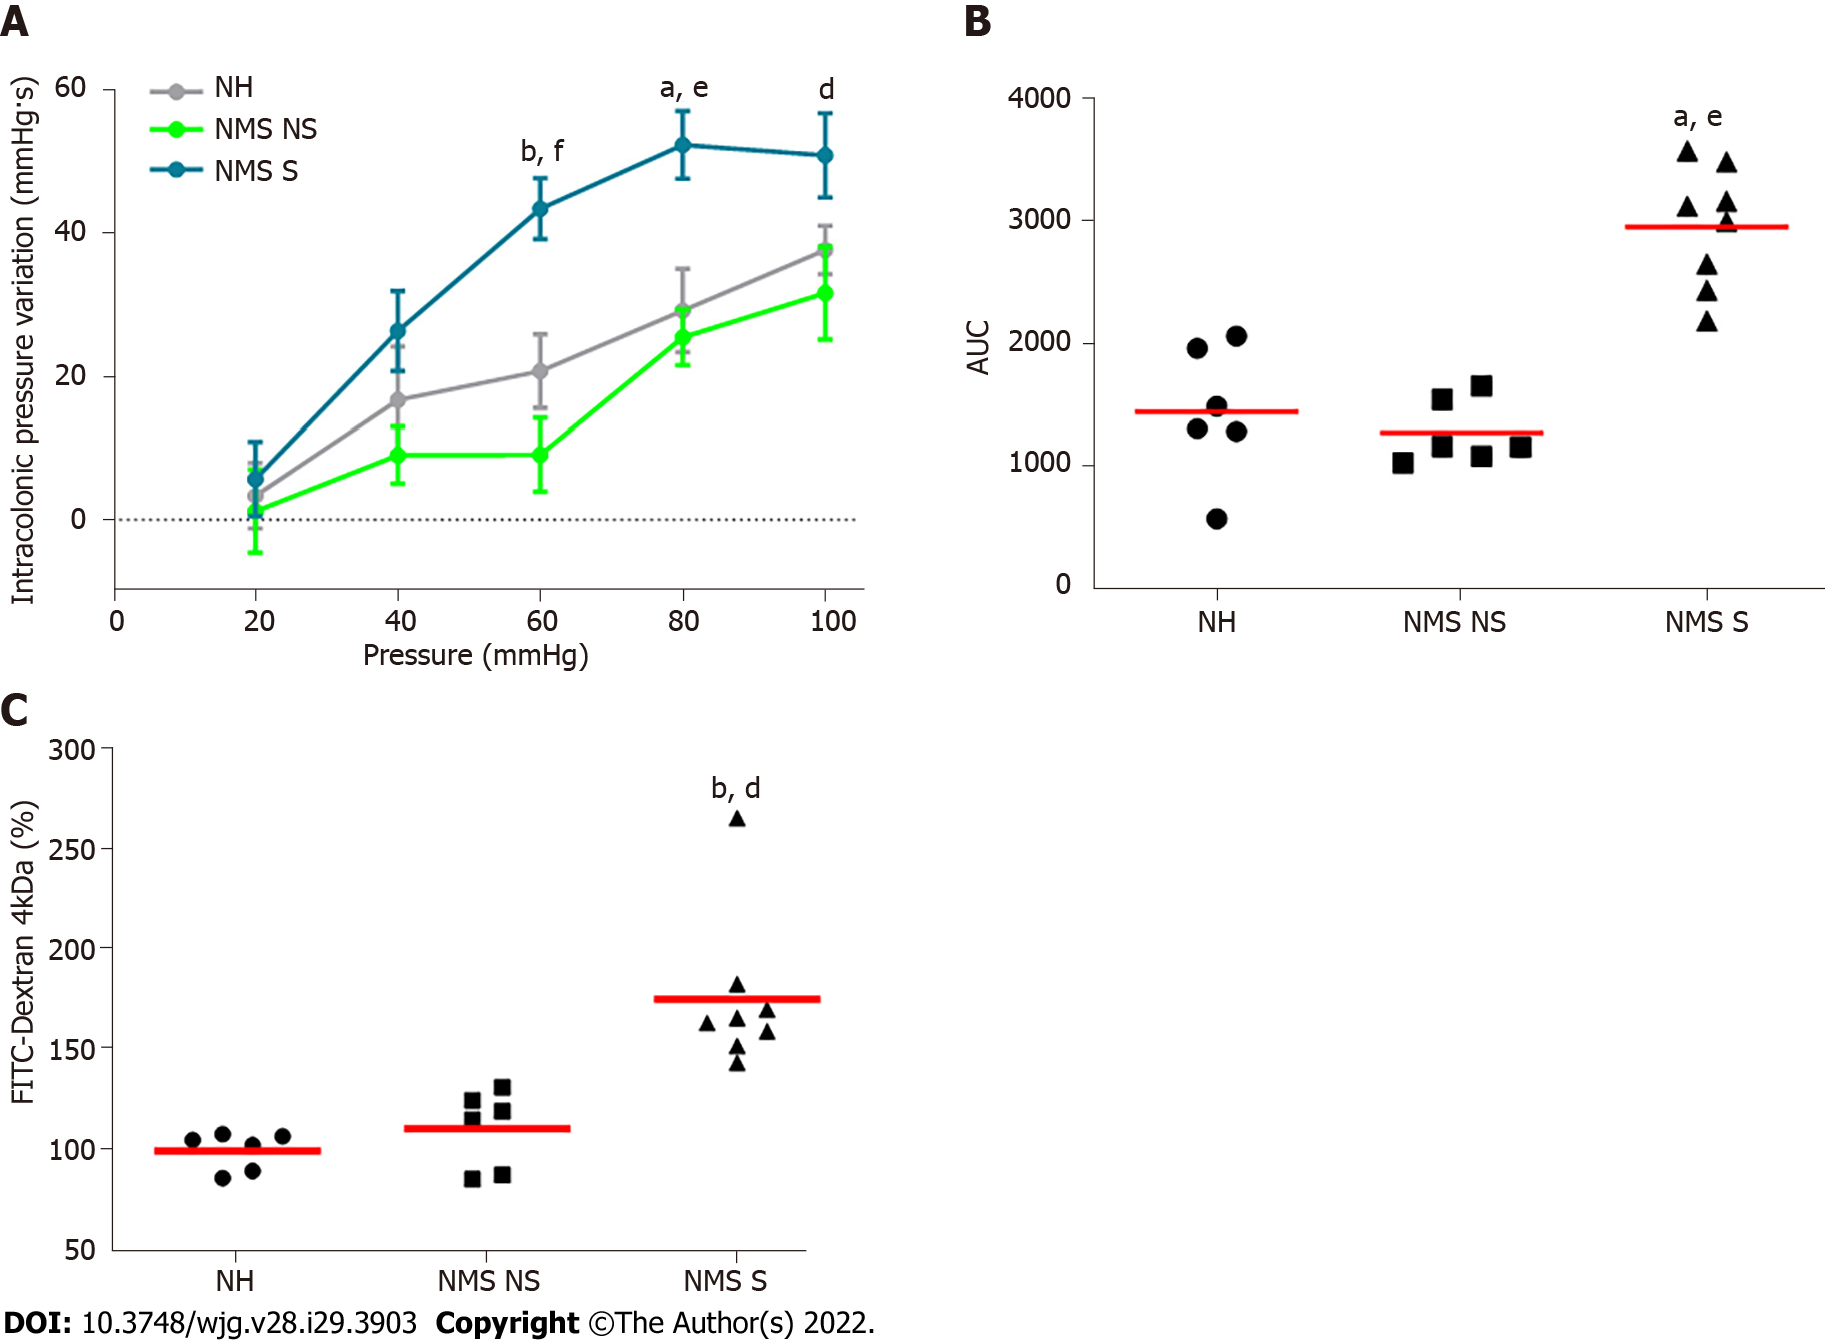
Figure 2 Neonatal maternal separation induces colonic hypersensitivity and increases intestinal permeability in mice.
A: Intracolonic pressure variation (IPV) in response to colorectal distension in non-handled (NH), neonatal maternal separated non-sensitized (NMS NS) and neonatal maternal separated sensitized (NMS S) mice; B: Area under the curve (AUC) of the IPV relative to colorectal distension for each NH, NMS NS and NMS S mouse; C: FITC-dextran 4 kDa plasmatic concentrations, 3 h after oral gavage with 15 mg of FITC-dextran of NH, NMS NS and NMS S mice. Values are expressed as a percentage of FITC-dextran per mL of plasma in comparison to the NH group mean. NH: n = 6; NMS NS: n = 6; NMS S: n = 8. aP < 0.05 and bP < 0.01 vs NH group; and dP < 0.05, eP < 0.01 and fP < 0.001 vs NMS NS group. For IPV to CRD test, dots represent means and error bars represent SEM. For AUC and FITC-dextran, each dot represents one mouse and red lines represent means.
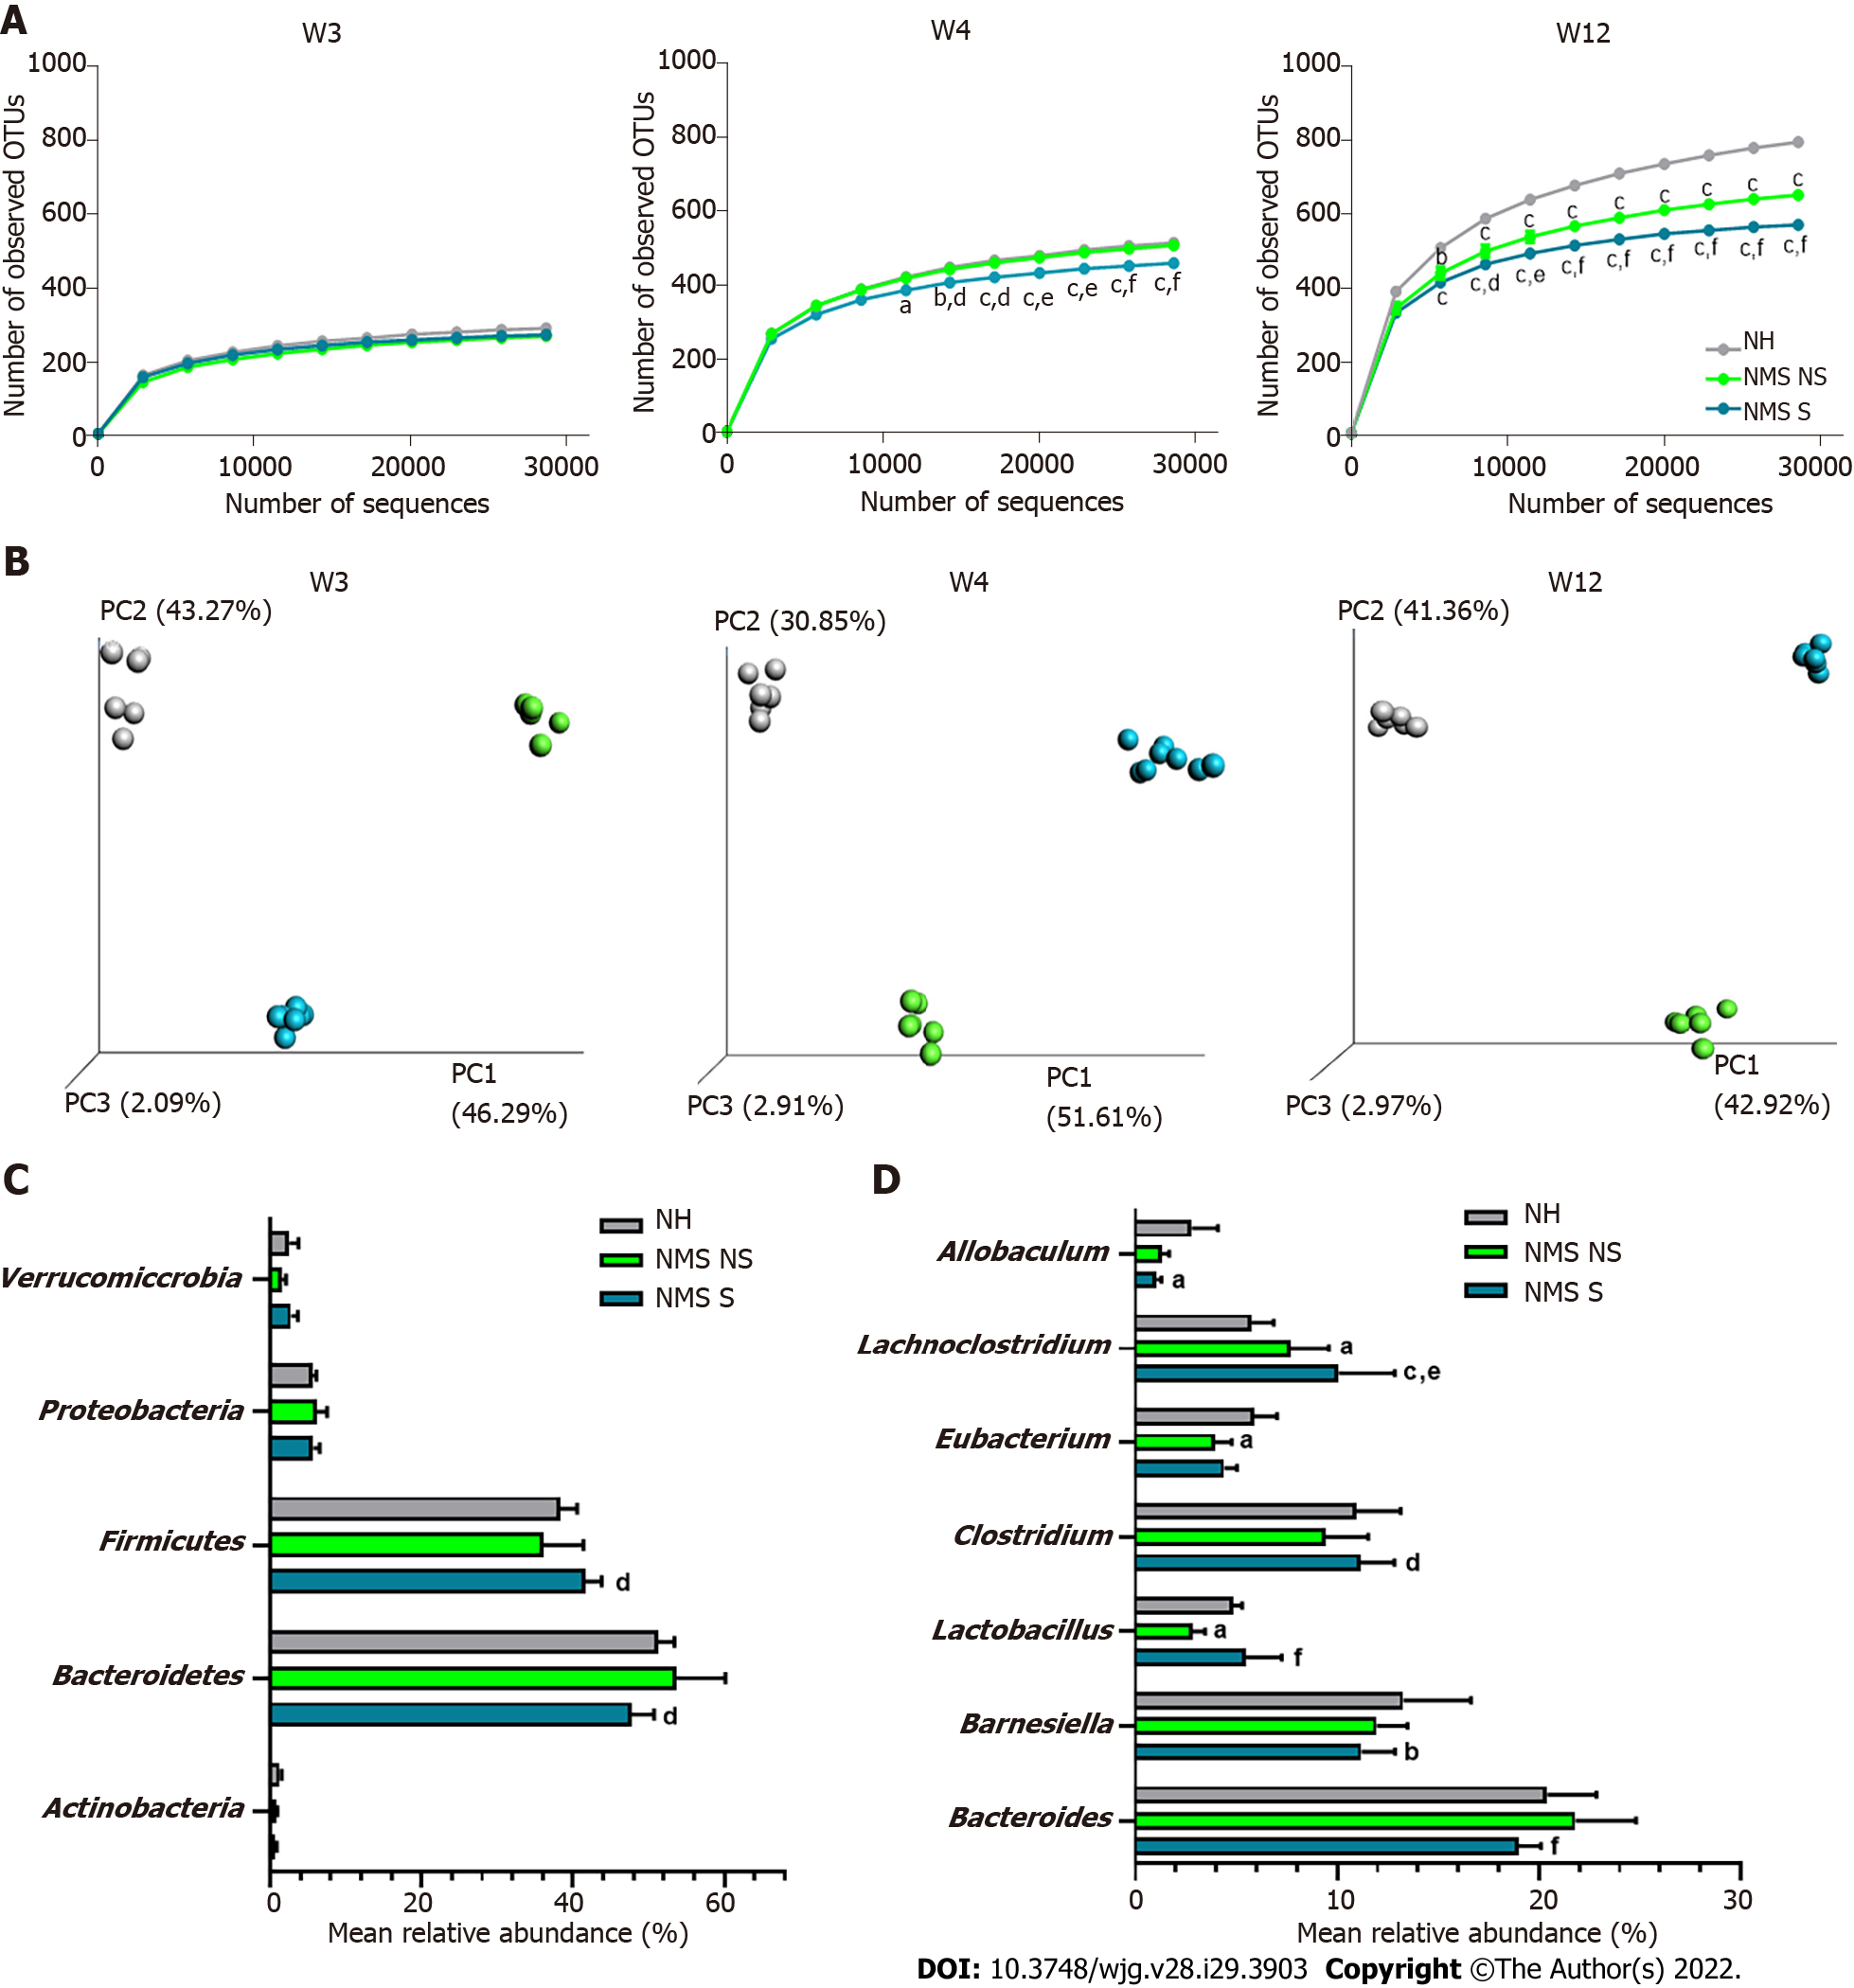
Figure 3 Neonatal maternal separation paradigm induces alterations of core fecal microbiota related to colonic hypersensitivity.
A: Alpha-diversity analysis of the core microbiota. Number of observed operational taxonomic units according to the number of sequences per samples of fecal samples from non-handled (NH), neonatal maternal separated non-sensitized (NMS NS) and neonatal maternal separated sensitized (NMS S) at week 3 (W3), week 4 (W4) and week 12 (W12); B: Beta-diversity analysis of the core microbiota. Principal coordinates analysis (PCoA) of unweighted UniFrac distances of NH, NMS NS and NMS S mice at W3, W4 and W12; C and D: Mean relative abundances of bacterial phyla (C) and genera (D) significantly altered by the NMS paradigm between NH, NMS NS and NMS S mice at W12. NH: n = 6; NMS NS: n = 6; NMS S: n = 8. aP < 0.05, bP < 0.01 and cP < 0.001 vs NH or dP < 0.05, eP < 0.01 and fP < 0.001 vs NMS NS groups respectively. For alpha-diversity analysis, dots represent means and error bars represent SEM. For PCoA analysis each dot represents one mouse.
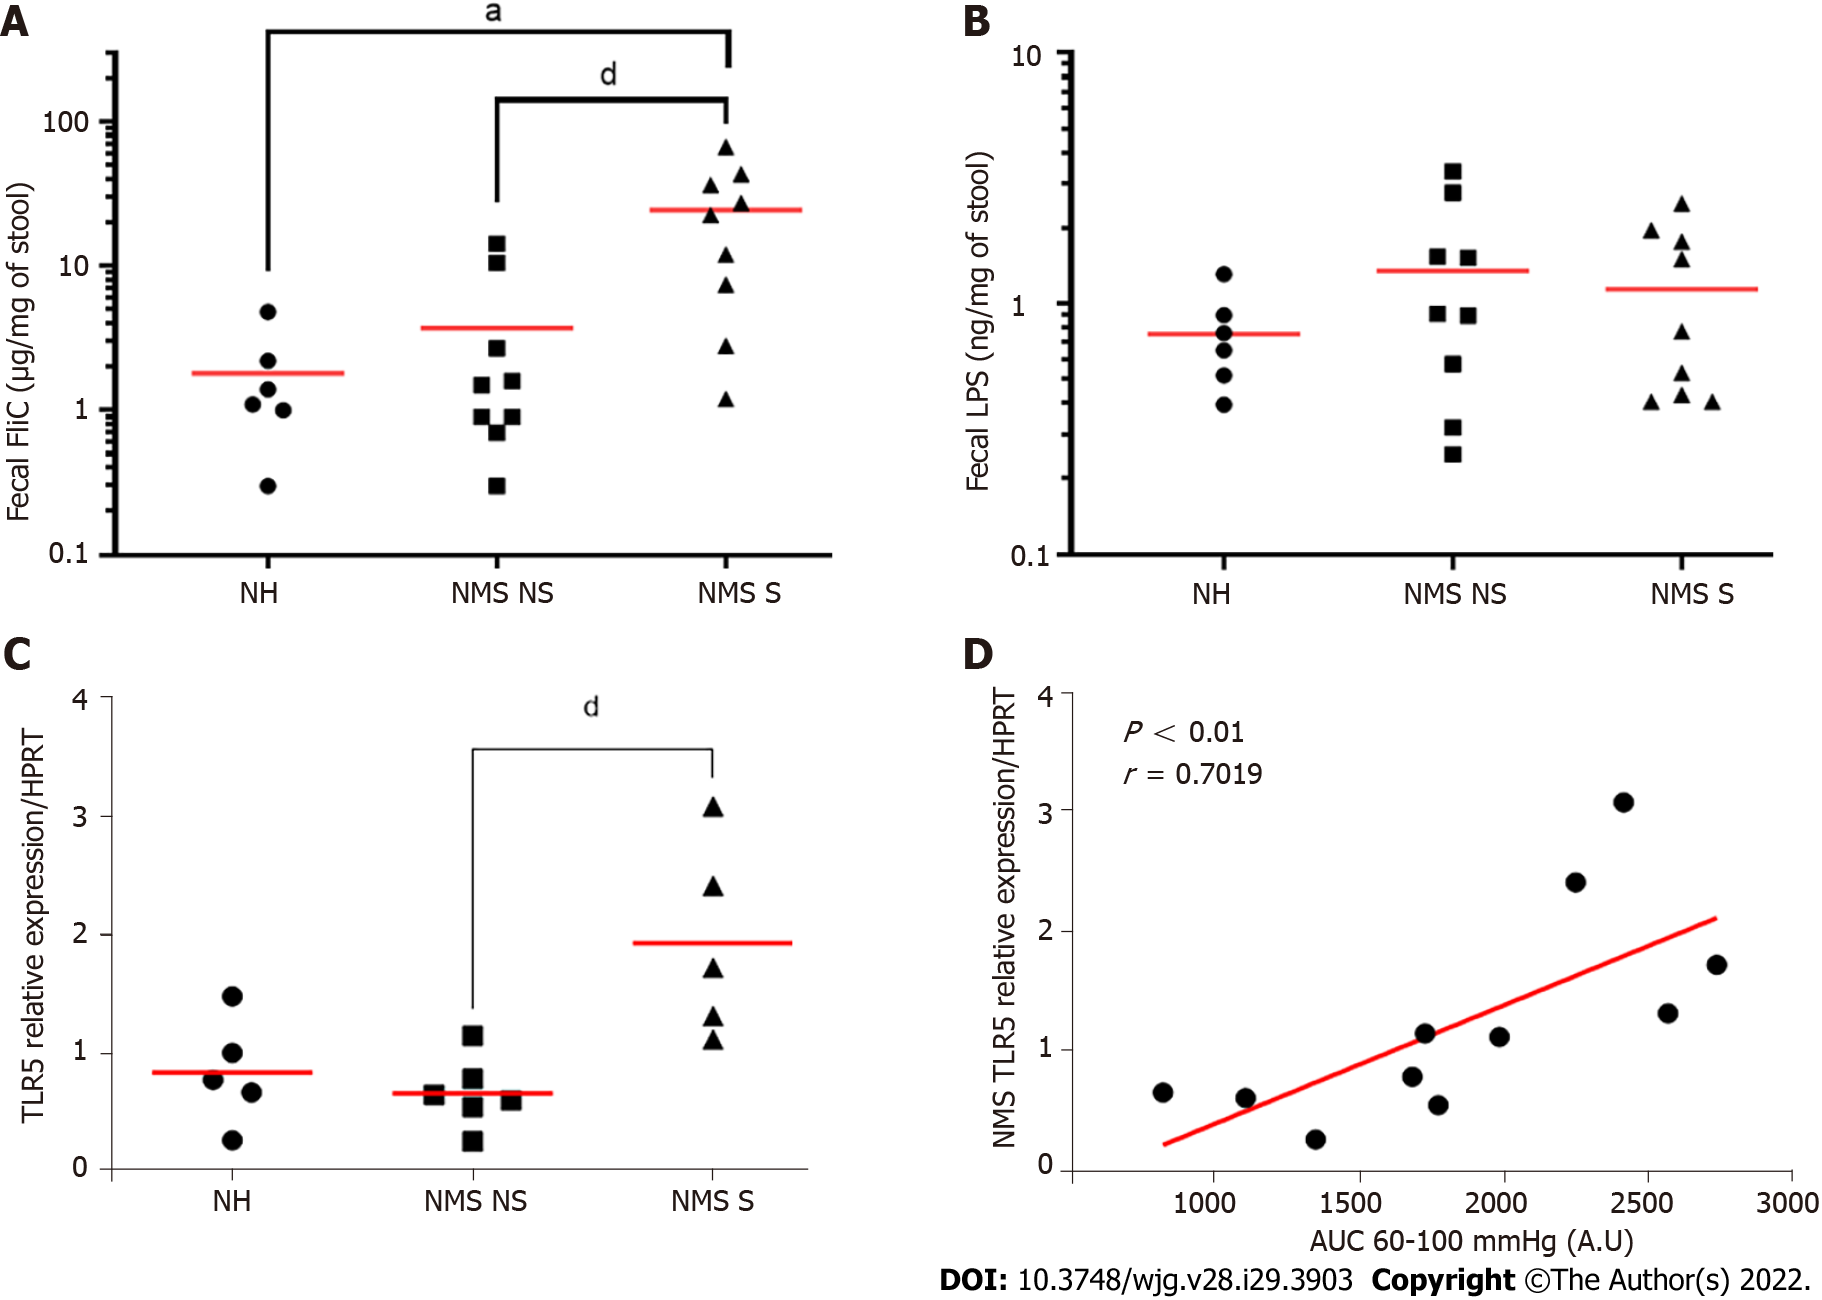
Figure 4 Neonatal maternal separation induced colonic hypersensitivity is associated with increased flagellin fecal content and colonocytes toll-like receptor 5 expression.
A: Levels of fecal flagellin (FliC) assayed with toll-like receptor 5 (TLR5) reporter cells; B: Levels of fecal lipopolysaccharide assayed with TLR4 reporter cells; C: Colonocytes mRNA expression of TLR5 in non-handled (NH), neonatal maternal separated non-sensitized (NMS NS) and neonatal maternal separated sensitized (NMS S) mice at week 12. Values are expressed as relative expression of TLR5 mRNA compared to HPRT expression; D: Correlation between NMS colonocytes TLR5 expression and area under the curve (AUC) corresponding of the intracolonic pressure variation (IPV) for highest colorectal distension pressures (60, 80 and 100 mmHg). A and B: NH: n = 6; NMS NS: n = 9; NMS S: n = 9. aP < 0.05 vs NH group; and dP < 0.05 vs NMS NS group. C and D: NH: n = 5; NMS NS: n = 6; NMS S: n = 5. dP < 0.05 vs NMS NS. For FliC quantification TLR5 mRNA relative expression, each dot represents one mouse and red lines represent means and for correlation between TLR5 expression and AUC of IPV, each dot represents one mouse and red line represents the linear regression curve.
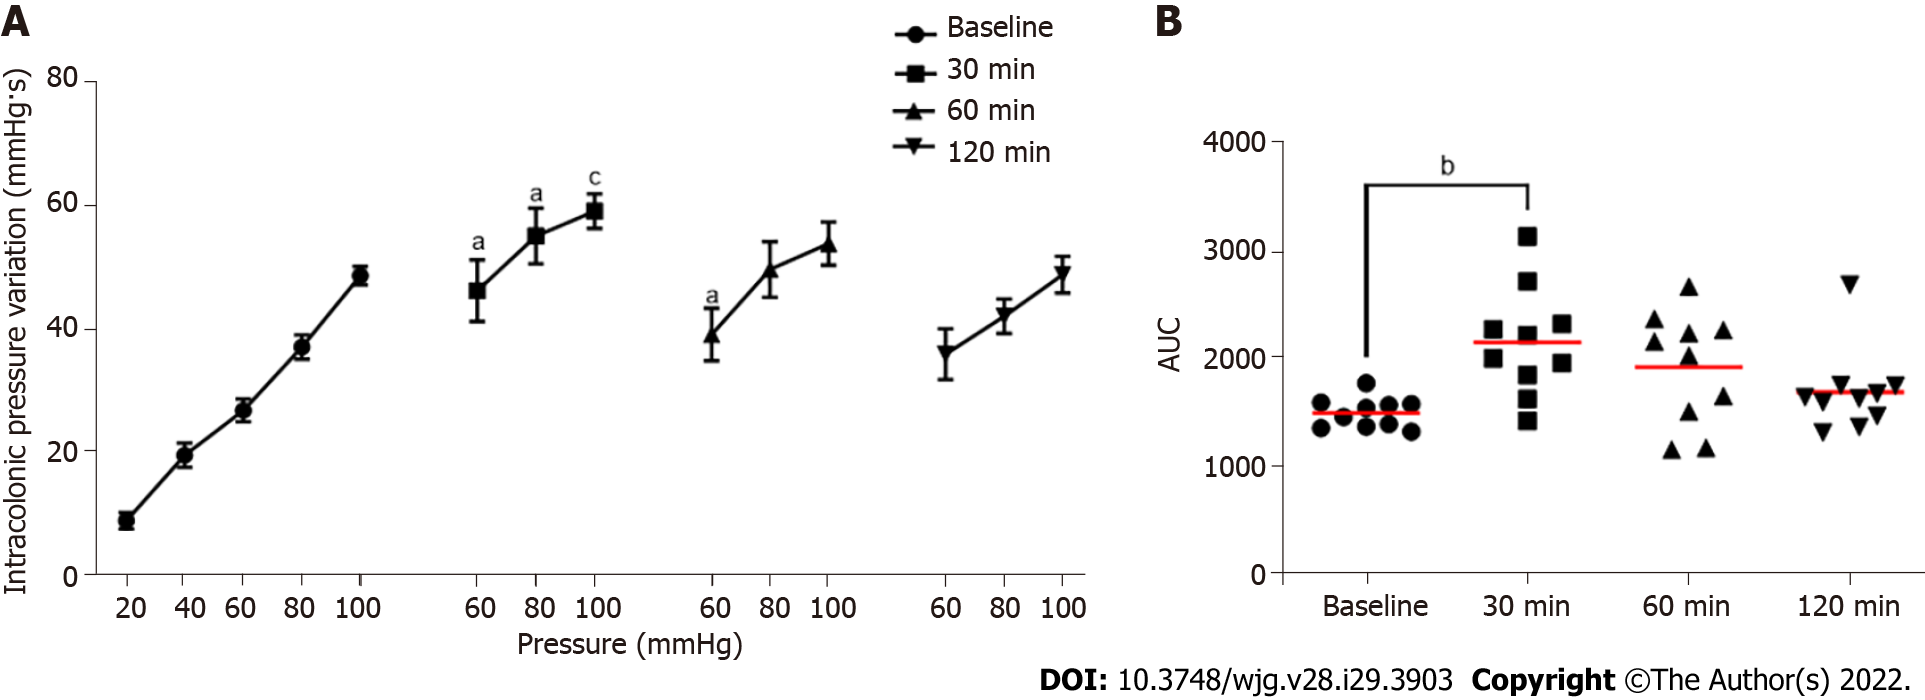
Figure 5 Evaluation of the impact of intrarectal instillation of flagellin on colonic sensitivity.
A: Intracolonic pressure variation (IPV) in response to colorectal distension in males mice before (Baseline) and after (30, 60 and 120 min) intrarectal instillation of flagellin (5 µg); B: Area under the curve (AUC) of the IPV relative to highest colorectal distension pressures (60, 80 and 100 mmHg). For each mouse and each time point, n = 10. aP < 0.05, bP < 0.01 and cP < 0.001 respect to Baseline. For IPV to colorectal distension test, dots represent means and error bars represent SEM. For AUC, each dot represents one mouse and red lines represent means.
- Citation: Mallaret G, Lashermes A, Meleine M, Boudieu L, Barbier J, Aissouni Y, Gelot A, Chassaing B, Gewirtz AT, Ardid D, Carvalho FA. Involvement of toll-like receptor 5 in mouse model of colonic hypersensitivity induced by neonatal maternal separation. World J Gastroenterol 2022; 28(29): 3903-3916
- URL: https://www.wjgnet.com/1007-9327/full/v28/i29/3903.htm
- DOI: https://dx.doi.org/10.3748/wjg.v28.i29.3903


