Copyright
©The Author(s) 2022.
World J Gastroenterol. Aug 7, 2022; 28(29): 3854-3868
Published online Aug 7, 2022. doi: 10.3748/wjg.v28.i29.3854
Published online Aug 7, 2022. doi: 10.3748/wjg.v28.i29.3854
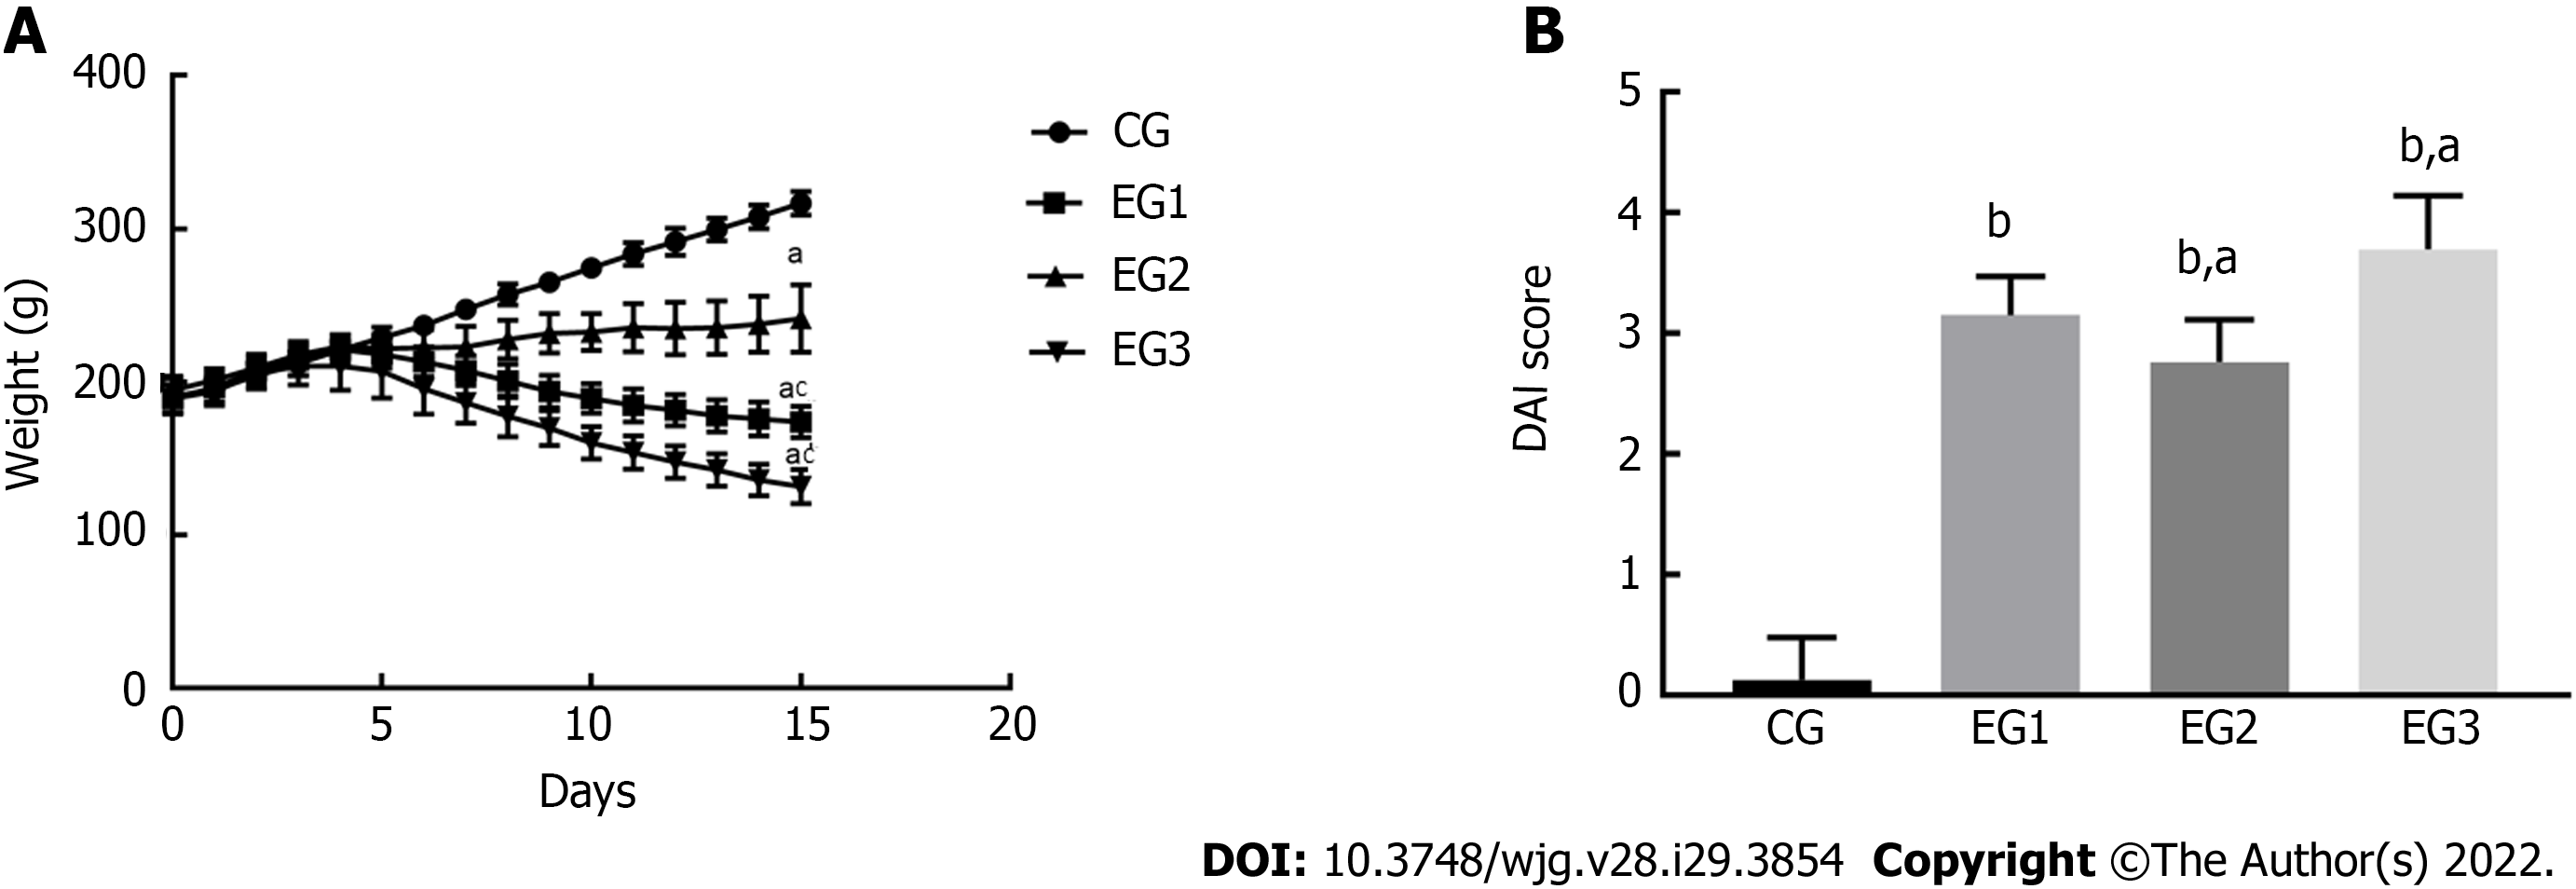
Figure 1 Disease activity of animals in each group.
A: Body weight changes of rats. The differences in body weight were statistically significant between EG groups and CG group (aP < 0.05), and between EG2-3 groups and EG1 group (cP < 0.05); B: Disease activity index scores. The differences were significant between EG groups and CG group (bP < 0.0001), and between EG2-3 groups and EG1 group (aP < 0.05). CG: Control group; UC: Ulcerative colitis; NOS: Nitric oxide synthase; L-NMMA: NG-monomethyl-L-arginine monoacetate; EG1: UC group; EG2: UC + NOS agonist TP508TFA group; EG3: UC + NOS inhibitor L-NMMA group; DAI: Disease activity index.
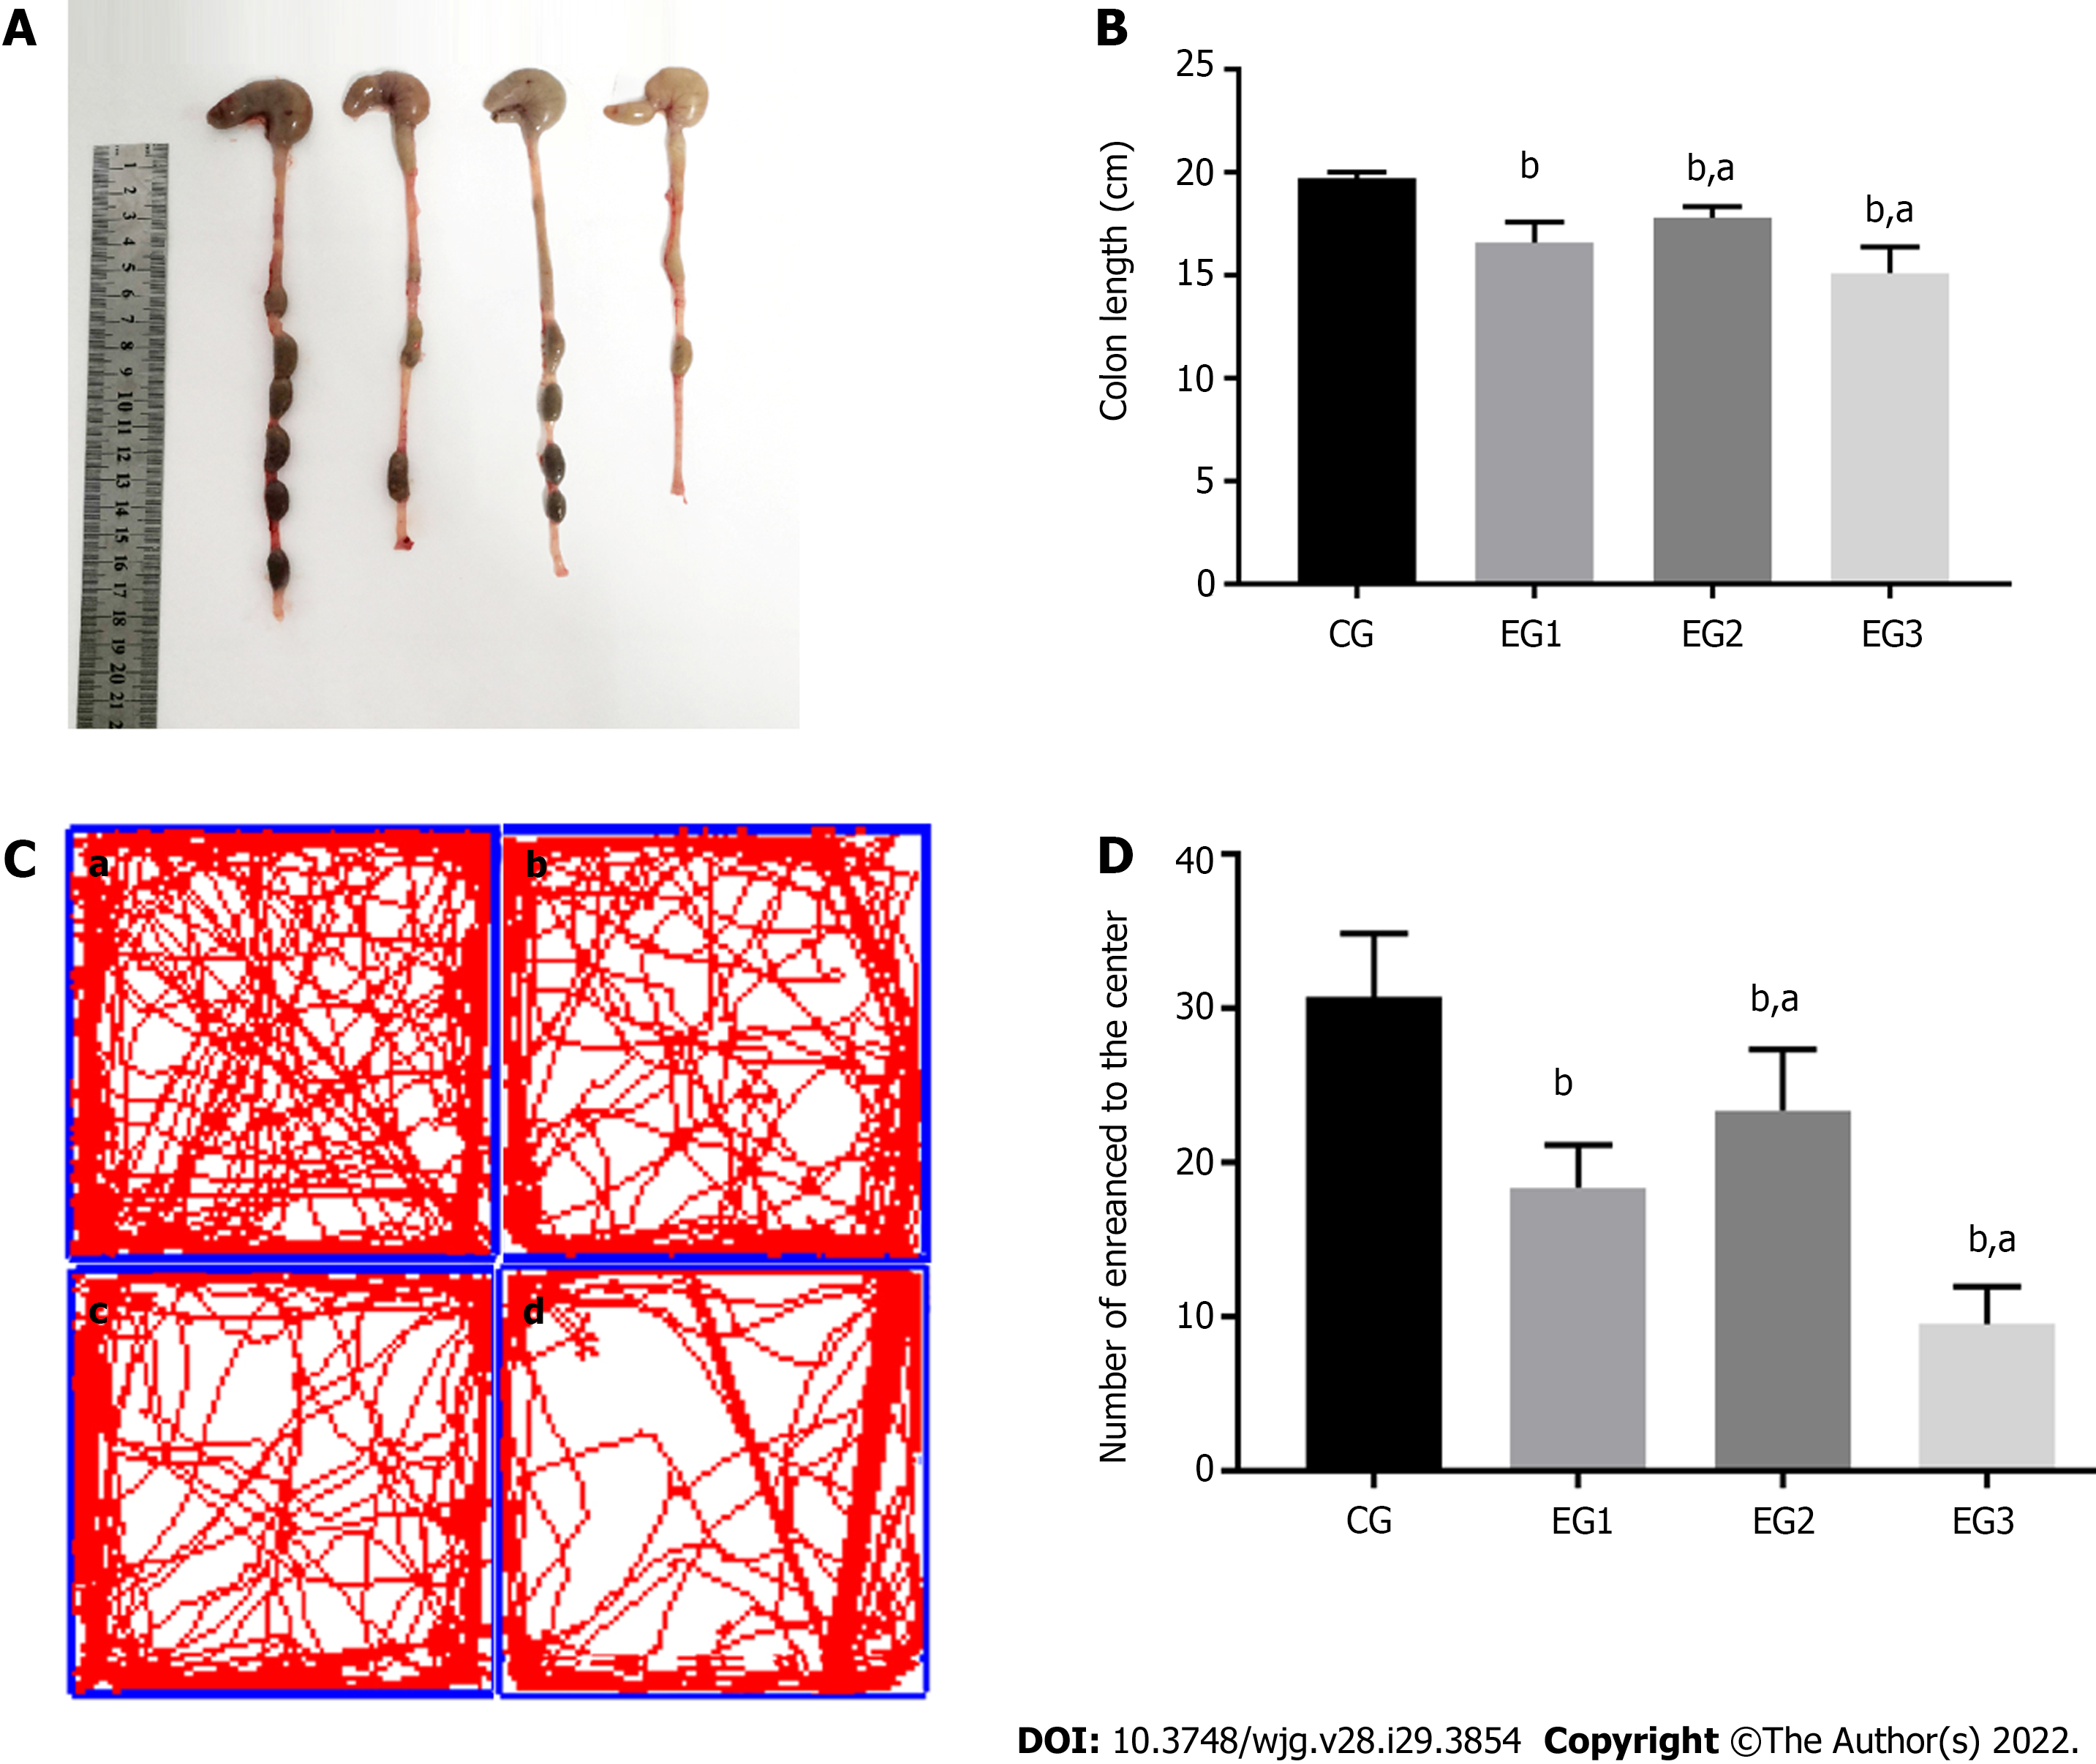
Figure 2 Colon length in each group and results of the open field test.
A: Colon length of rats in the four groups; B: Comparison of colon length in CG (19.71 ± 0.11 cm), EG1 (16.59 ± 0.35 cm), EG2 (17.80 ± 0.19 cm), and EG3 (15.11 ± 0.44 cm) groups. There were statistically significant differences between EG groups and CG group (bP < 0.0001), and between EG2-3 groups and EG1 group (aP < 0.05); C: Movement trajectories of rats. a: CG; b: EG1; c: EG2; d: EG3; D: Results of the open field test. There were statistically significant differences between EG groups and CG group (bP < 0.0001), and between EG2-3 groups and EG1 group (aP < 0.05). CG: Control group; UC: Ulcerative colitis; NOS: Nitric oxide synthase; L-NMMA: NG-monomethyl-L-arginine monoacetate; EG1: UC group; EG2: UC + NOS agonist TP508TFA group; EG3: UC + NOS inhibitor L-NMMA group.
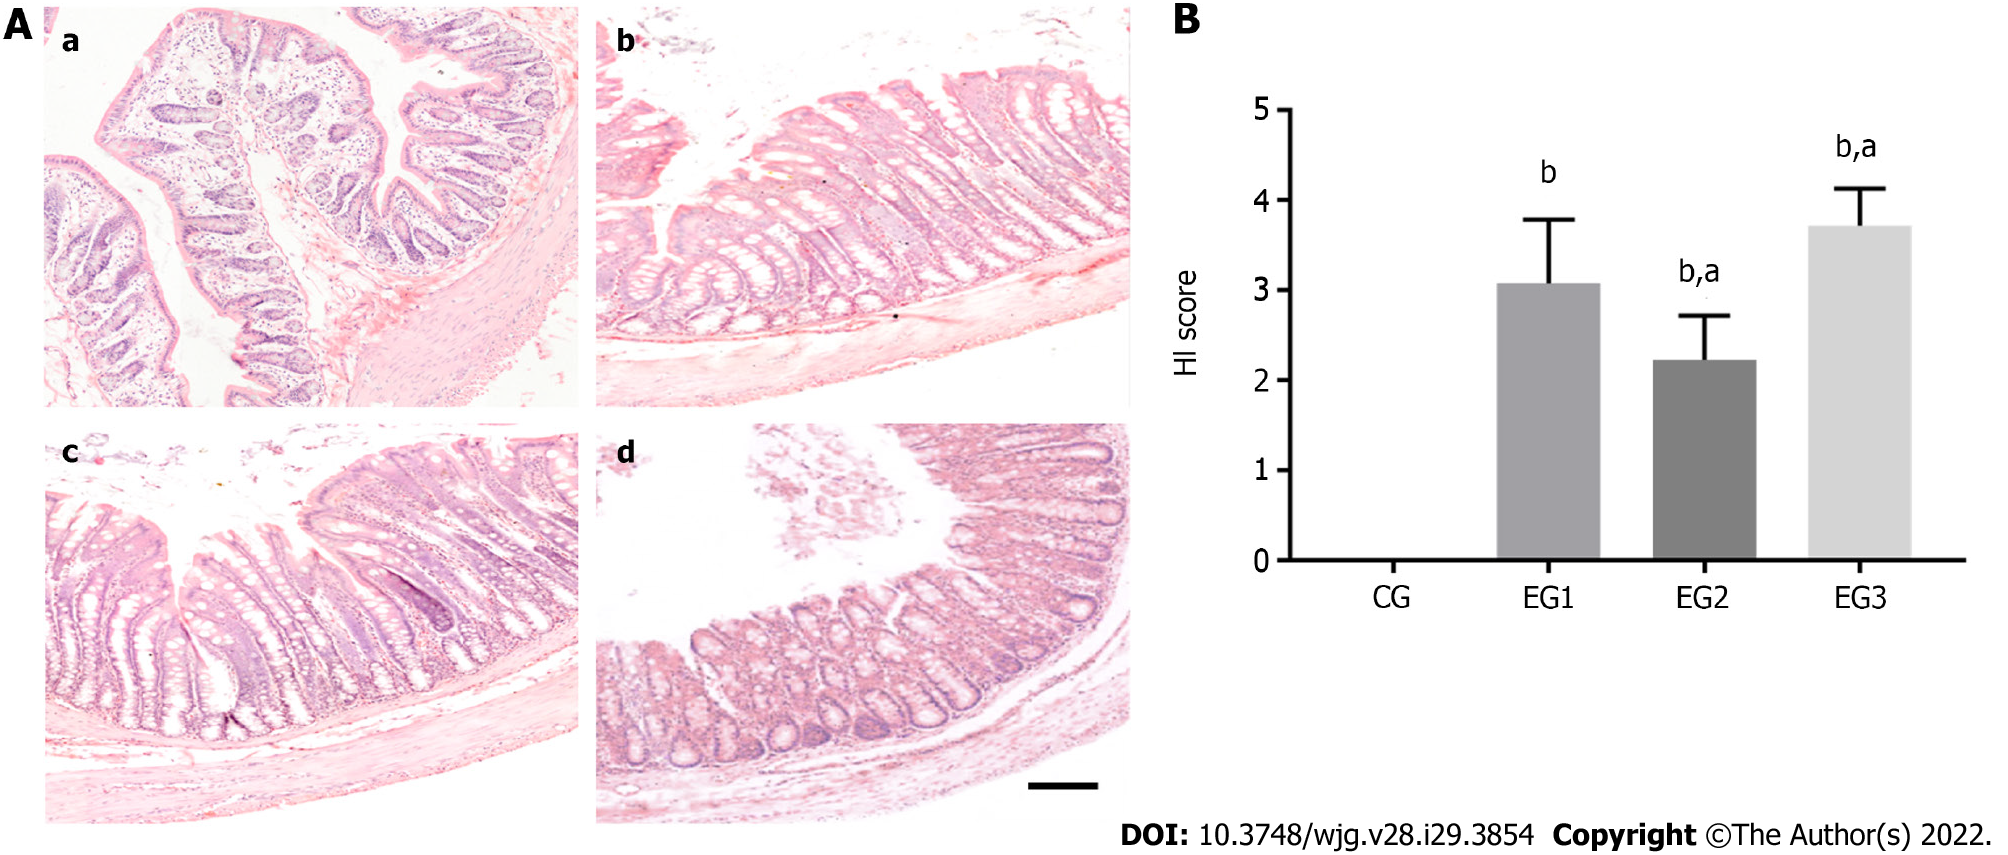
Figure 3 Histological evaluation.
A: HE stained rat colon tissues. a: CG; b: EG1; c: EG2; d: EG3. Scale bar = 100 μm; B: Comparison of colonic histological index scores showing statistically significant differences between EG groups and CG group (bP < 0.0001) and between EG2-3 groups and EG1 group (aP < 0.05). CG: Control group; UC: Ulcerative colitis; NOS: Nitric oxide synthase; L-NMMA: NG-monomethyl-L-arginine monoacetate; EG1: UC group; EG2: UC + NOS agonist TP508TFA group; EG3: UC + NOS inhibitor L-NMMA group; HI: Histological index.
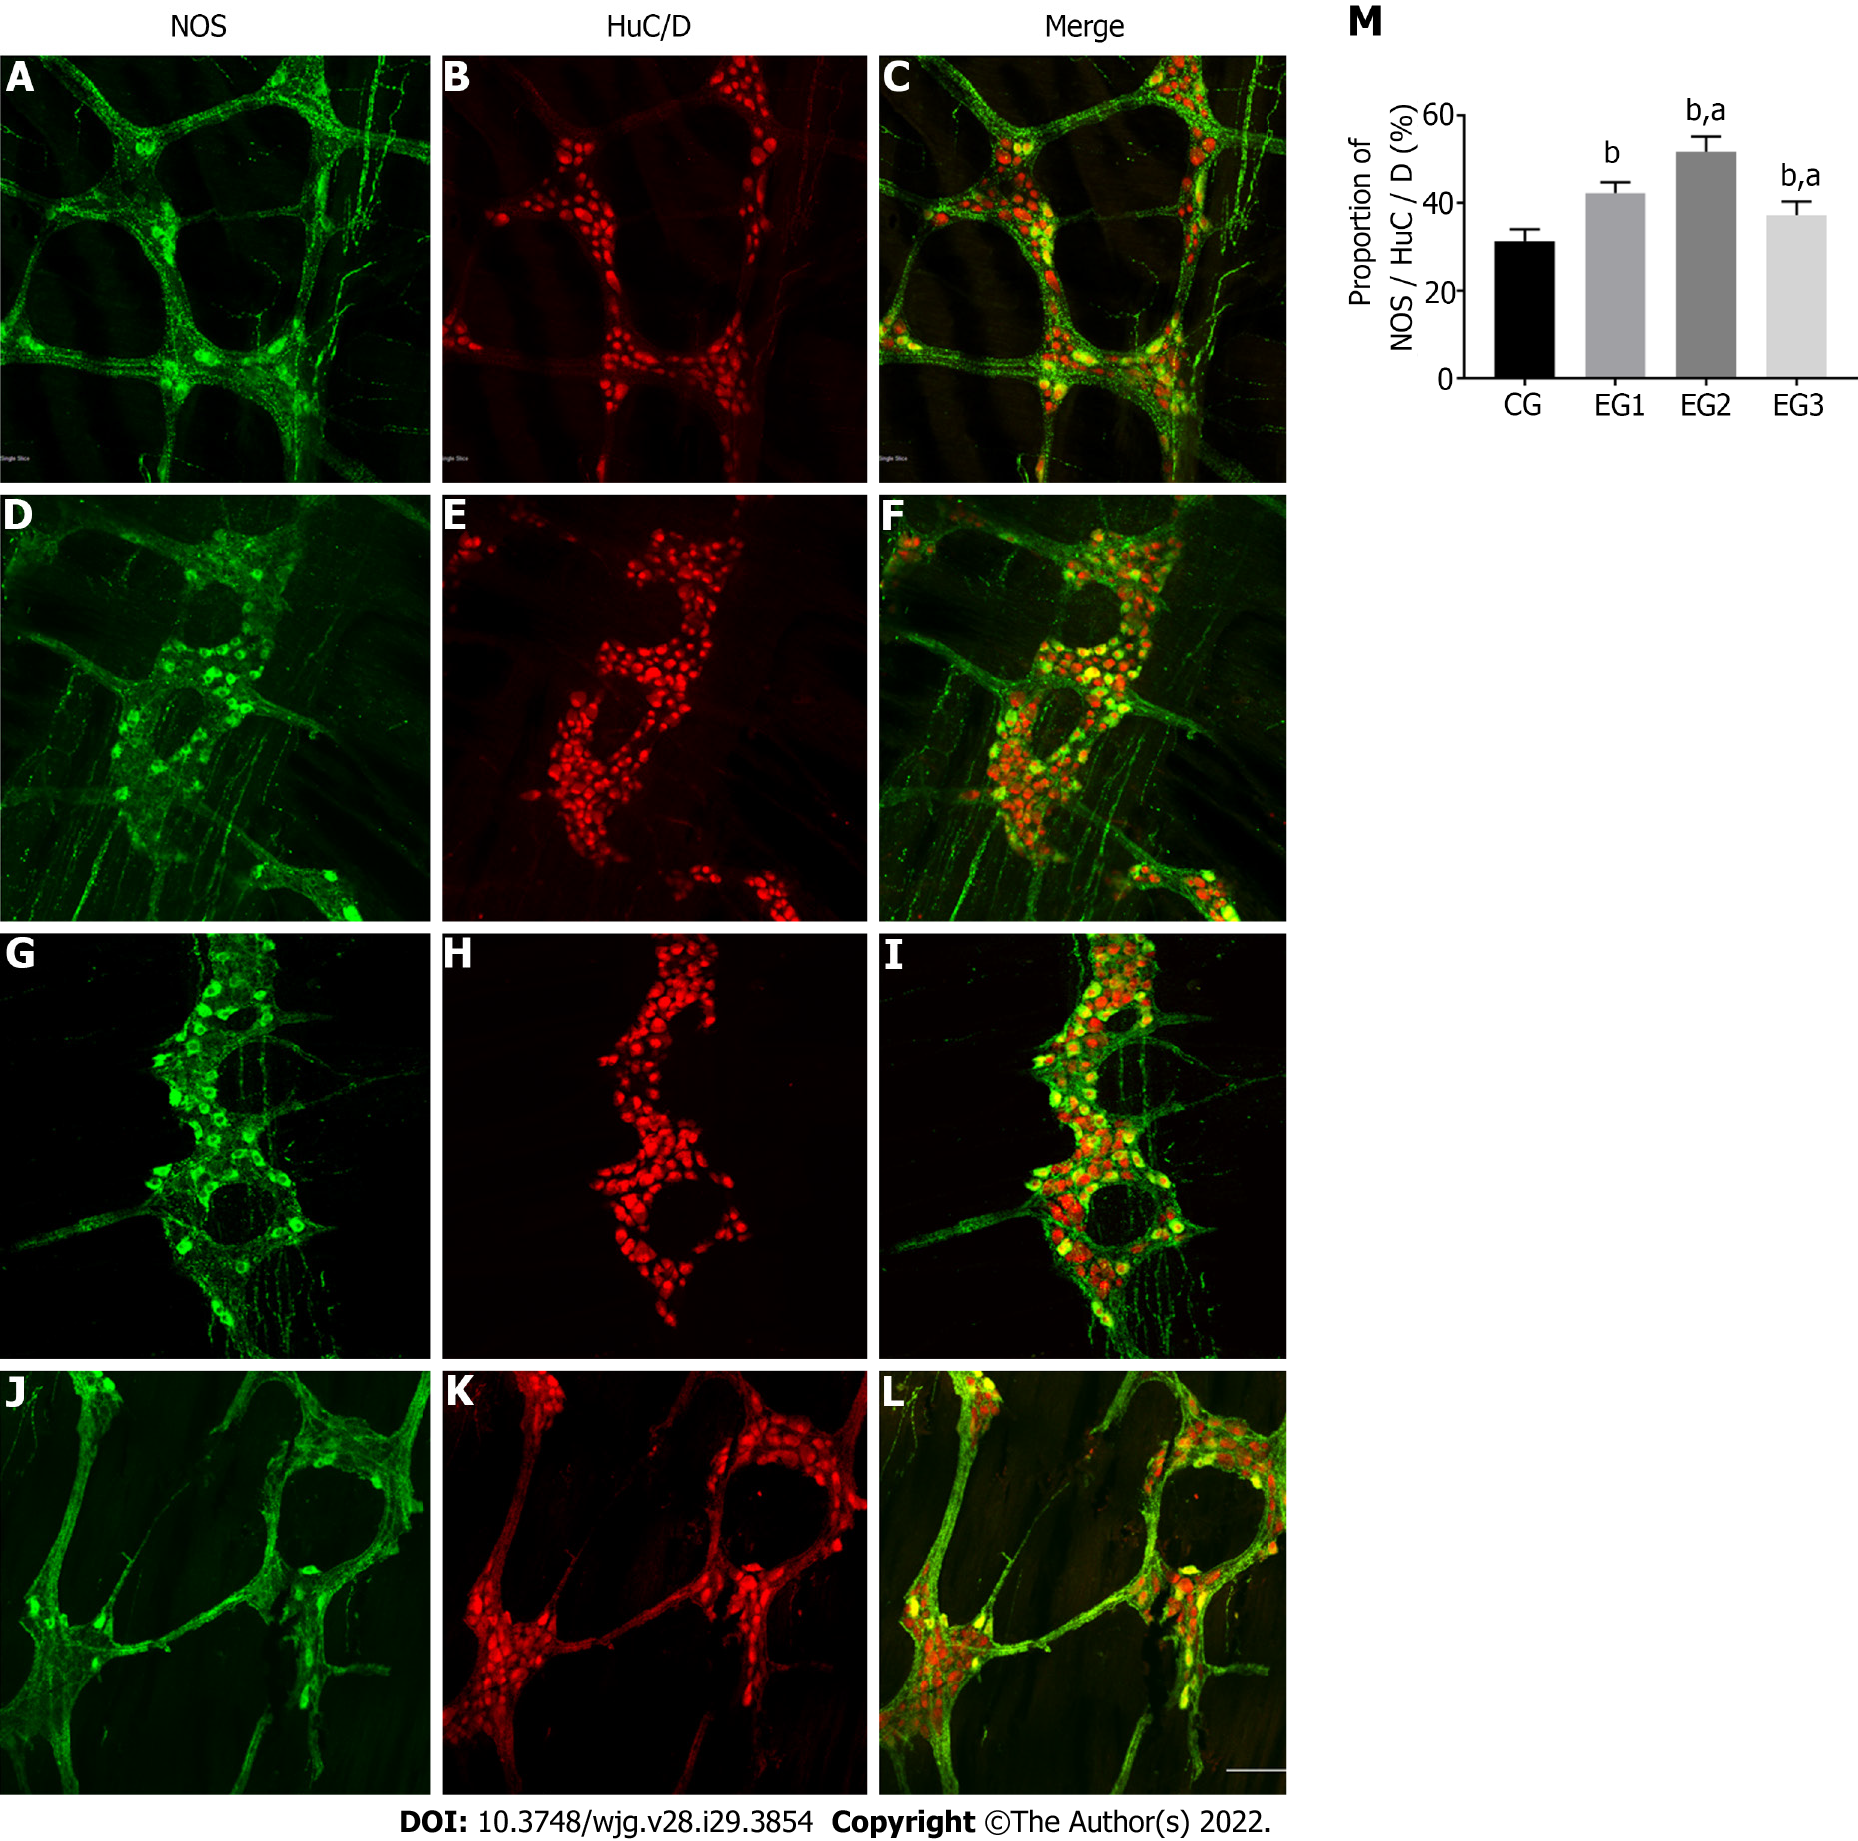
Figure 4 Changes in the number of nitric oxide synthase-positive neurons in the colonic myenteric plexus.
A-L: Immunofluorescent histochemical double-staining of the rat colonic myenteric plexus (MP) for nitric oxide synthase (NOS; green) and HuC/D (red) in CG (A-C), EG1 (D-F), EG2 (G-I), and EG3 (J-L) rats. Scale bar = 30 μm; M: Comparison of the proportion of NOS-positive neurons in the colonic MP showing statistically significant differences between EG groups and CG group (bP < 0.0001), and between EG2-3 groups and EG1 group (aP < 0.05). CG: Control group; UC: Ulcerative colitis; NOS: Nitric oxide synthase; L-NMMA: NG-monomethyl-L-arginine monoacetate; EG1: UC group; EG2: UC + NOS agonist TP508TFA group; EG3: UC + NOS inhibitor L-NMMA group; MP: myenteric plexus.
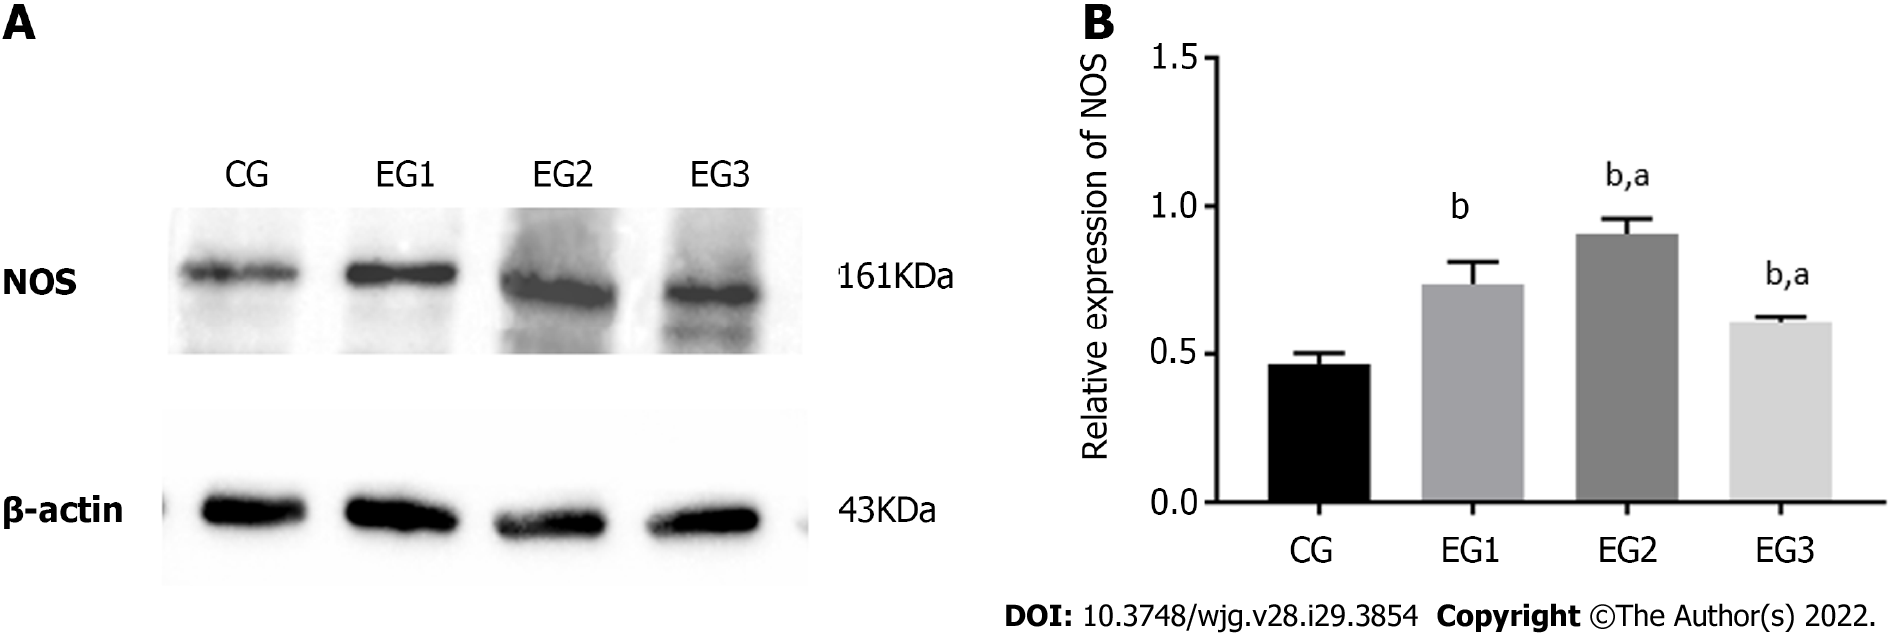
Figure 5 Relative nitric oxide synthase protein expression in the colonic myenteric plexus.
A: Western blot analysis of expression of nitric oxide synthase (NOS) in the colonic myenteric plexus (MP) of rats in the four groups; B: Comparison of the relative expression of NOS protein in the colonic MP of rats in the four groups showing statistically significant differences between EG groups and CG group (bP < 0.0001), and between EG2-3 groups and EG1 group (aP < 0.05). CG: Control group; UC: Ulcerative colitis; NOS: Nitric oxide synthase; L-NMMA: NG-monomethyl-L-arginine monoacetate; EG1: UC group; EG2: UC + NOS agonist TP508TFA group; EG3: UC + NOS inhibitor L-NMMA group; NOS: Nitric oxide synthase; MP: Myenteric plexus.
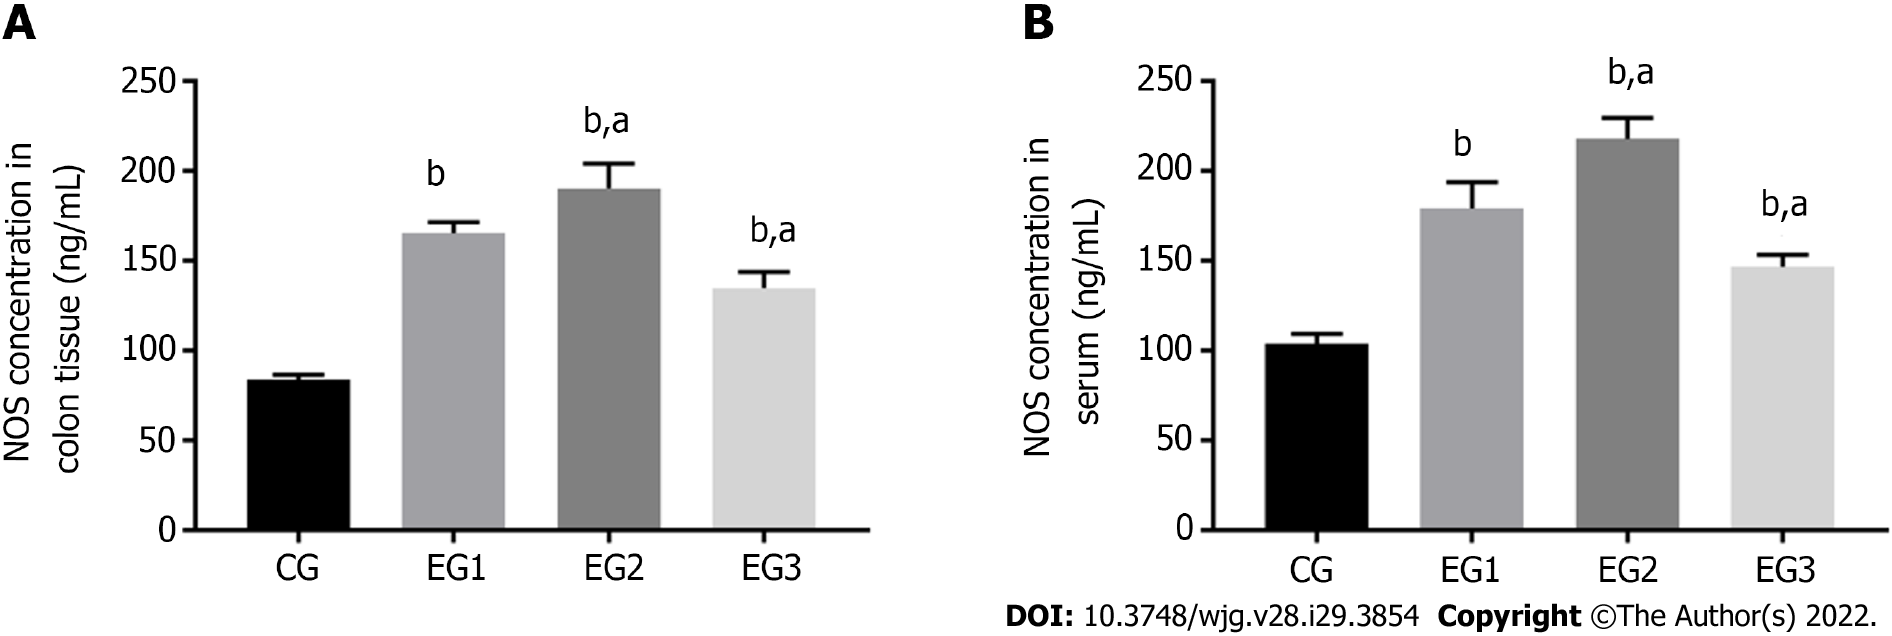
Figure 6 Changes in nitric oxide synthase concentration in colonic myenteric tissue and serum.
A: Comparison of nitric oxide synthase (NOS) concentration in colonic myenteric tissue of rats in the four groups showing statistically significant differences between EG groups and CG group (bP < 0.0001), and between EG2-3 groups and EG1 group (aP < 0.05); B: Comparison of NOS concentrations in the serum of rats in the four groups showing statistically significant differences between EG groups and CG group (bP < 0.0001), and between EG2-3 groups and CG group (aP < 0.05). CG: Control group; UC: Ulcerative colitis; NOS: Nitric oxide synthase; L-NMMA: NG-monomethyl-L-arginine monoacetate; EG1: UC group; EG2: UC + NOS agonist TP508TFA group; EG3: UC + NOS inhibitor L-NMMA group; NOS: Nitric oxide synthase.
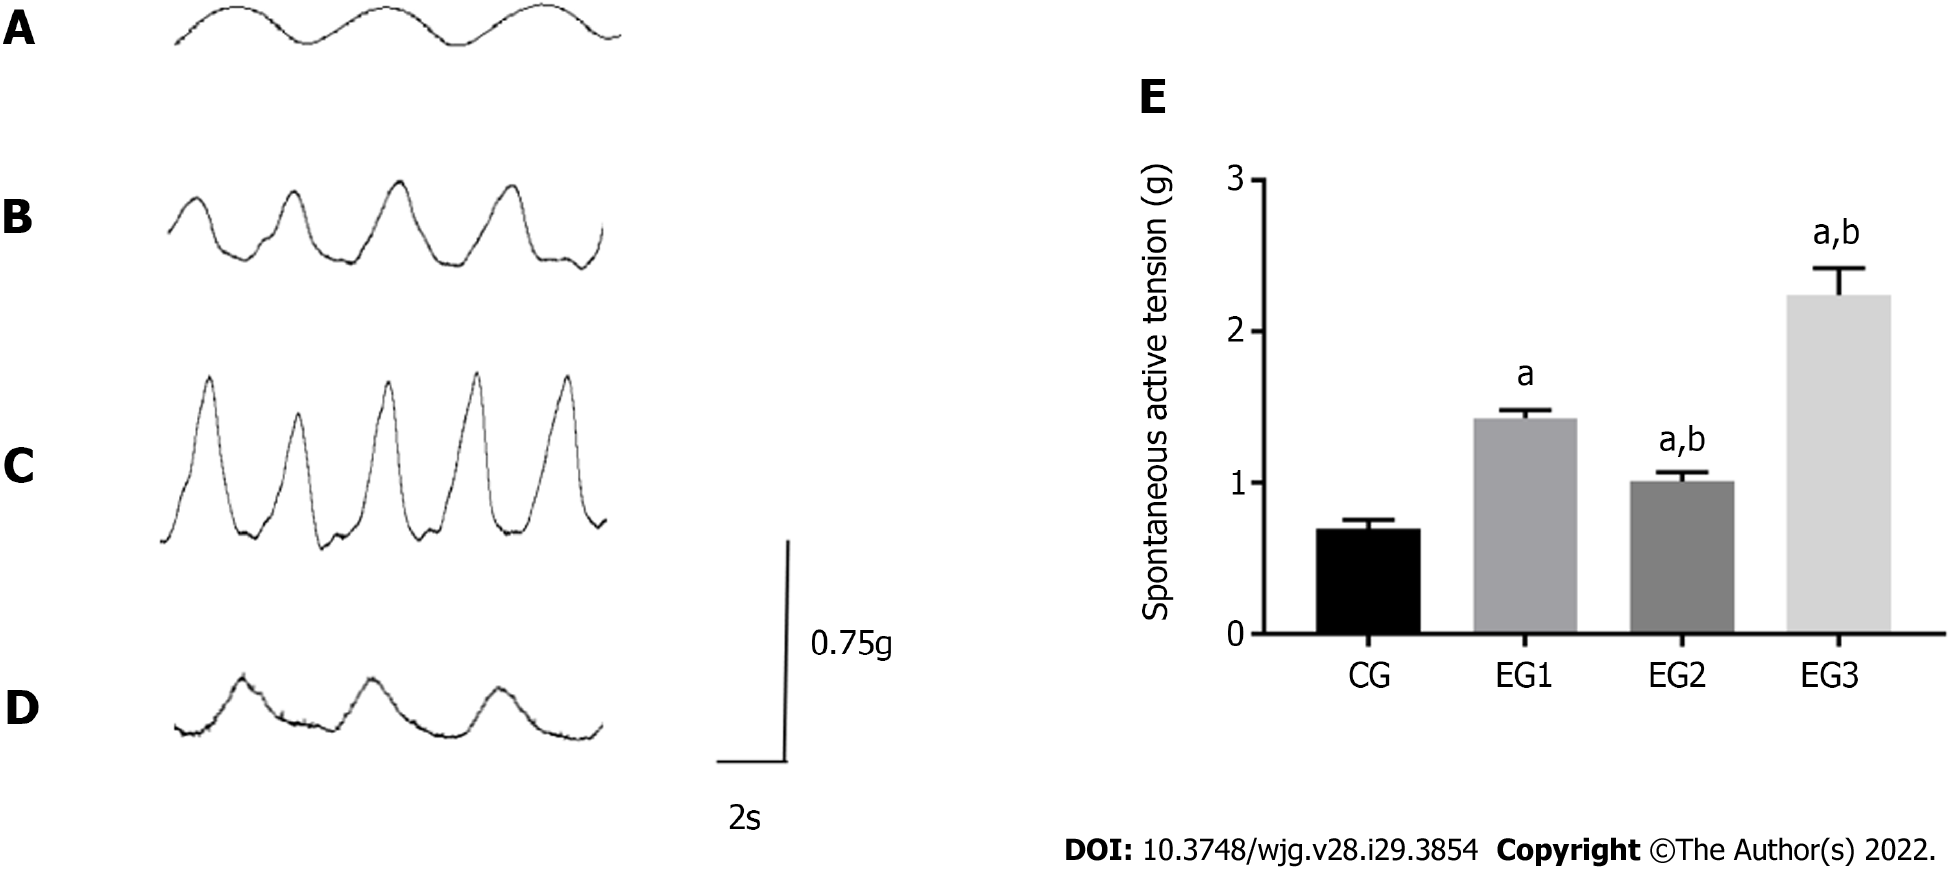
Figure 7 Comparison of isolated colonic longitudinal muscle contraction tension.
A-D: Contraction amplitude of the colonic longitudinal muscle of CG (A), EG1 (B), EG2 (C), and EG3 (D) rats; E: Comparison of the contraction tension of the colonic longitudinal muscle among rats from the four groups: CG (0.69 ± 0.02 g), EG1 (1.4 2 ± 0.02 g), EG2 (2.24 ± 0.07 g), and EG3 (1.01 ± 0.02 g). All differences were statistically significant between EG groups and CG group (aP < 0.0001) and between EG2-3 groups and EG1 group (bP < 0.001). CG: Control group; UC: Ulcerative colitis; NOS: Nitric oxide synthase; L-NMMA: NG-monomethyl-L-arginine monoacetate; EG1: UC group; EG2: UC + NOS agonist TP508TFA group; EG3: UC + NOS inhibitor L-NMMA group; LM: Longitudinal muscle.
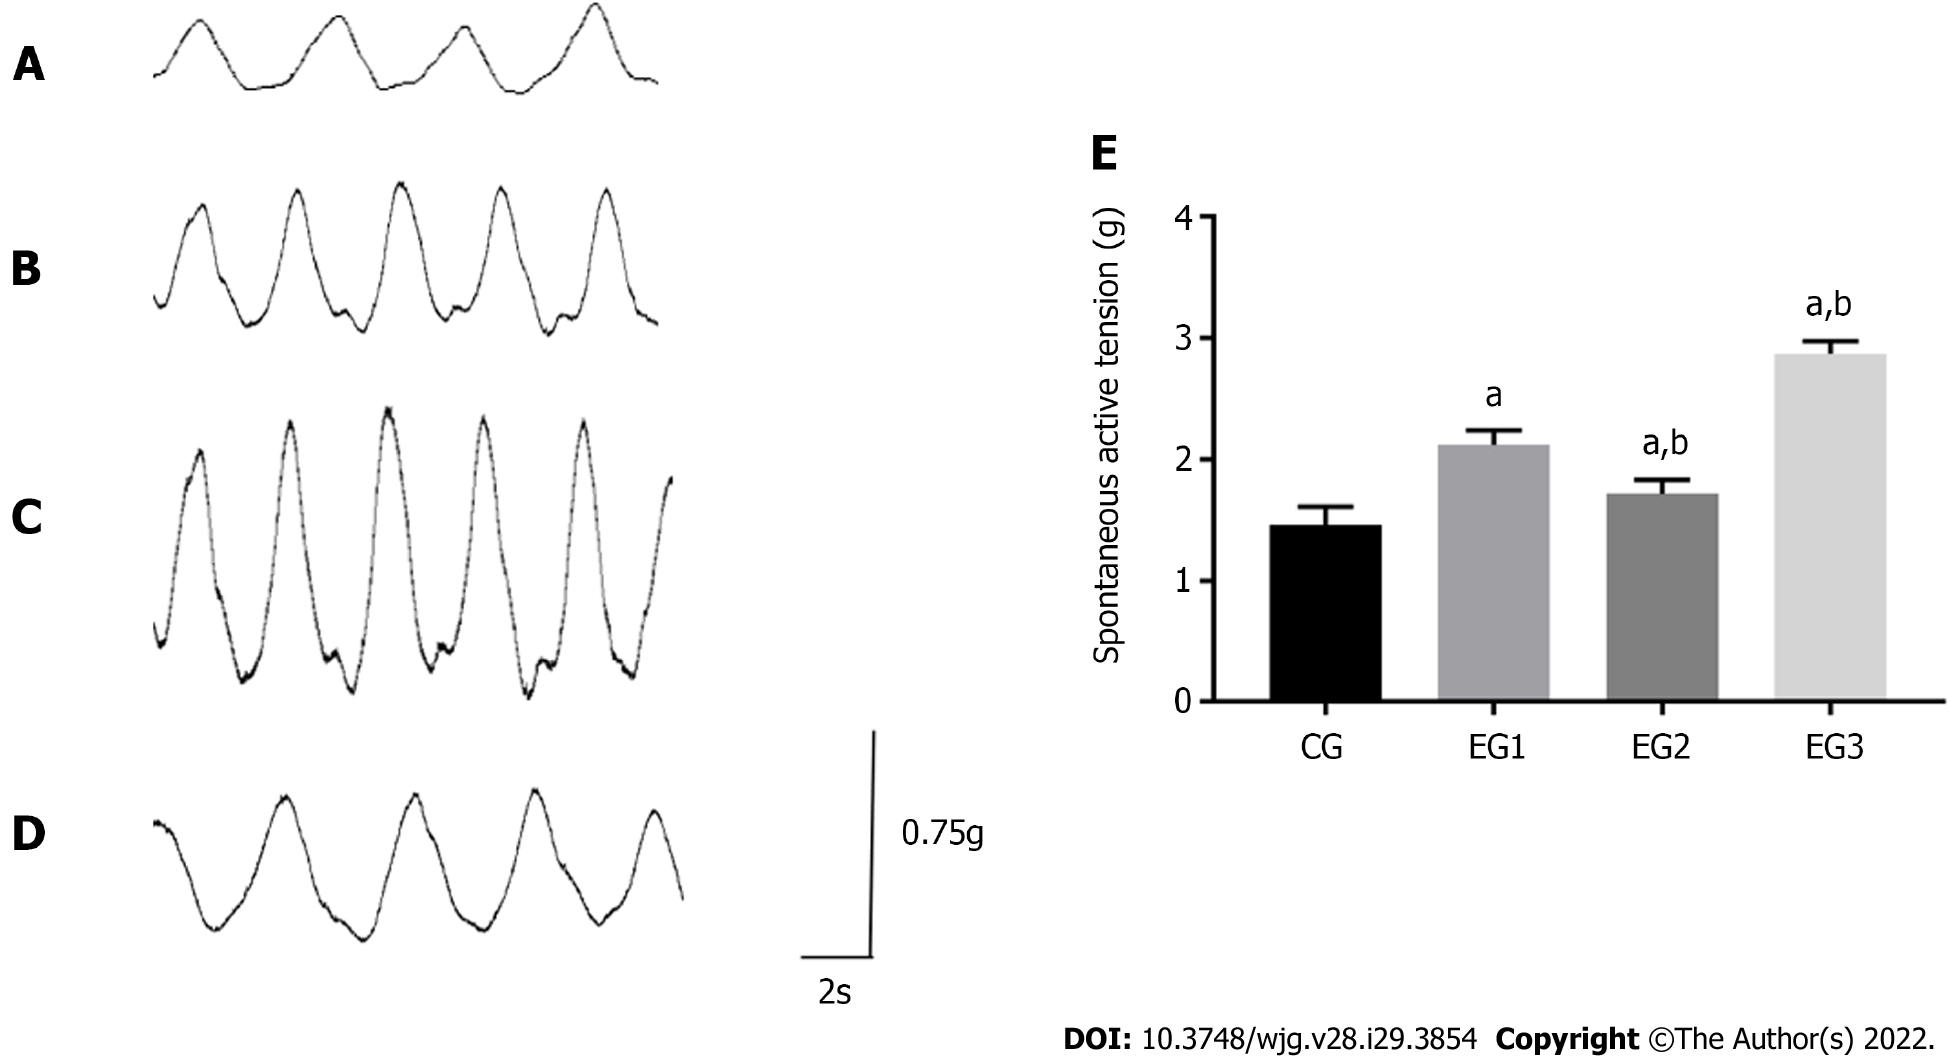
Figure 8 Comparison of isolated colonic circular muscle contraction tension.
A-D: Contraction amplitude of the colonic circular muscle of CG (A), EG1 (B), EG2 (C), and EG3 (D) rats; E: Comparison of the contraction tension of the rat colonic circular muscle among the four groups: CG (1.46 ± 0.06 g), EG1 (2.12 ± 0.49 g), EG2 (2.87 ± 0.04 g), and EG3 (1.72 ± 0.04 g). All differences were statistically significant between EG groups and CG group (aP < 0.0001) and between EG2-3 groups and EG1 group (bP < 0.0001). CG: Control group; UC: Ulcerative colitis; NOS: Nitric oxide synthase; L-NMMA: NG-monomethyl-L-arginine monoacetate; EG1: UC group; EG2: UC + NOS agonist TP508TFA group; EG3: UC + NOS inhibitor L-NMMA group; CM: Circular muscle.
- Citation: Li YR, Li Y, Jin Y, Xu M, Fan HW, Zhang Q, Tan GH, Chen J, Li YQ. Involvement of nitrergic neurons in colonic motility in a rat model of ulcerative colitis. World J Gastroenterol 2022; 28(29): 3854-3868
- URL: https://www.wjgnet.com/1007-9327/full/v28/i29/3854.htm
- DOI: https://dx.doi.org/10.3748/wjg.v28.i29.3854


