Copyright
©The Author(s) 2022.
World J Gastroenterol. Jul 28, 2022; 28(28): 3732-3738
Published online Jul 28, 2022. doi: 10.3748/wjg.v28.i28.3732
Published online Jul 28, 2022. doi: 10.3748/wjg.v28.i28.3732
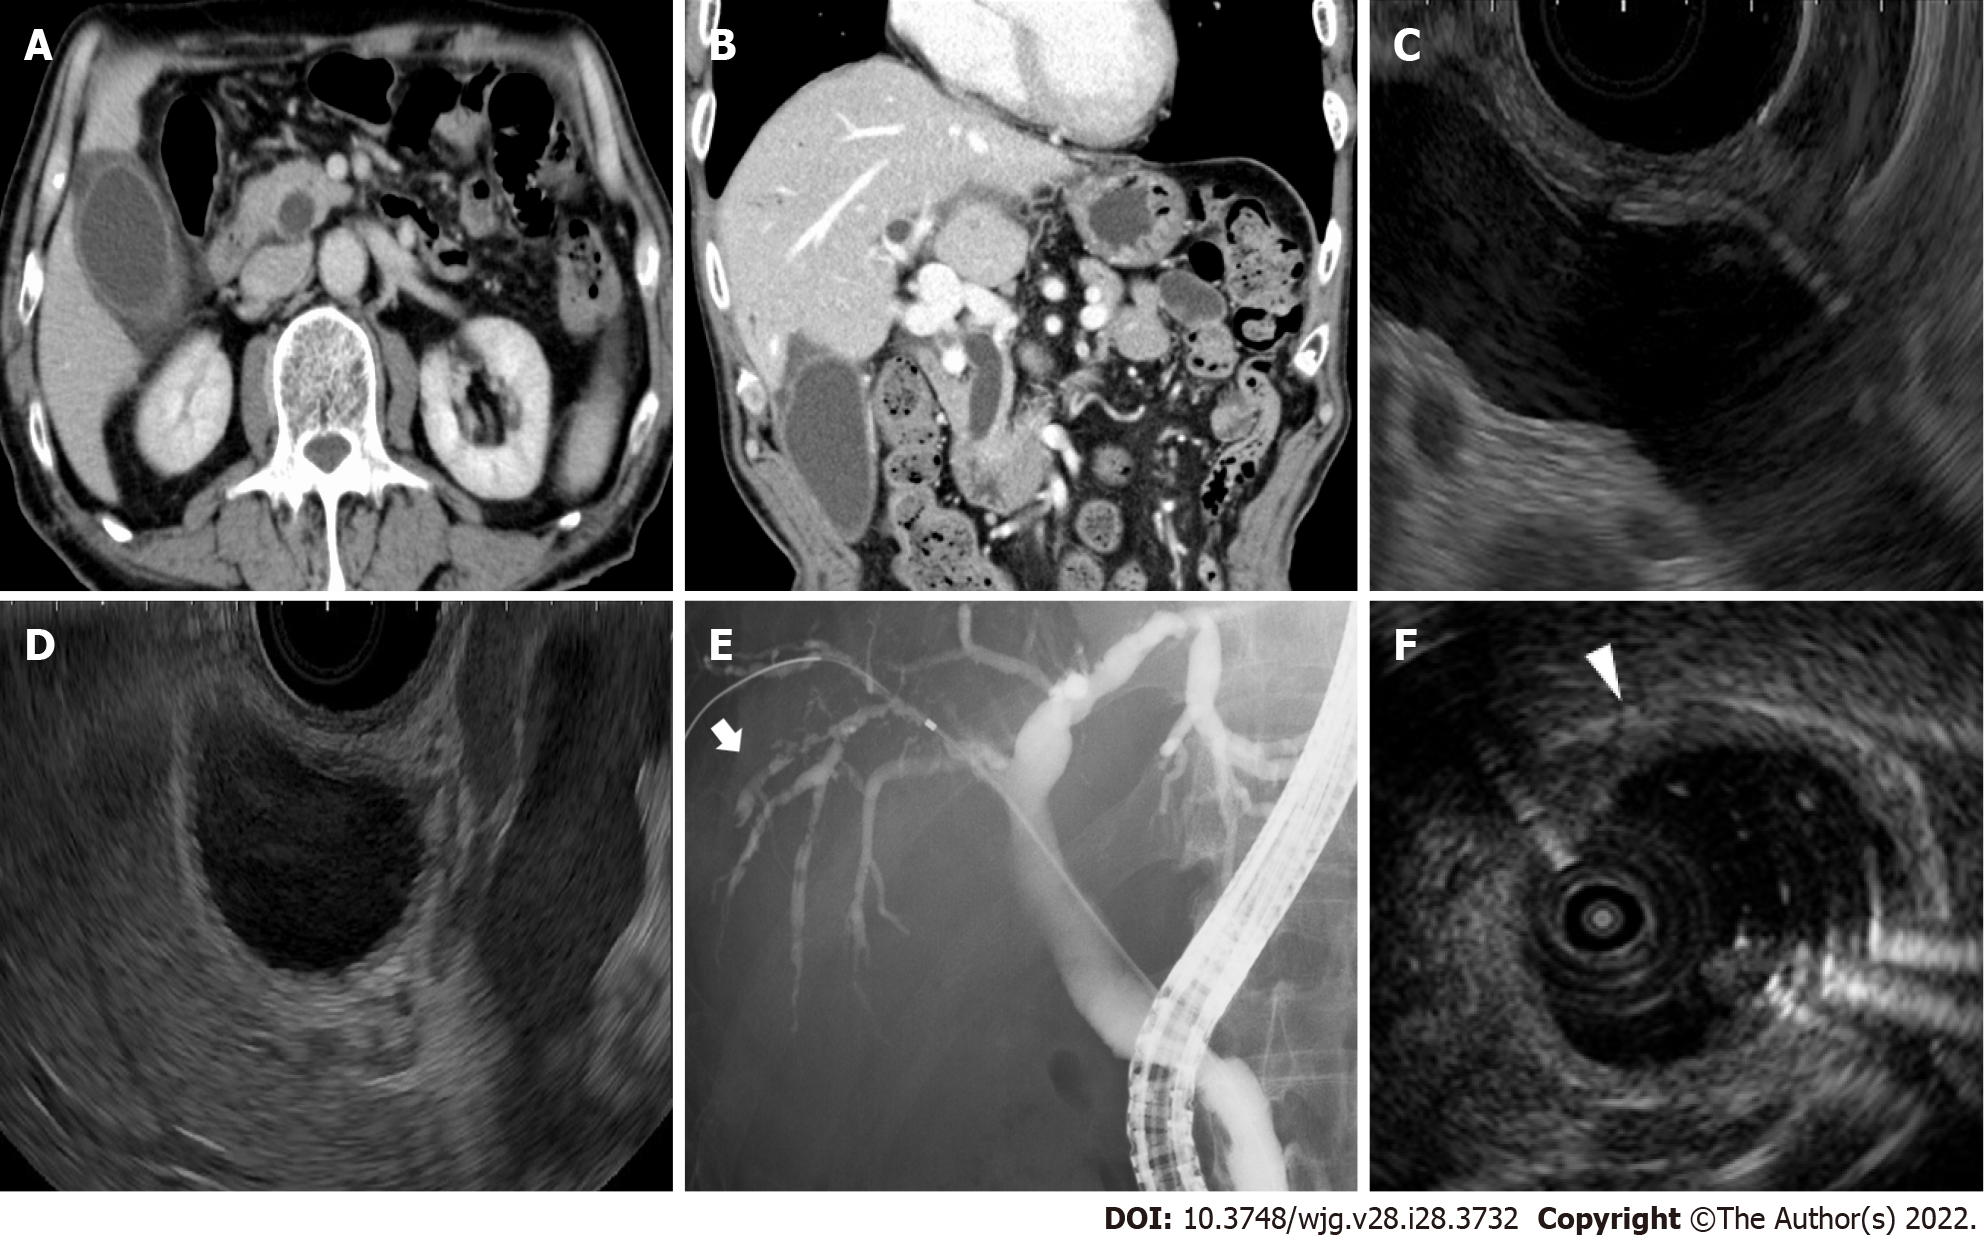
Figure 1 Imaging examinations of the gallbladder and common bile duct.
A, B: Contrast-enhanced computed tomography shows swelling and wall thickness of the gallbladder and common bile duct; C, D: Endoscopic ultrasonography shows dilatation of the common bile duct without obstruction and wall thickness of the gallbladder; E: Endoscopic retrograde cholangiopancreatography shows a dilated common bile duct and irregularly narrowed right intrahepatic bile duct (white arrow); F: Intraductal ultrasonography shows the wall thickness from the right bile duct to the common bile duct (white arrowhead).
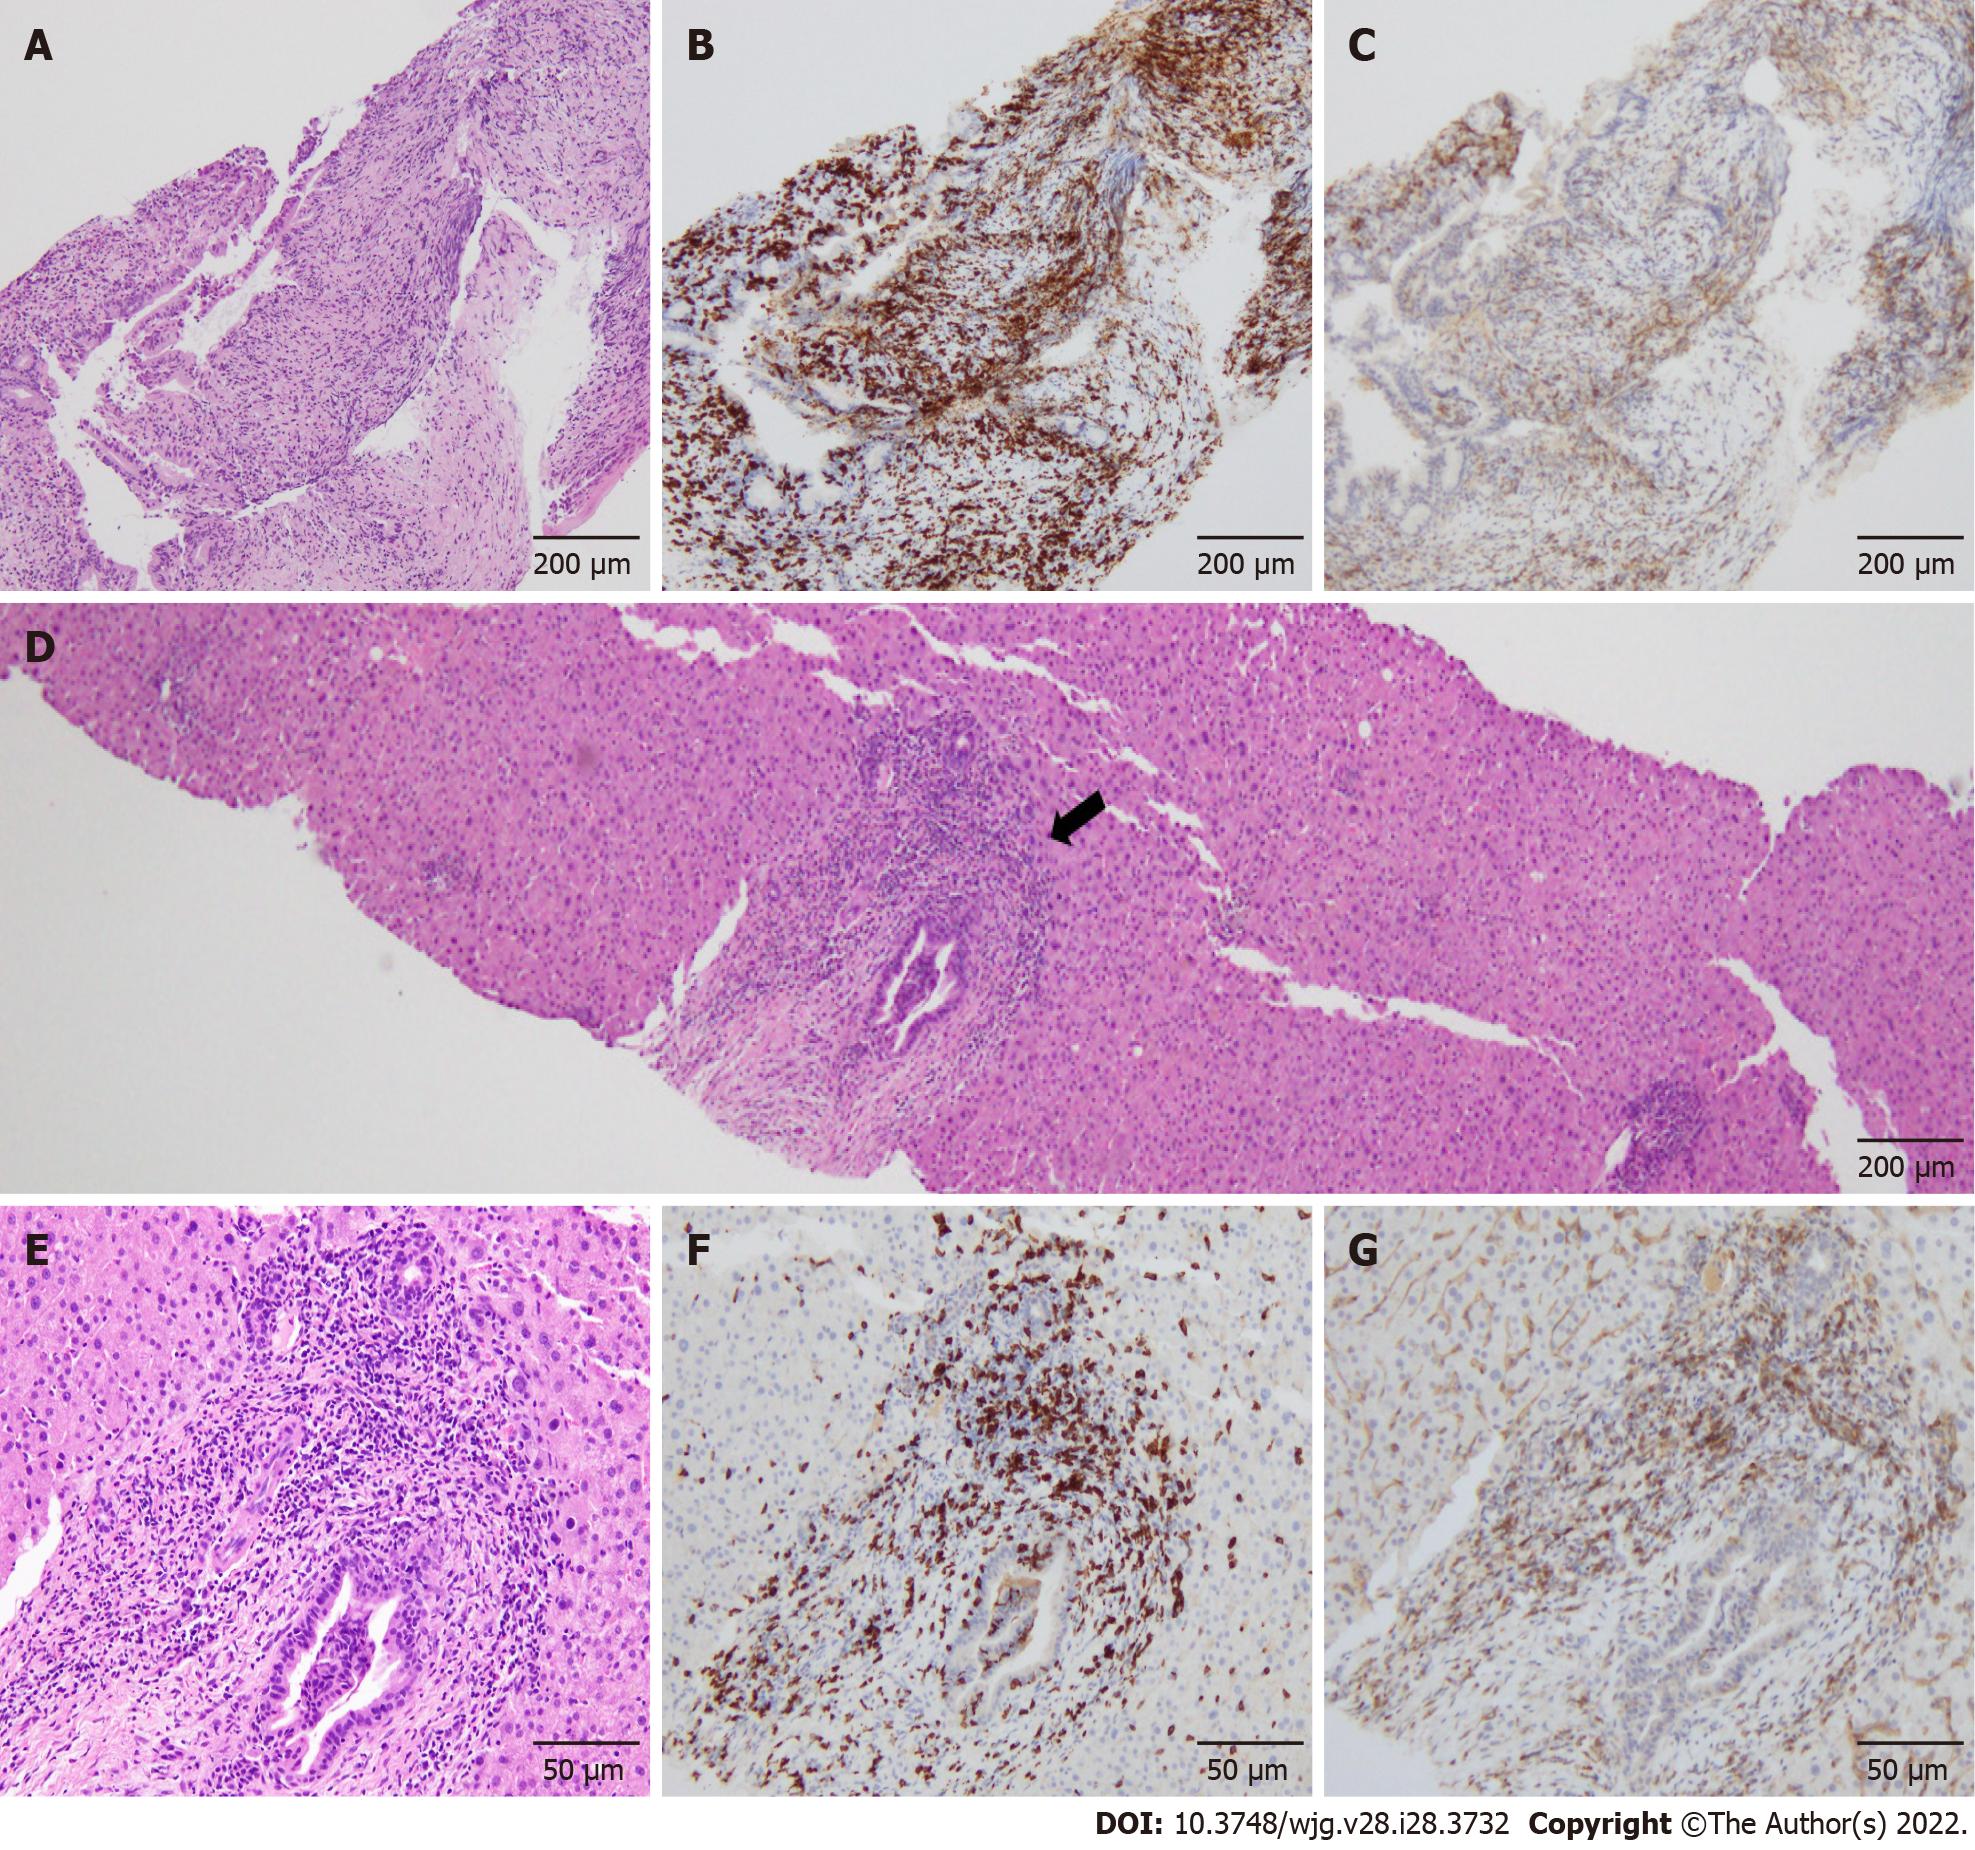
Figure 2 Pathological findings of the common bile duct and liver.
A: Hematoxylin–eosin staining (× 40): Intraepithelial infiltrations of lymphocytes are observed; B and C: CD8 (B) and CD4 (C) staining (× 40): Infiltration of CD8+ T cells are predominant in the biliary epithelium compared to CD4+ T cells; D and E: Hematoxylin–eosin staining: On liver biopsy, inflammation of the hepatic parenchyma is not observed. The periductal "onion-skin" fibrosis is not observed in the portal area (black arrow); F and G: CD8 (F) and CD4 (G) staining (× 200): In a zoomed-in view of the portal area, predominant infiltration of CD8+ T cells, compared with CD4+ T cells, is observed.
- Citation: Tanaka T, Sakai A, Tsujimae M, Yamada Y, Kobayashi T, Masuda A, Kodama Y. Delayed immune-related sclerosing cholangitis after discontinuation of pembrolizumab: A case report. World J Gastroenterol 2022; 28(28): 3732-3738
- URL: https://www.wjgnet.com/1007-9327/full/v28/i28/3732.htm
- DOI: https://dx.doi.org/10.3748/wjg.v28.i28.3732


