Copyright
©The Author(s) 2022.
World J Gastroenterol. Jul 28, 2022; 28(28): 3666-3681
Published online Jul 28, 2022. doi: 10.3748/wjg.v28.i28.3666
Published online Jul 28, 2022. doi: 10.3748/wjg.v28.i28.3666
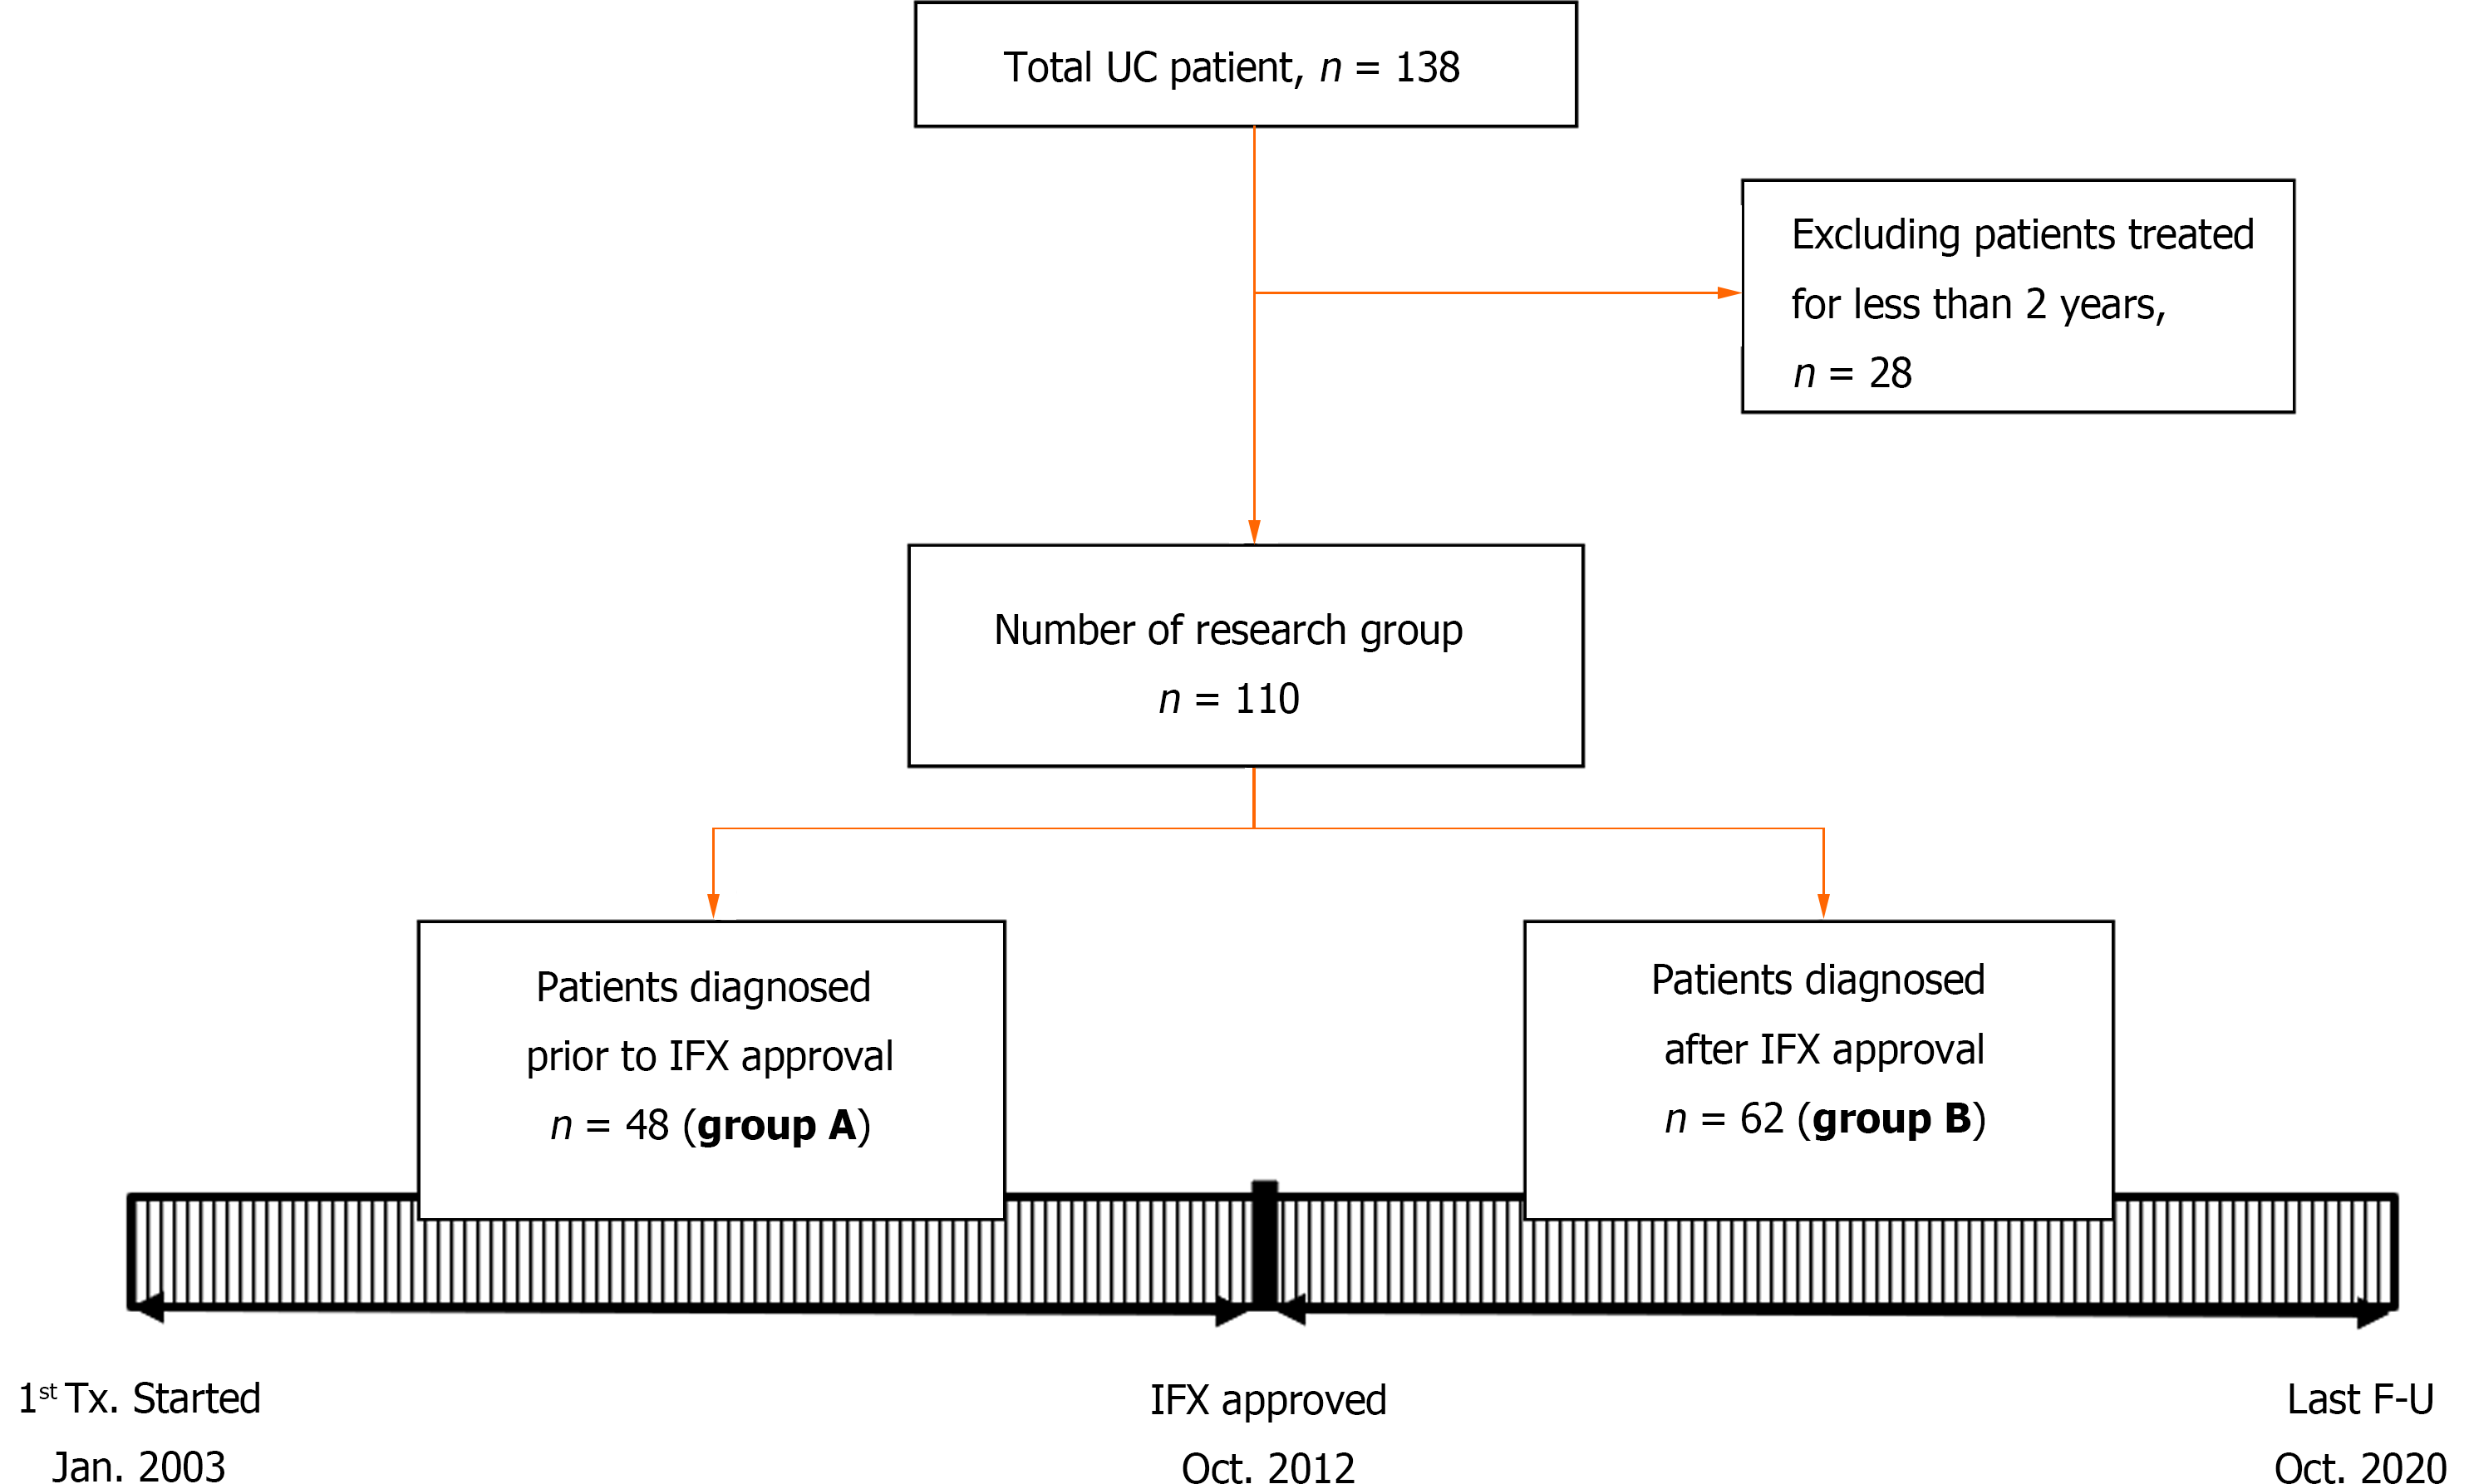
Figure 1 Patient group classification.
F-U: Follow-up; IFX: Infliximab; Jan: January; n: Number; UC: Ulcerative colitis; Oct: October; Tx: Treatment.
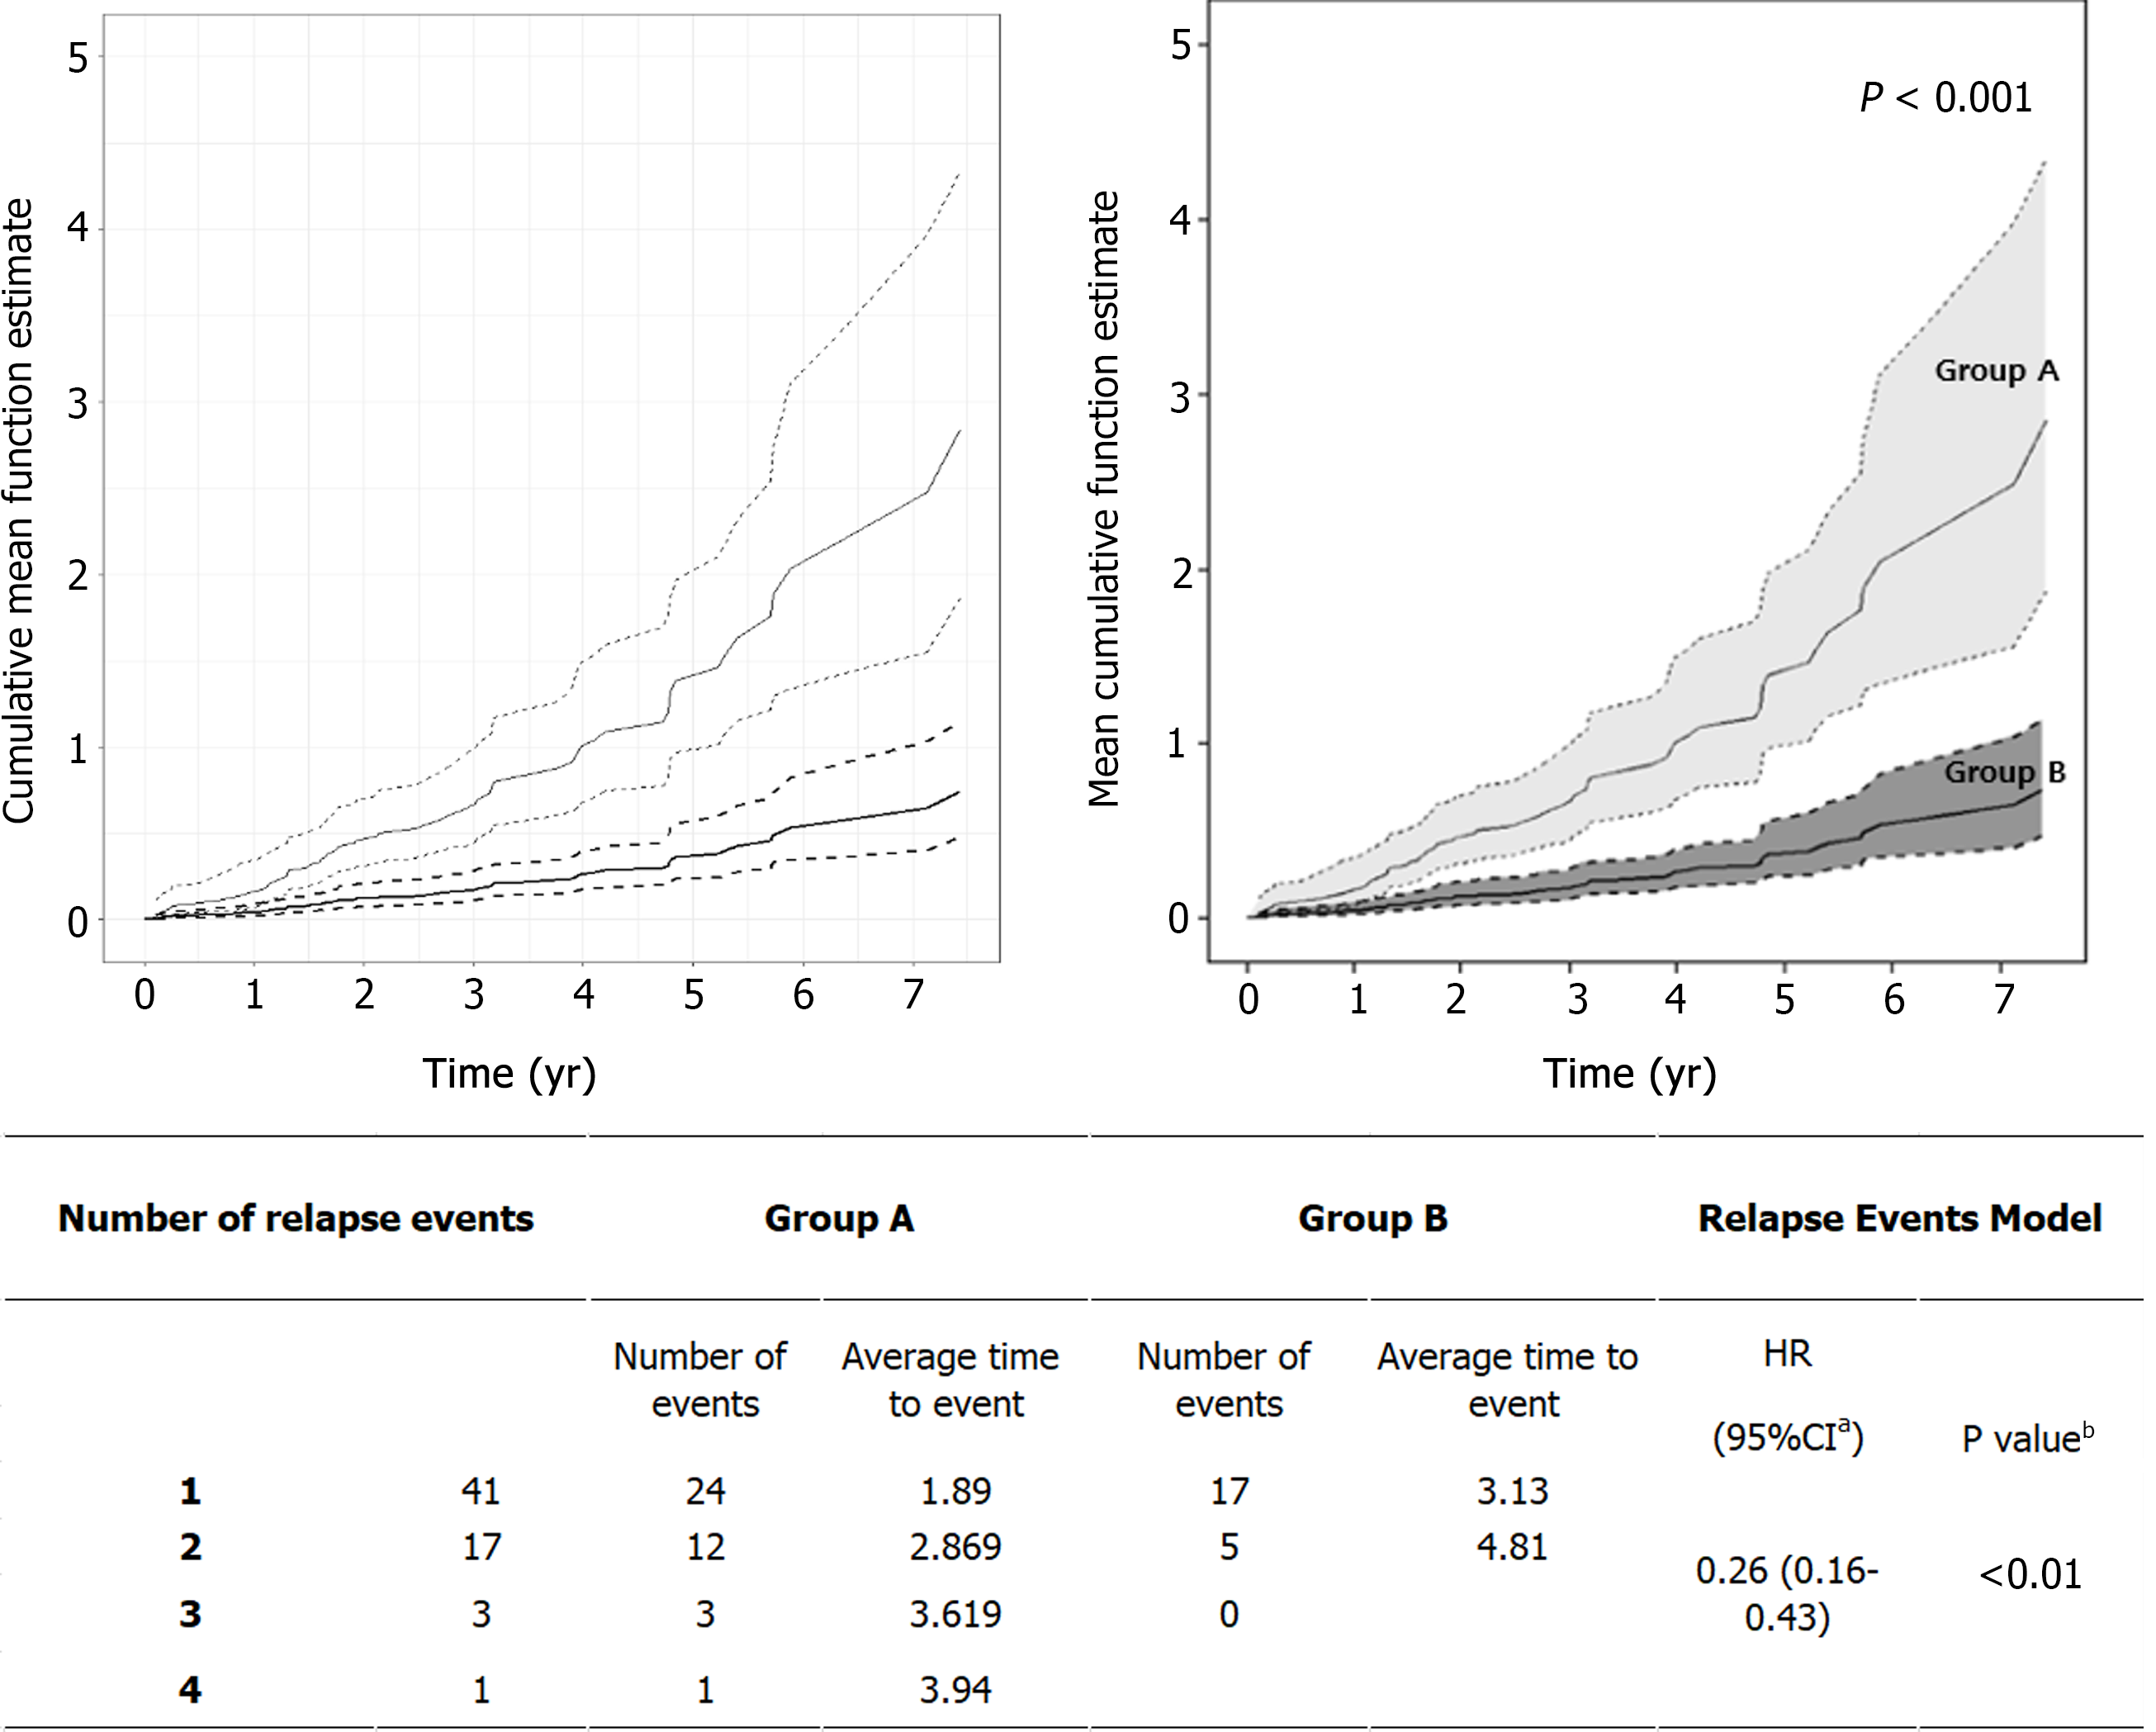
Figure 2 Mean cumulative function for multiple relapses over time.
The Y-axis is a cumulative relapse rate, which represents the cumulative hazard rate up to a specific point in time. The dotted line represents the 95% confidence interval for the cumulative risk rate. Group A: Thin black line; Group B: Thick black line.
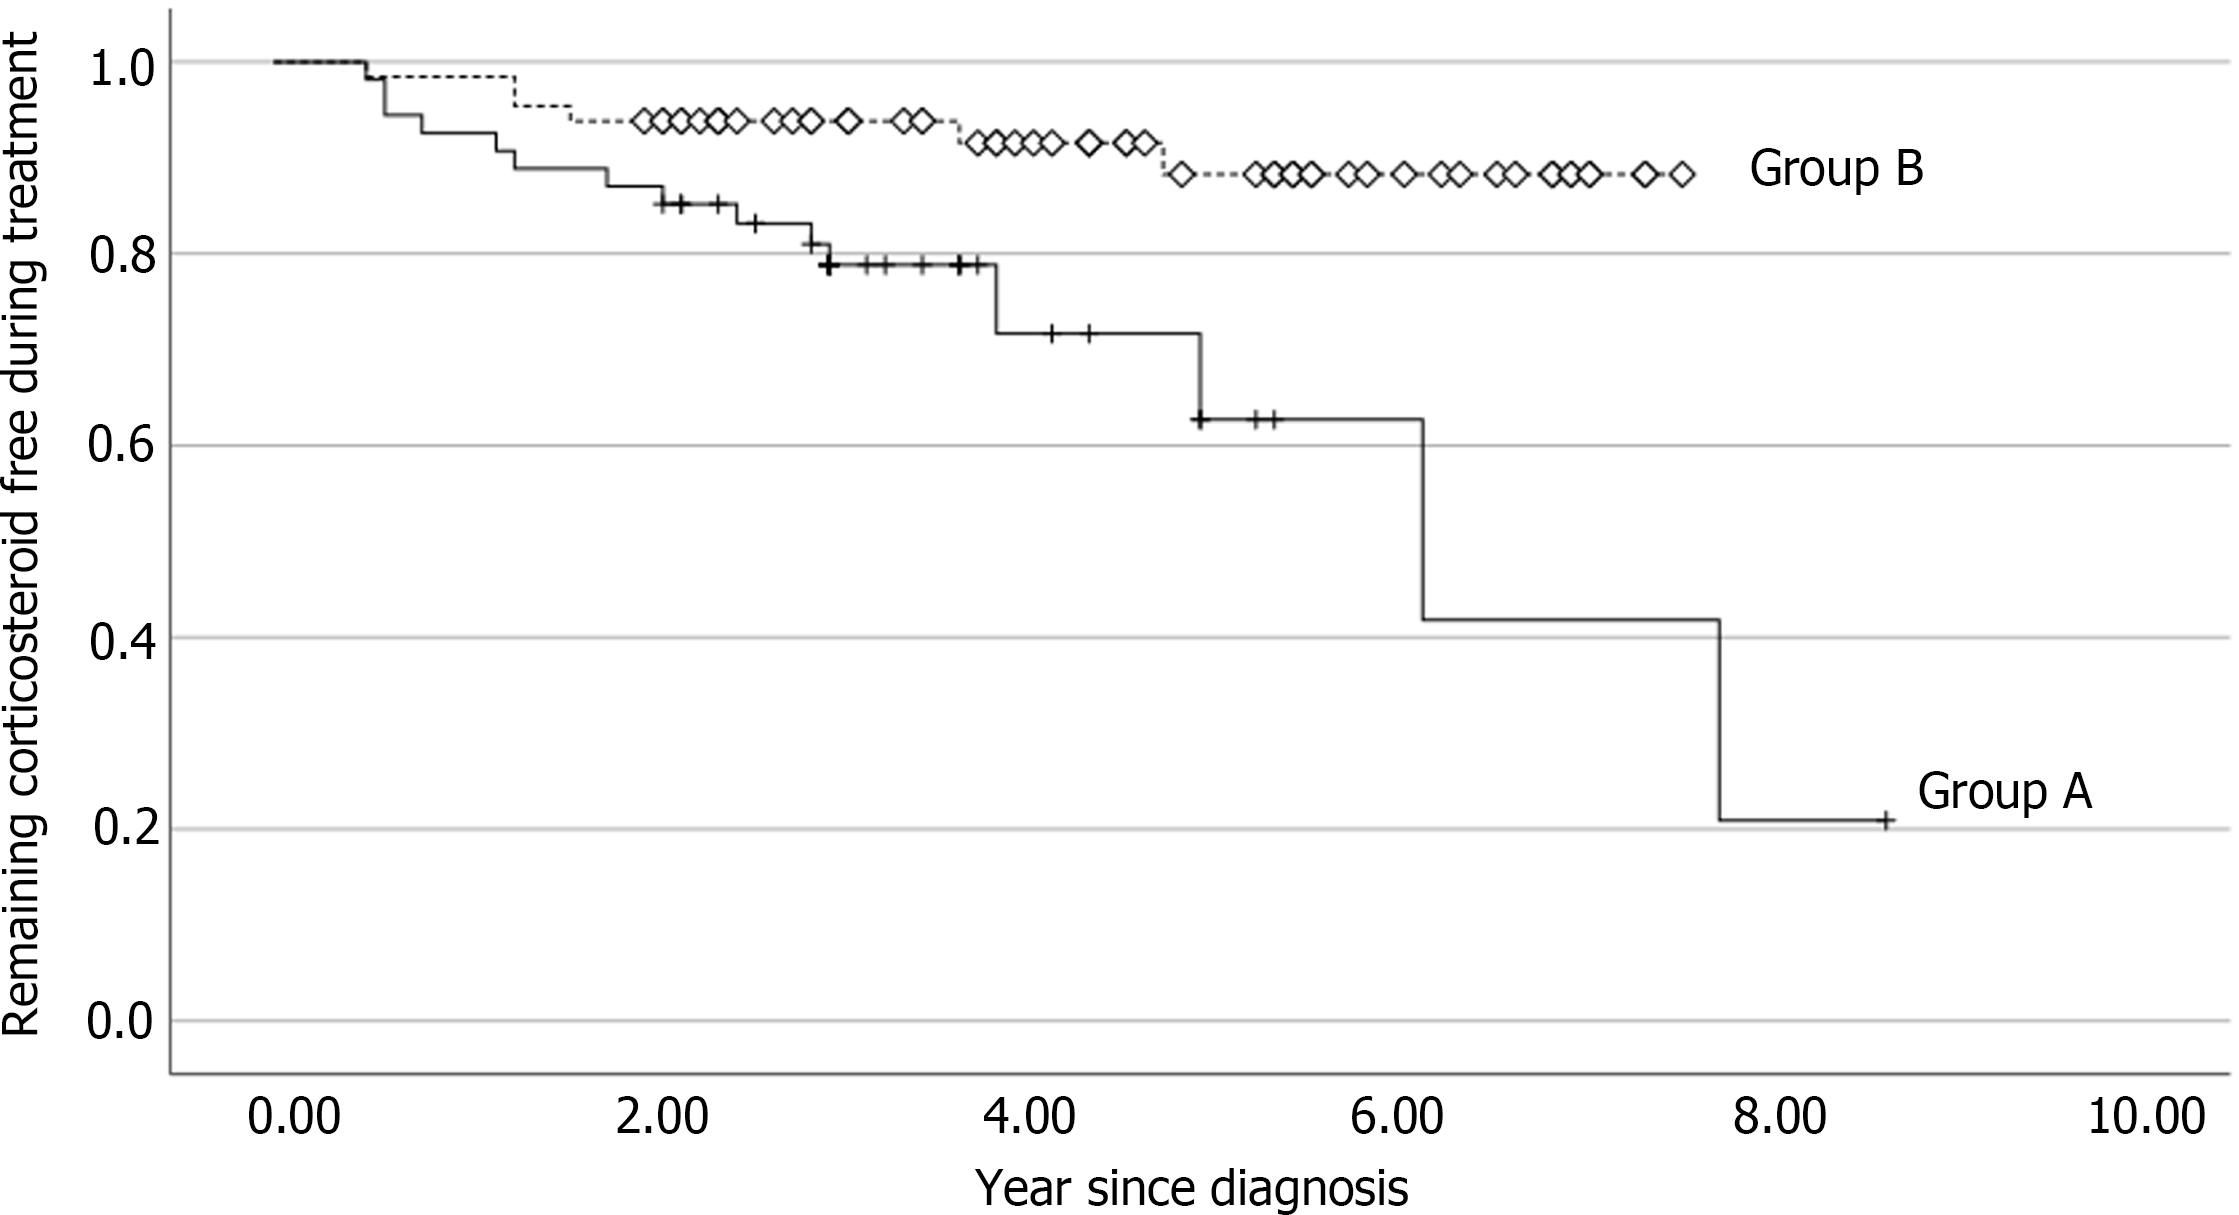
Figure 3 Analysis of corticosteroid-free survival curve after initiation of treatment using Kaplan-Meier method.
The solid line represents the proportion of patients who were treated from January 2003 to September 2012 and did not receive corticosteroids. The dotted line represents the same proportion among patients who were treated from October 2012 to October 2020. In the former group, the 2-yr corticosteroid-free retention rate is 21%; in the latter group, the rate is 88% (log-rank test, P = 0.003).
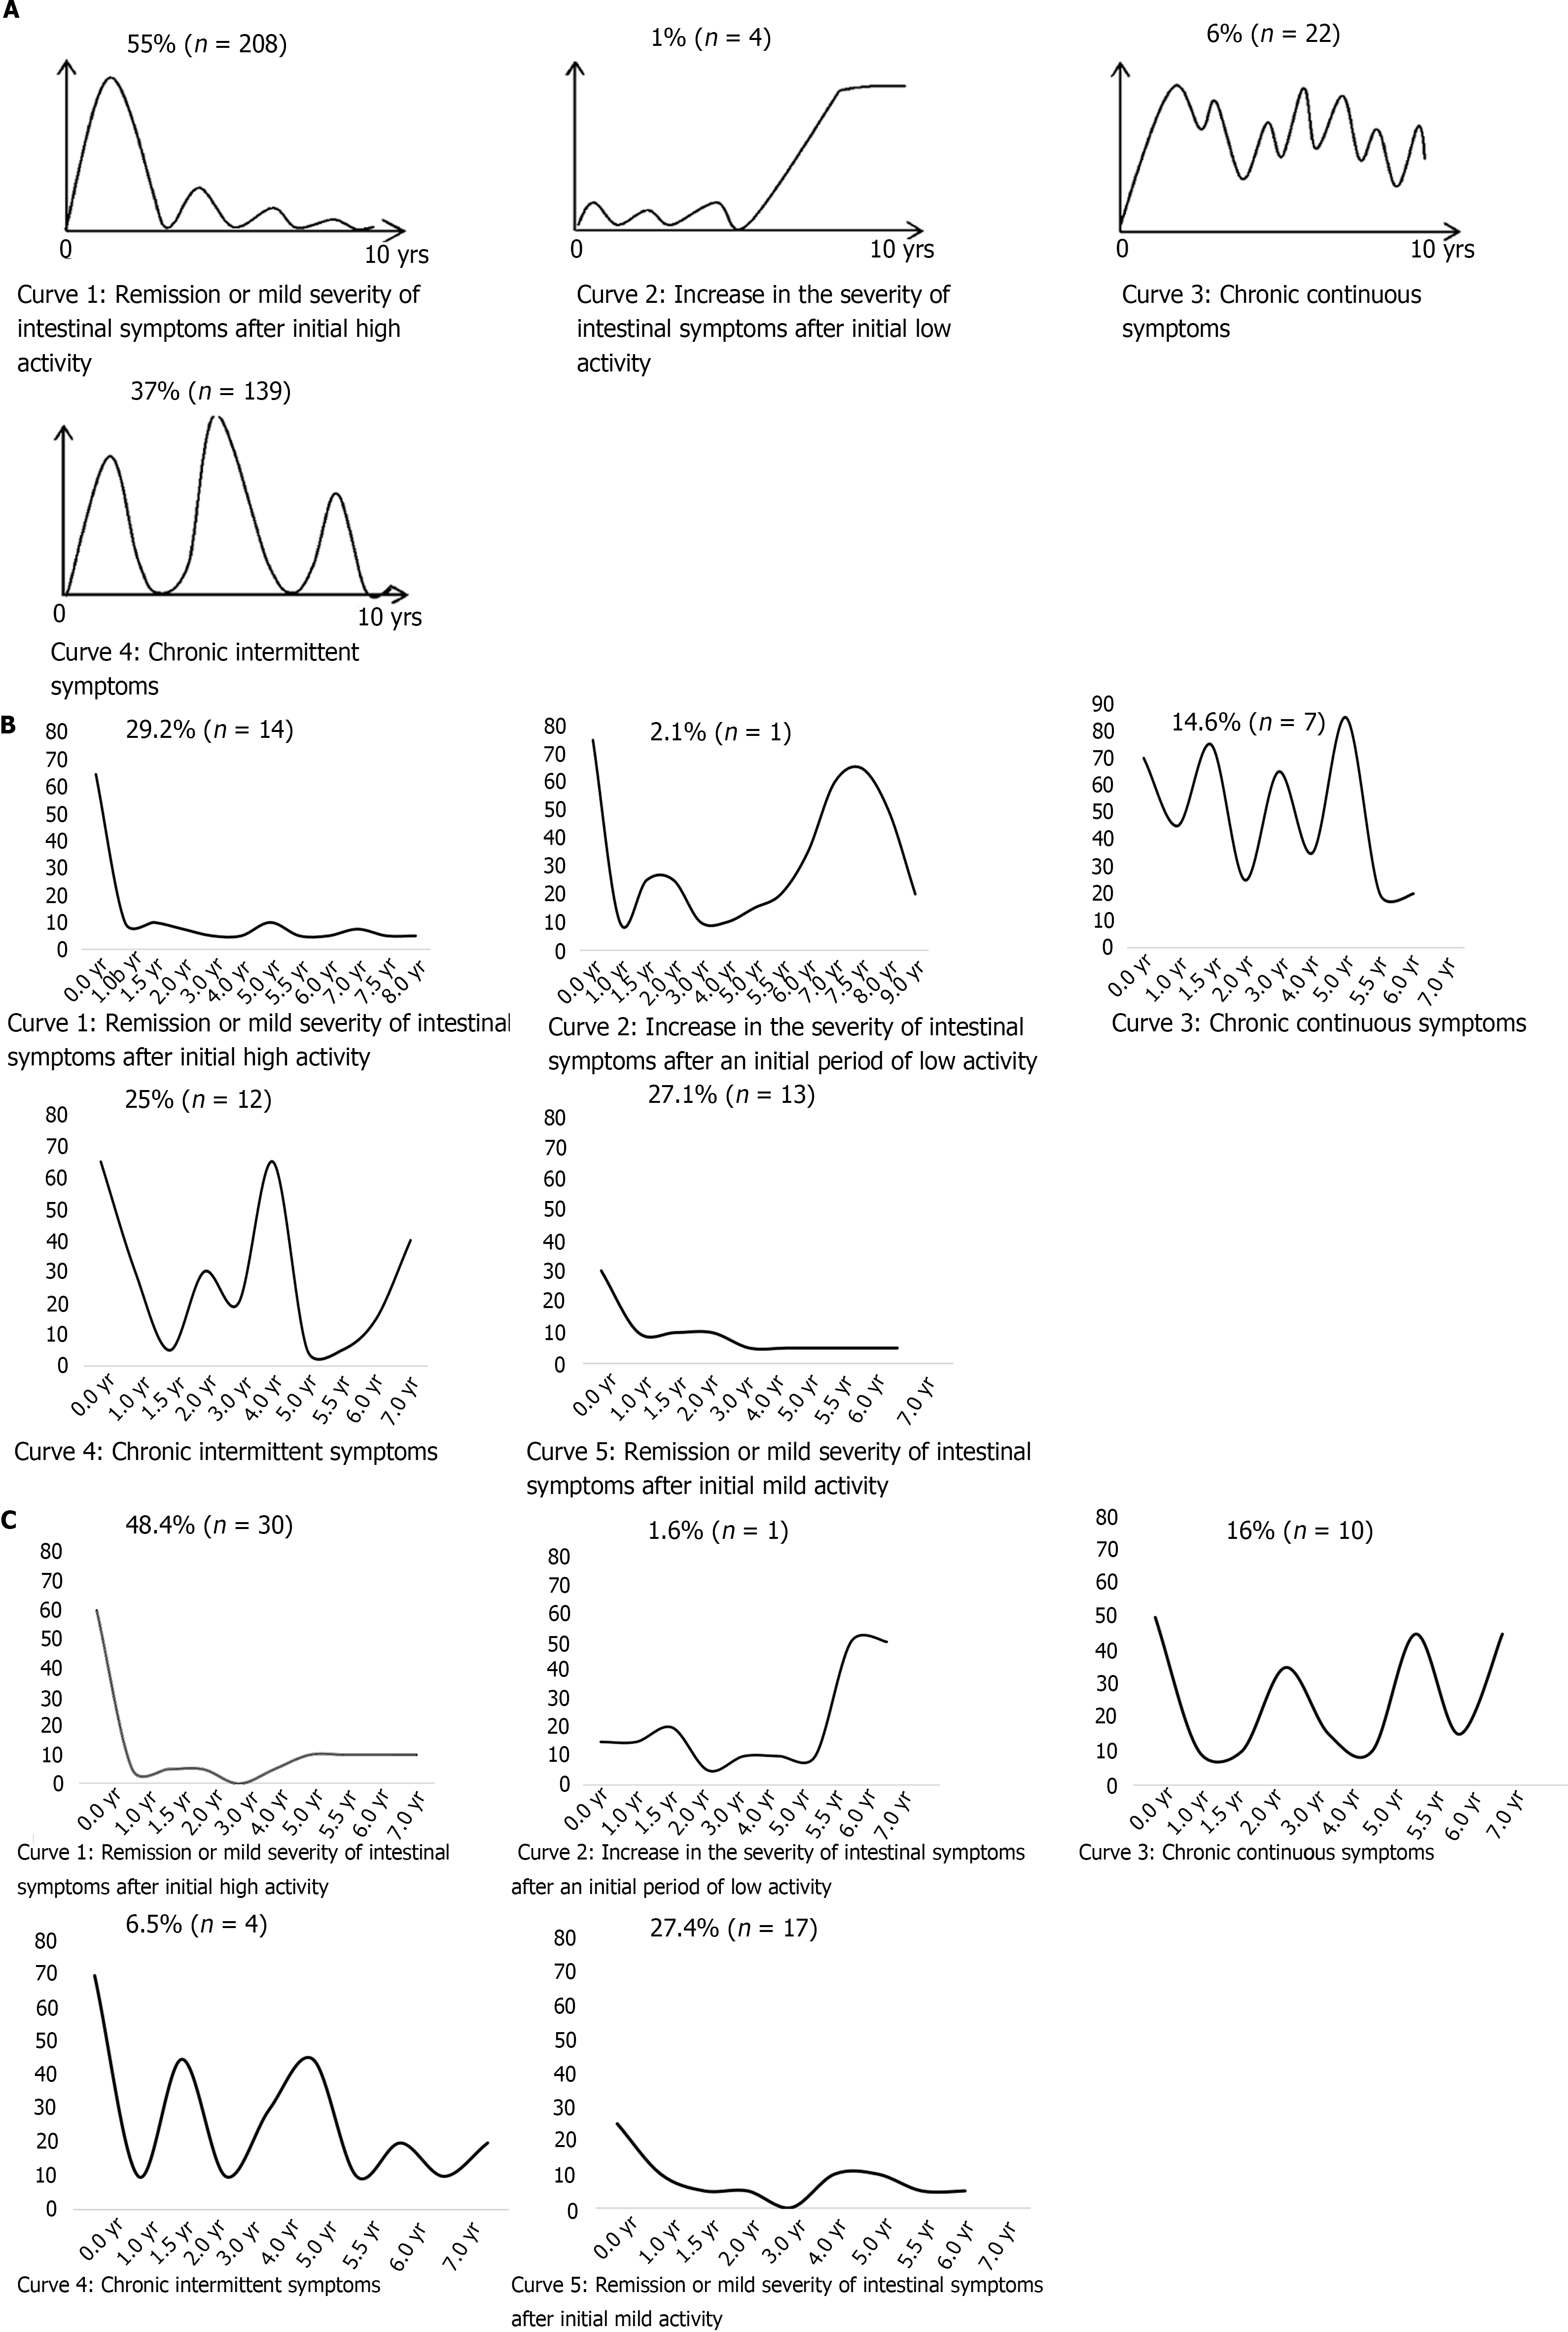
Figure 4 Comparison of clinical course curves of the IBSEN study.
A: Graphs of self-identified clinical course in the IBSEN study[6]; B: Actual clinical course according to pediatric ulcerative colitis activity index prior to the introduction of infliximab (Group A); C: Actual clinical course according to pediatric ulcerative colitis activity index after the introduction of infliximab (Group B). n: Number.
- Citation: Kwon Y, Kim ES, Choe YH, Kim MJ. How has the disease course of pediatric ulcerative colitis changed throughout the biologics era? A comparison with the IBSEN study. World J Gastroenterol 2022; 28(28): 3666-3681
- URL: https://www.wjgnet.com/1007-9327/full/v28/i28/3666.htm
- DOI: https://dx.doi.org/10.3748/wjg.v28.i28.3666


