Copyright
©The Author(s) 2022.
World J Gastroenterol. Jul 28, 2022; 28(28): 3644-3665
Published online Jul 28, 2022. doi: 10.3748/wjg.v28.i28.3644
Published online Jul 28, 2022. doi: 10.3748/wjg.v28.i28.3644
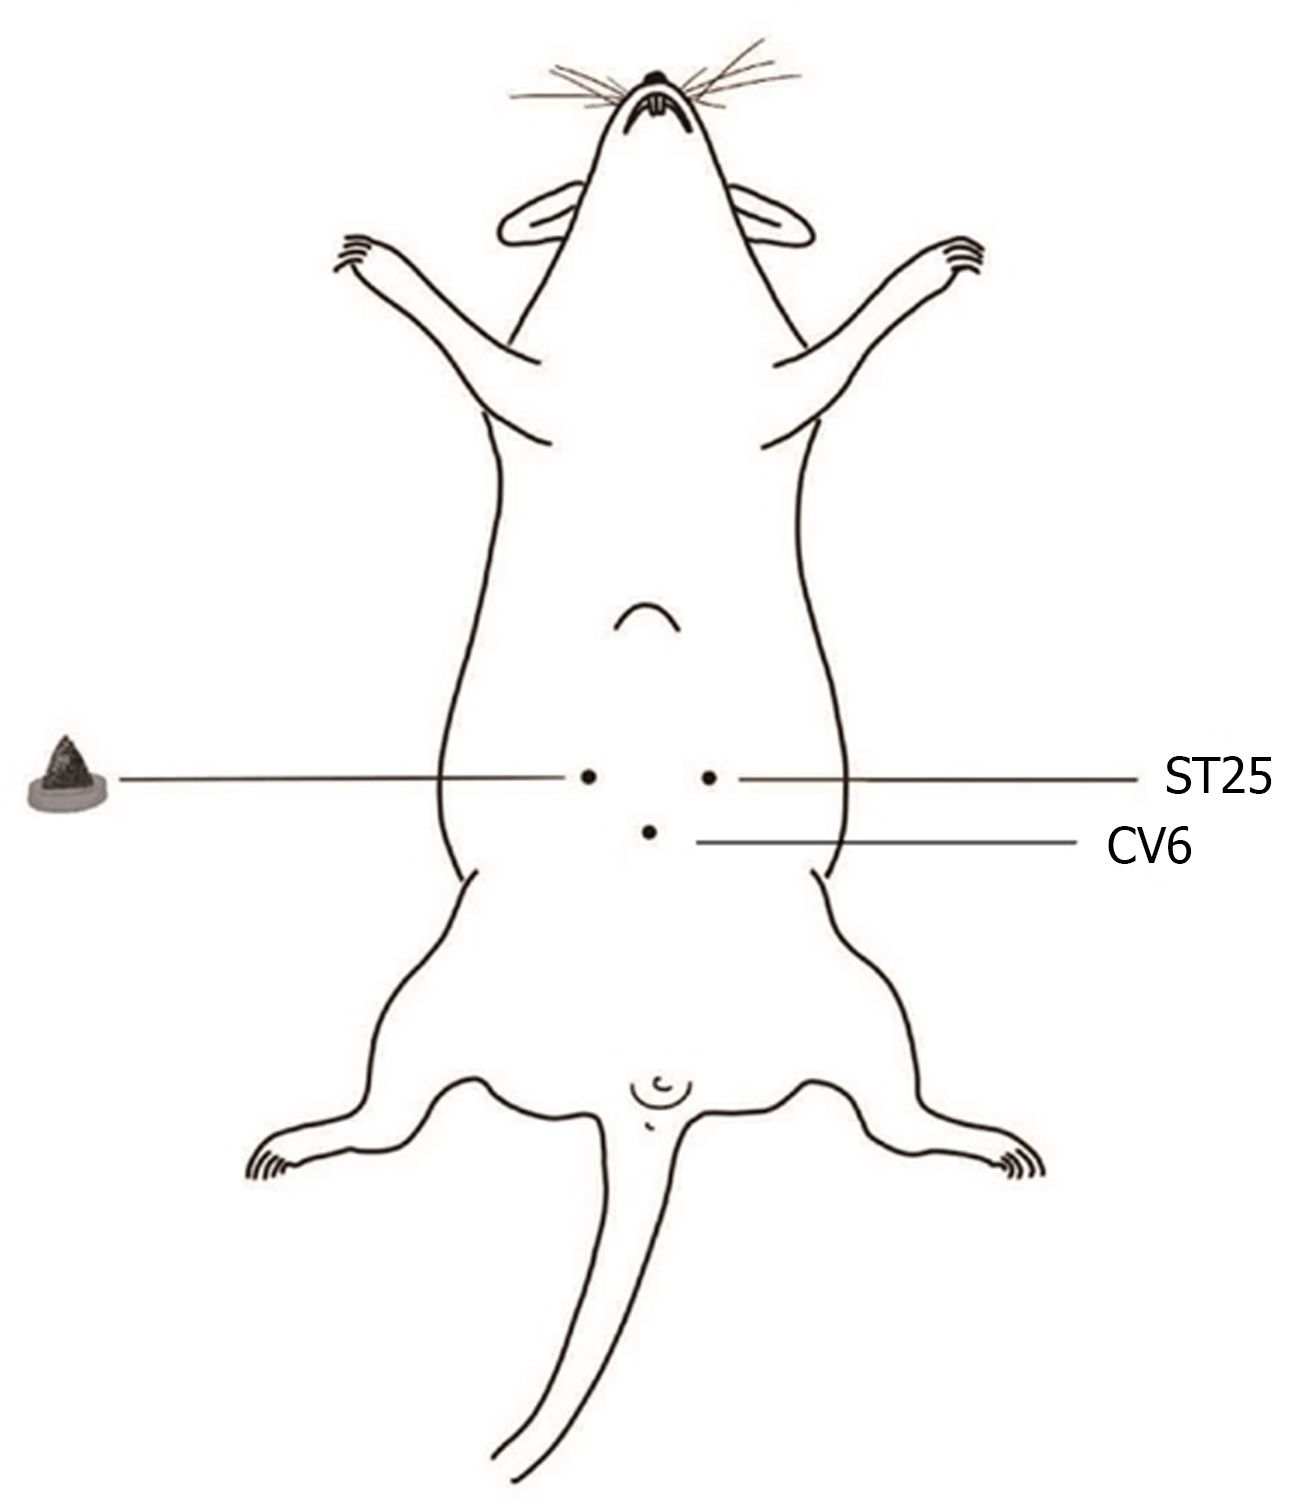
Figure 1
Schematic diagram of herb-partitioned moxibustion at the rat Tianshu (ST25, bilateral) and Qihai (CV6) acupoints.
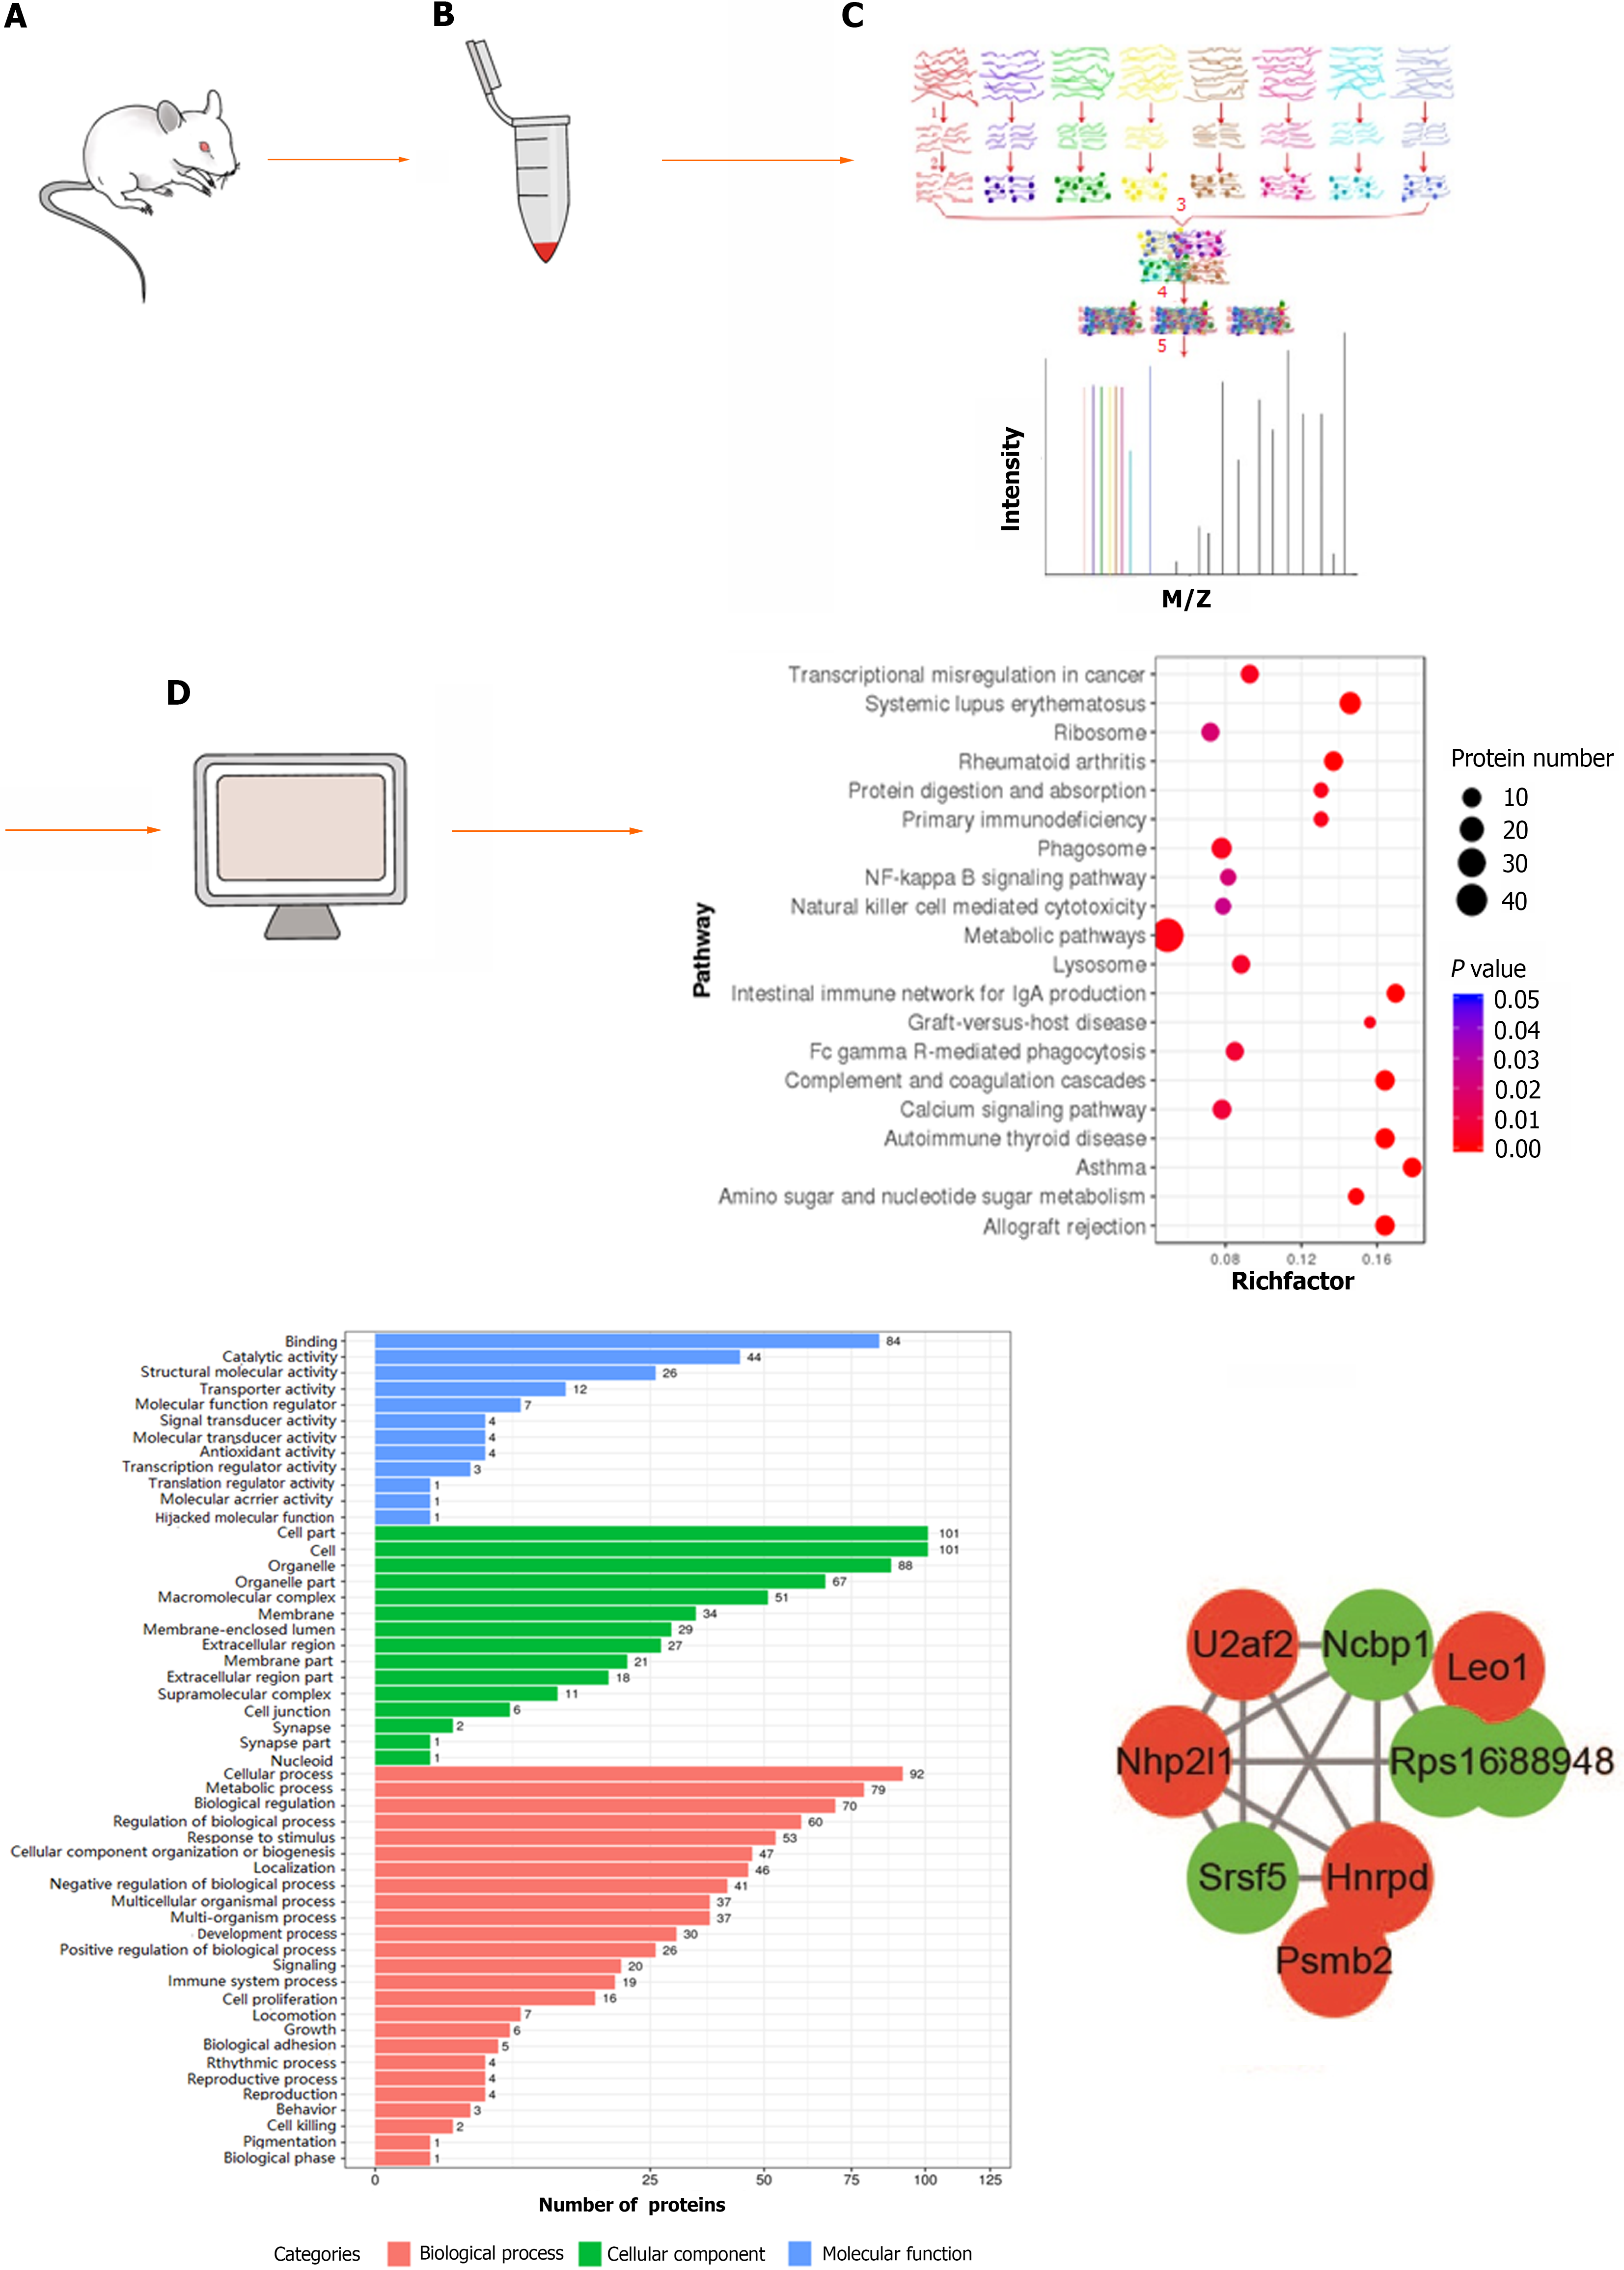
Figure 2 Flow chart of proteomics detection and analysis.
A: Sprague-Dawley rat; B: Protein extraction of colon tissue; C: Protein enzymatic digestion, peptide labelling, separation, and high-performance liquid chromatography analysis; D: Bioinformatics analysis.
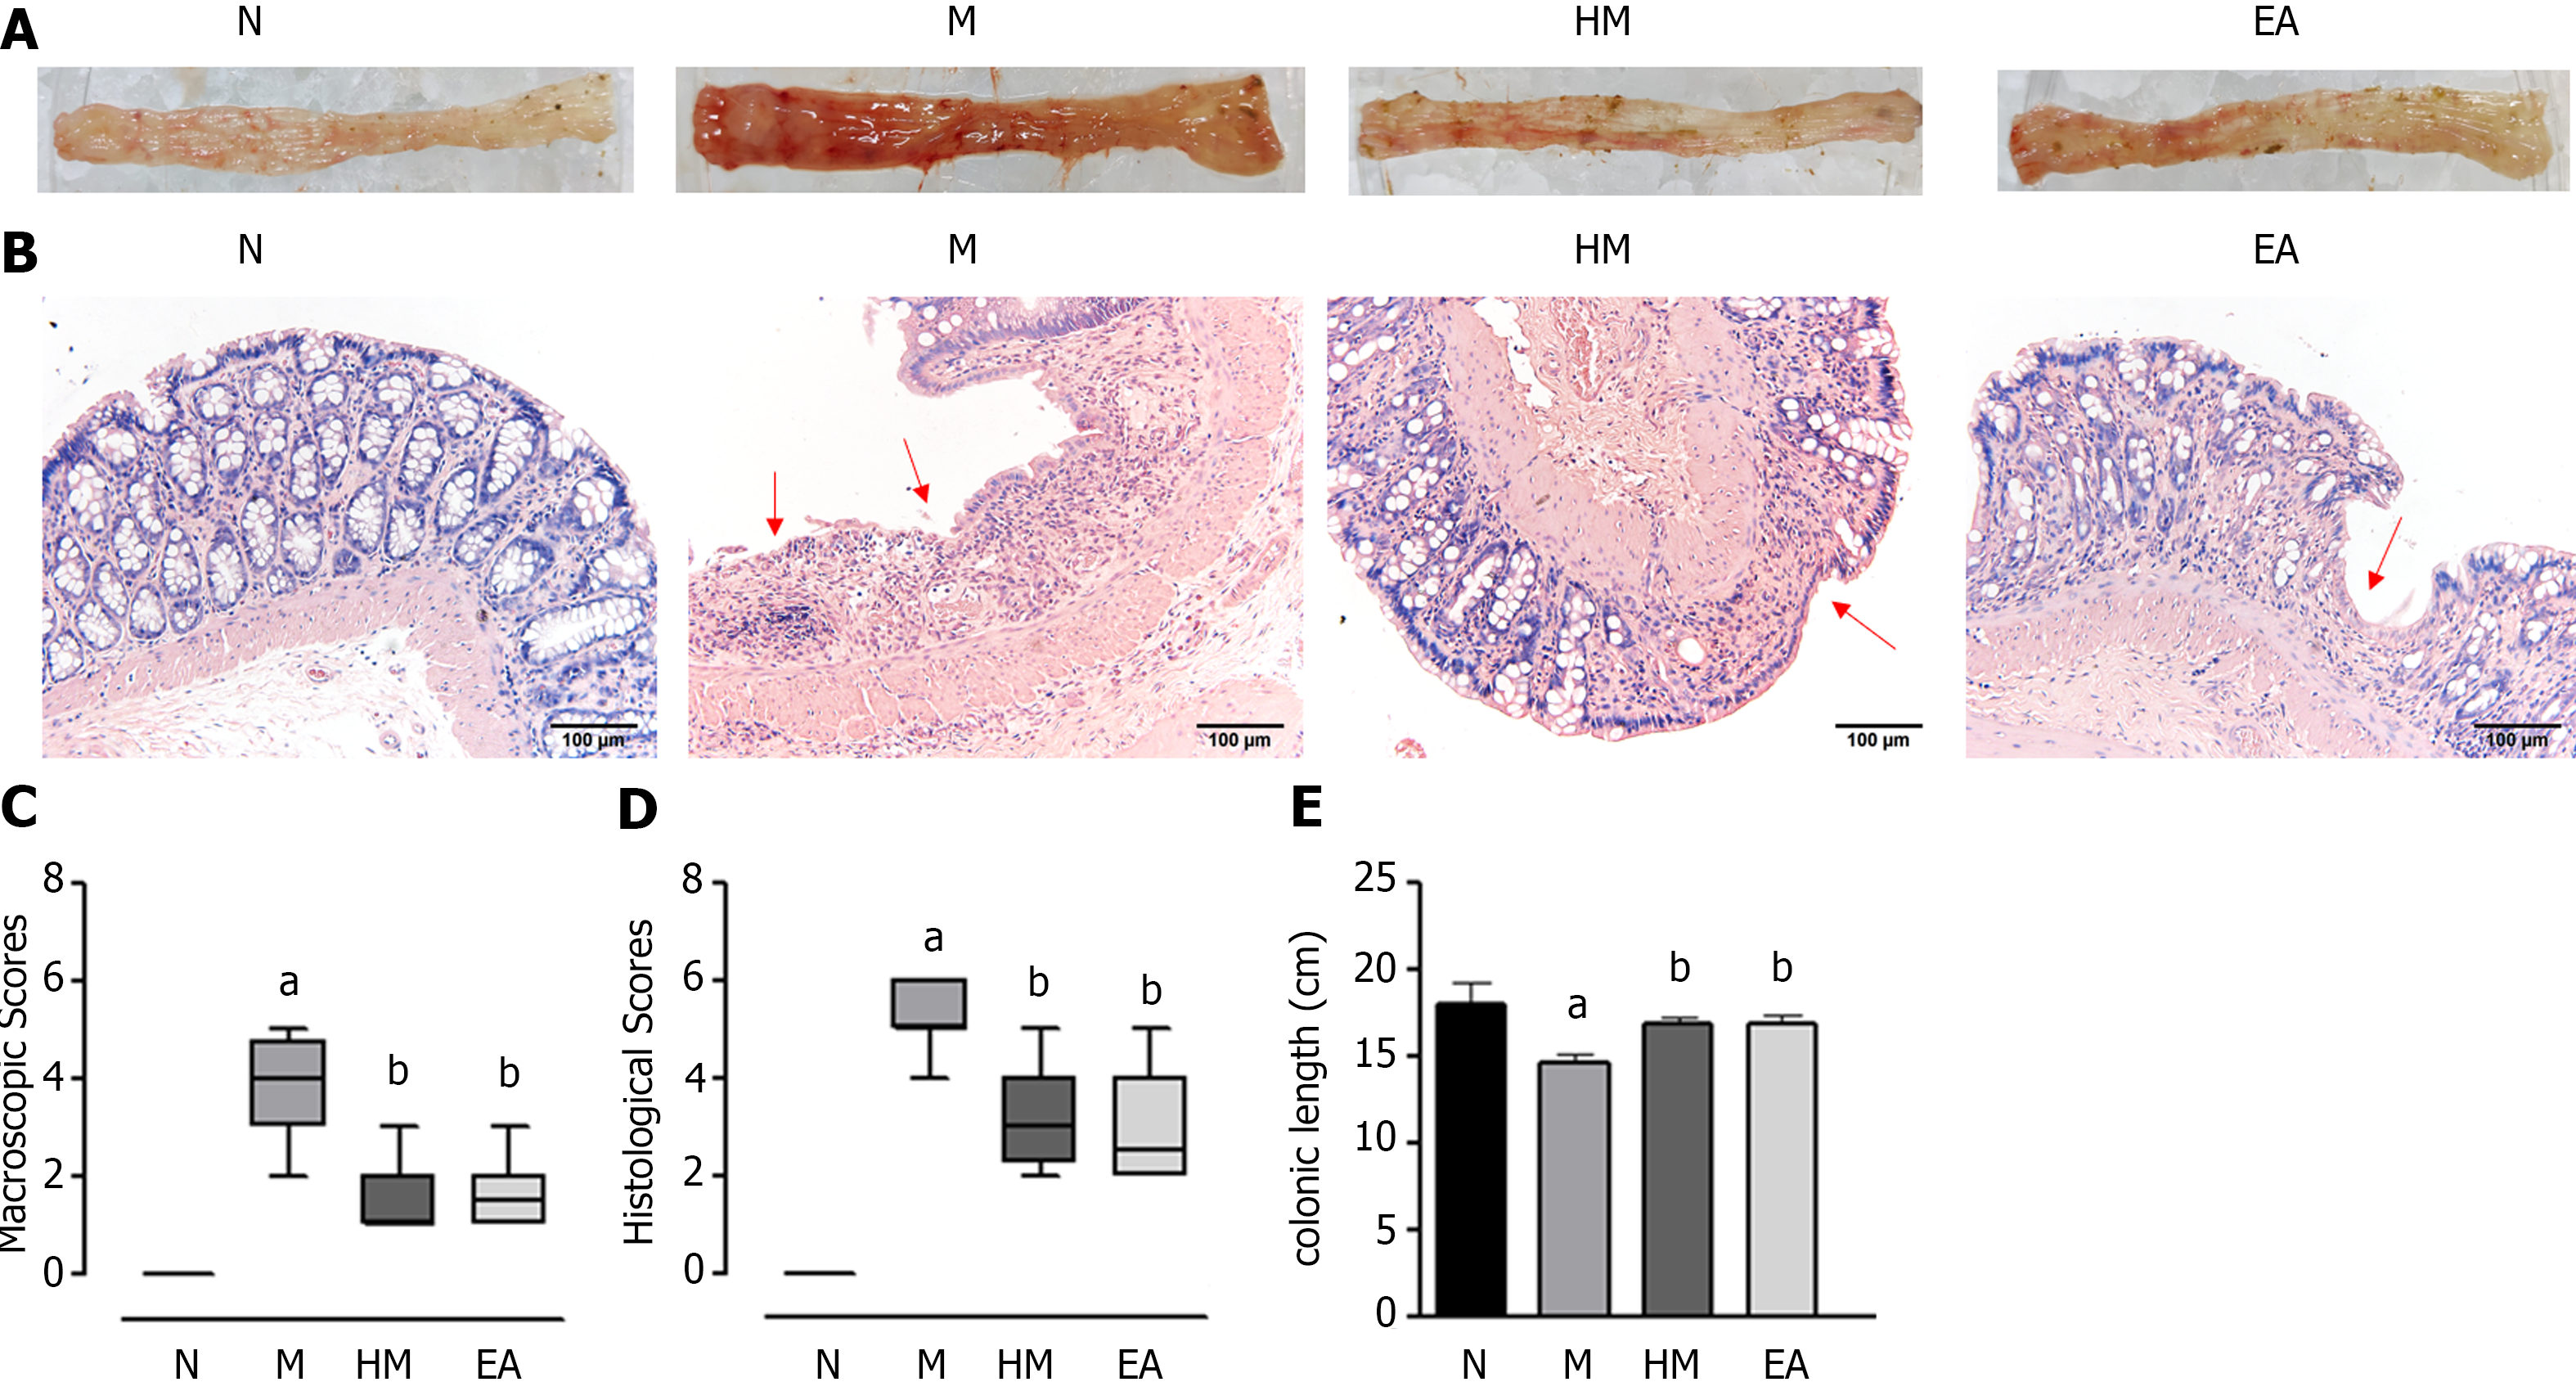
Figure 3 Colon tissue injuries in each group.
A: Gross structure; B: Histopathological observation (hematoxylin and eosin, × 200); C: Macroscopic scores; D: Histopathological scores; E: Colonic length. aP < 0.01 vs N group; bP < 0.01 vs M group. N: Normal group; M: Dextran sulfate sodium-induced ulcerative colitis model group; HM: Herb-partitioned moxibustion group; EA: Electroacupuncture group.
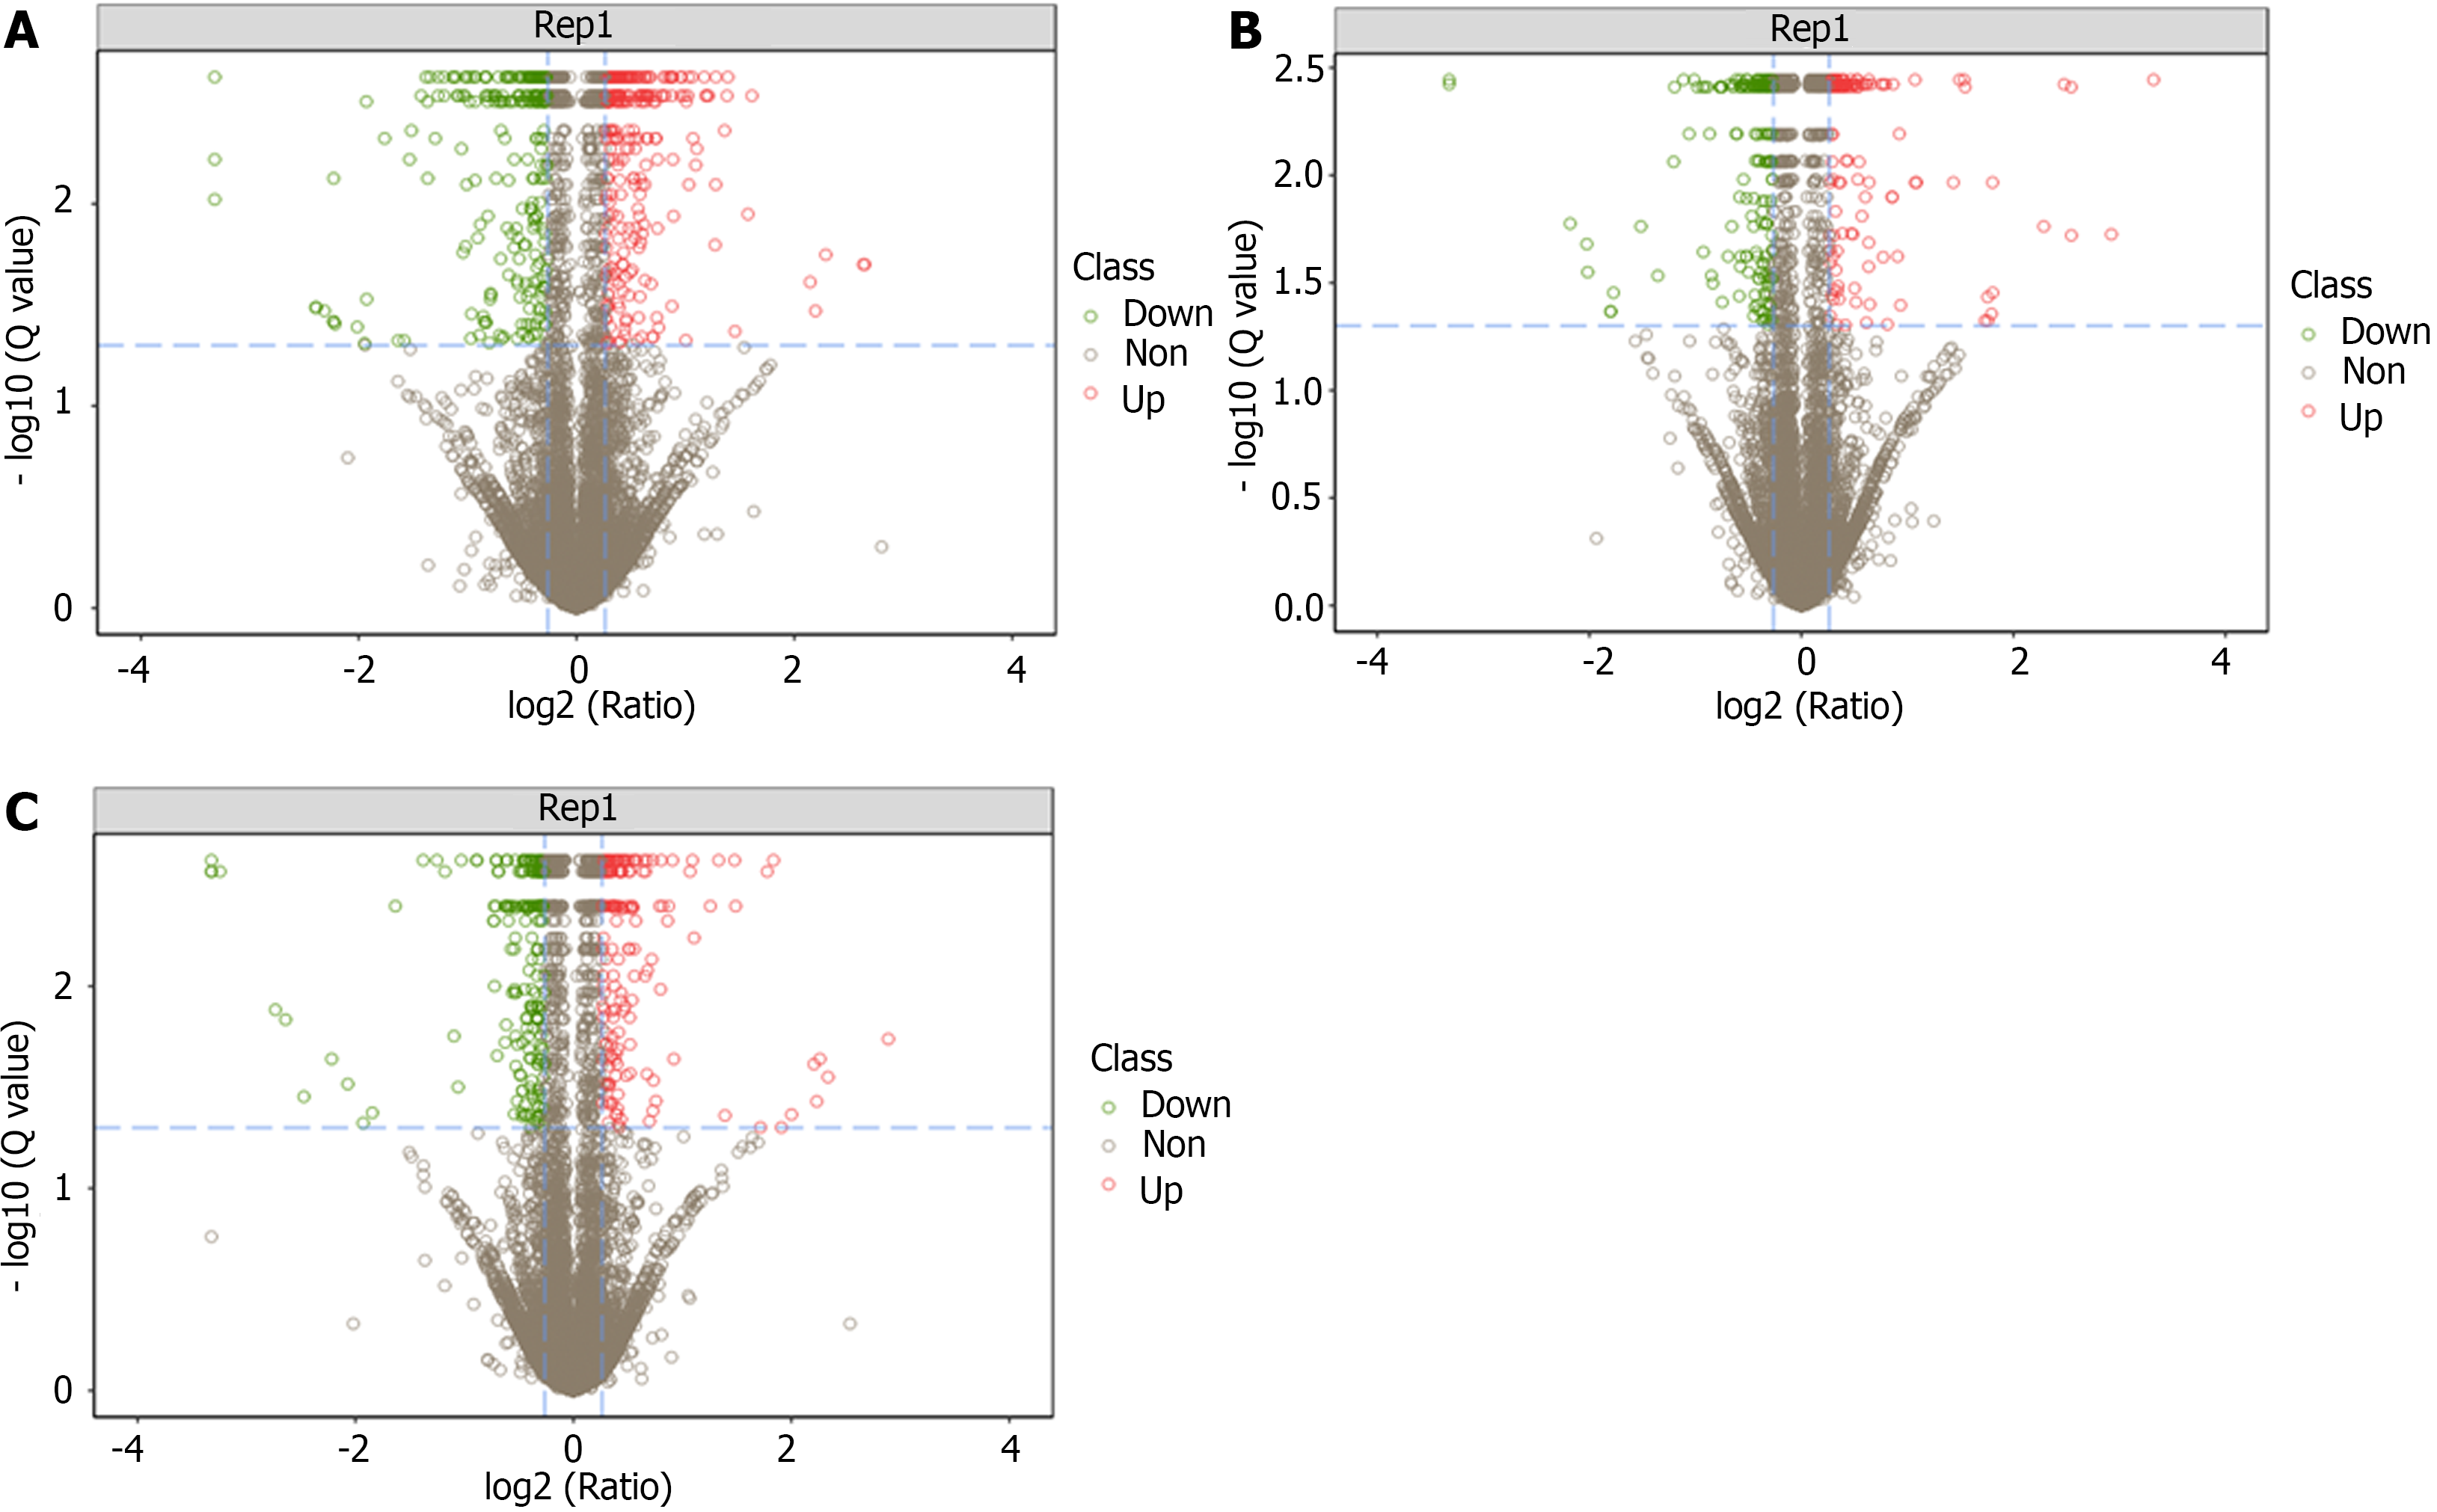
Figure 4 Volcano plot of differentially expressed proteins between groups.
A: Volcano plot of differentially expressed proteins (DEPs) between the normal and dextran sulfate sodium-induced ulcerative colitis model group; B: Volcano plot of DEPs between the dextran sulfate sodium-induced ulcerative colitis model and herb-partitioned moxibustion group; C: Volcano plot of DEPs between the dextran sulfate sodium-induced ulcerative colitis model and electroacupuncture group.
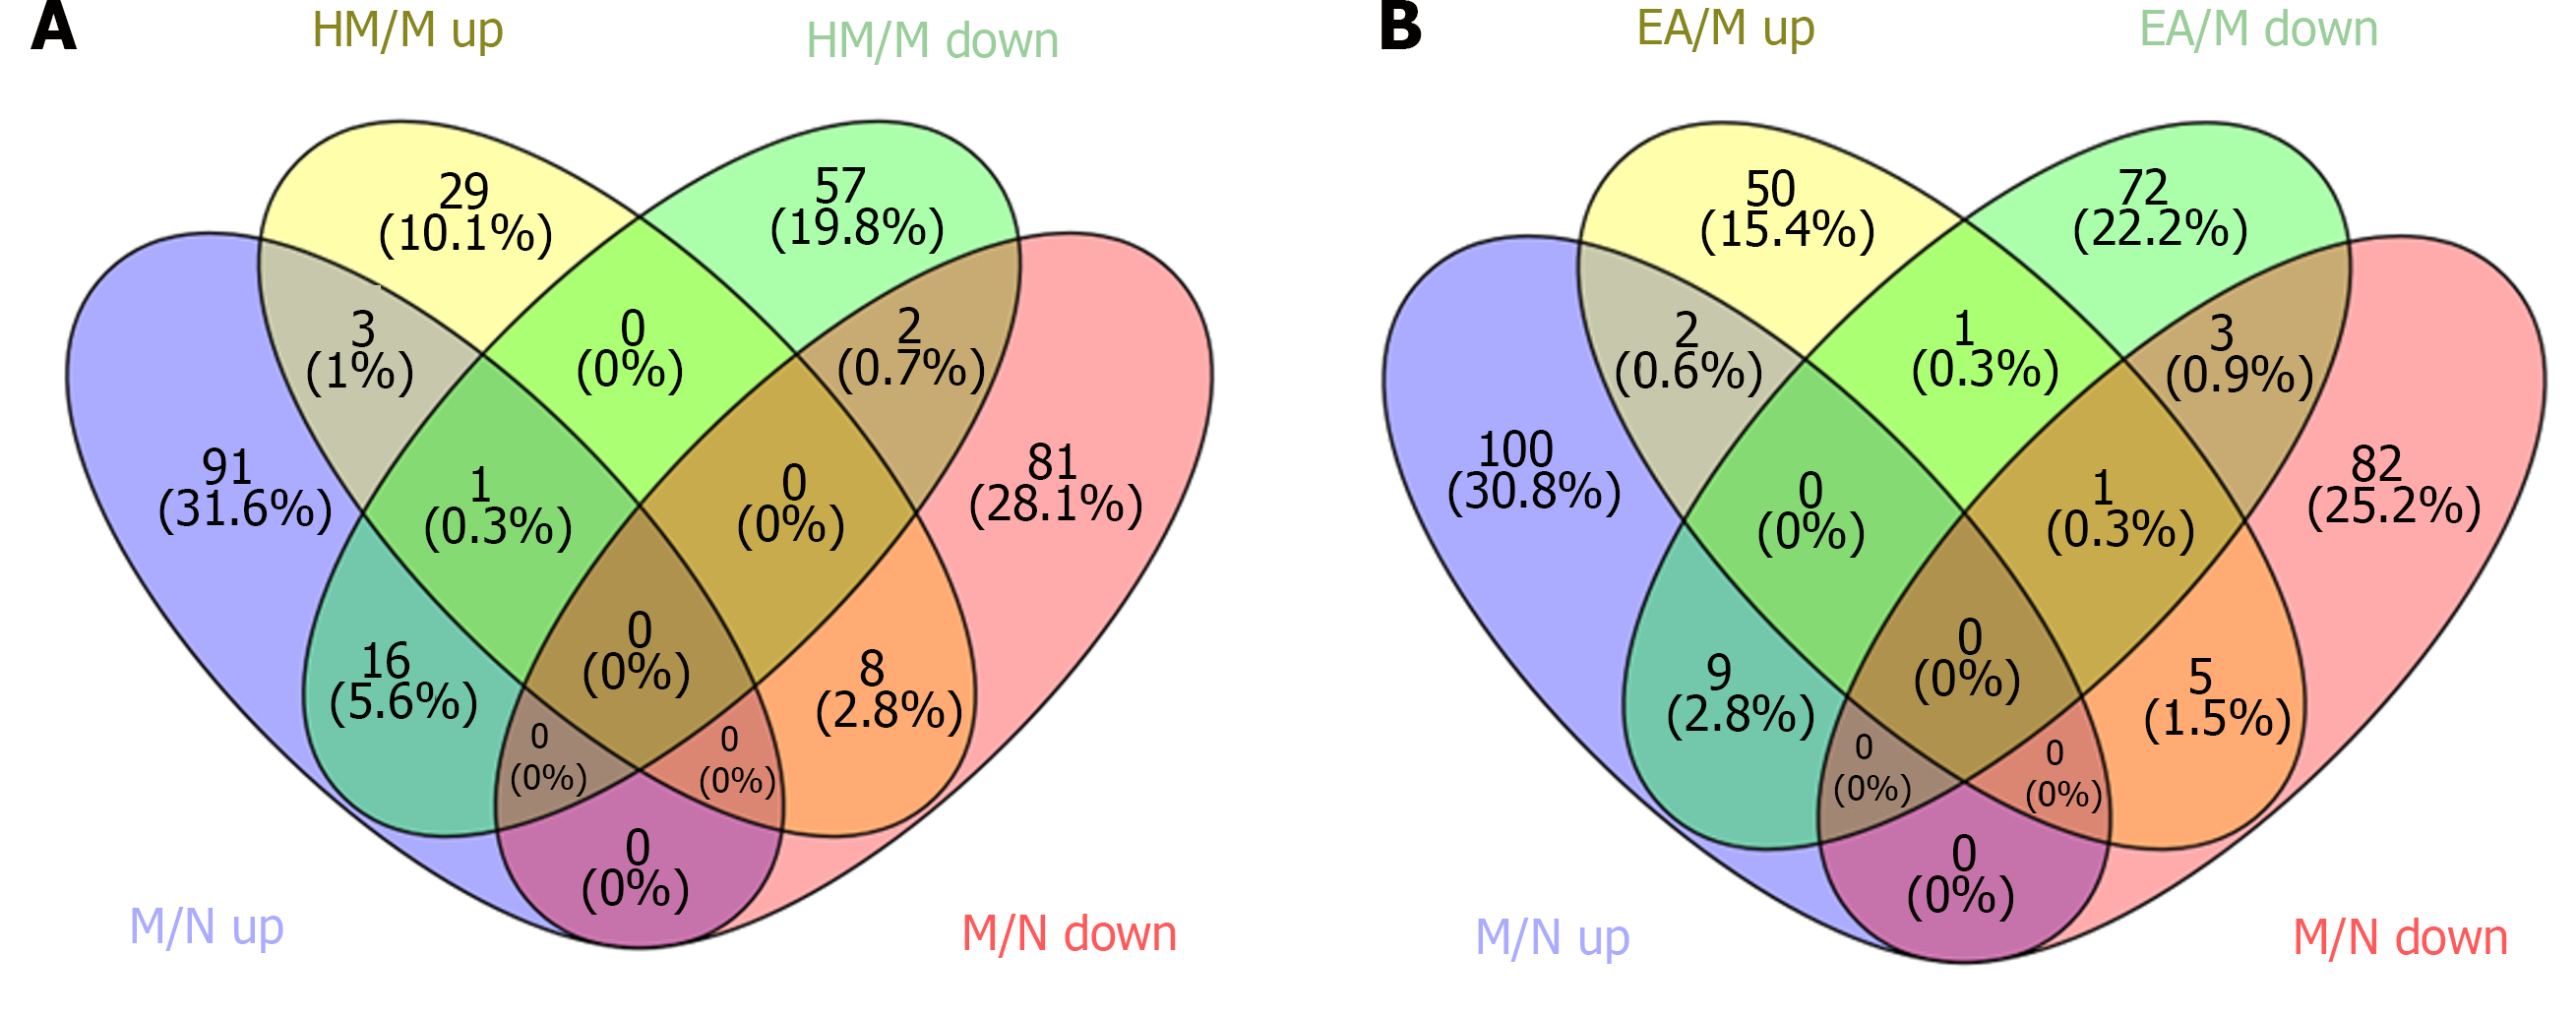
Figure 5 Venn diagram of differentially expressed proteins among groups.
A: Venn diagram of differentially expressed proteins (DEPs) in dextran sulfate sodium-induced ulcerative colitis model group that can be regulated by herb-partitioned moxibustion; B: Venn diagram of DEPs in dextran sulfate sodium-induced ulcerative colitis model group that can be regulated by electroacupuncture. N: Normal group; M: Dextran sulfate sodium-induced ulcerative colitis model group; HM: Herb-partitioned moxibustion group; EA: Electroacupuncture group.
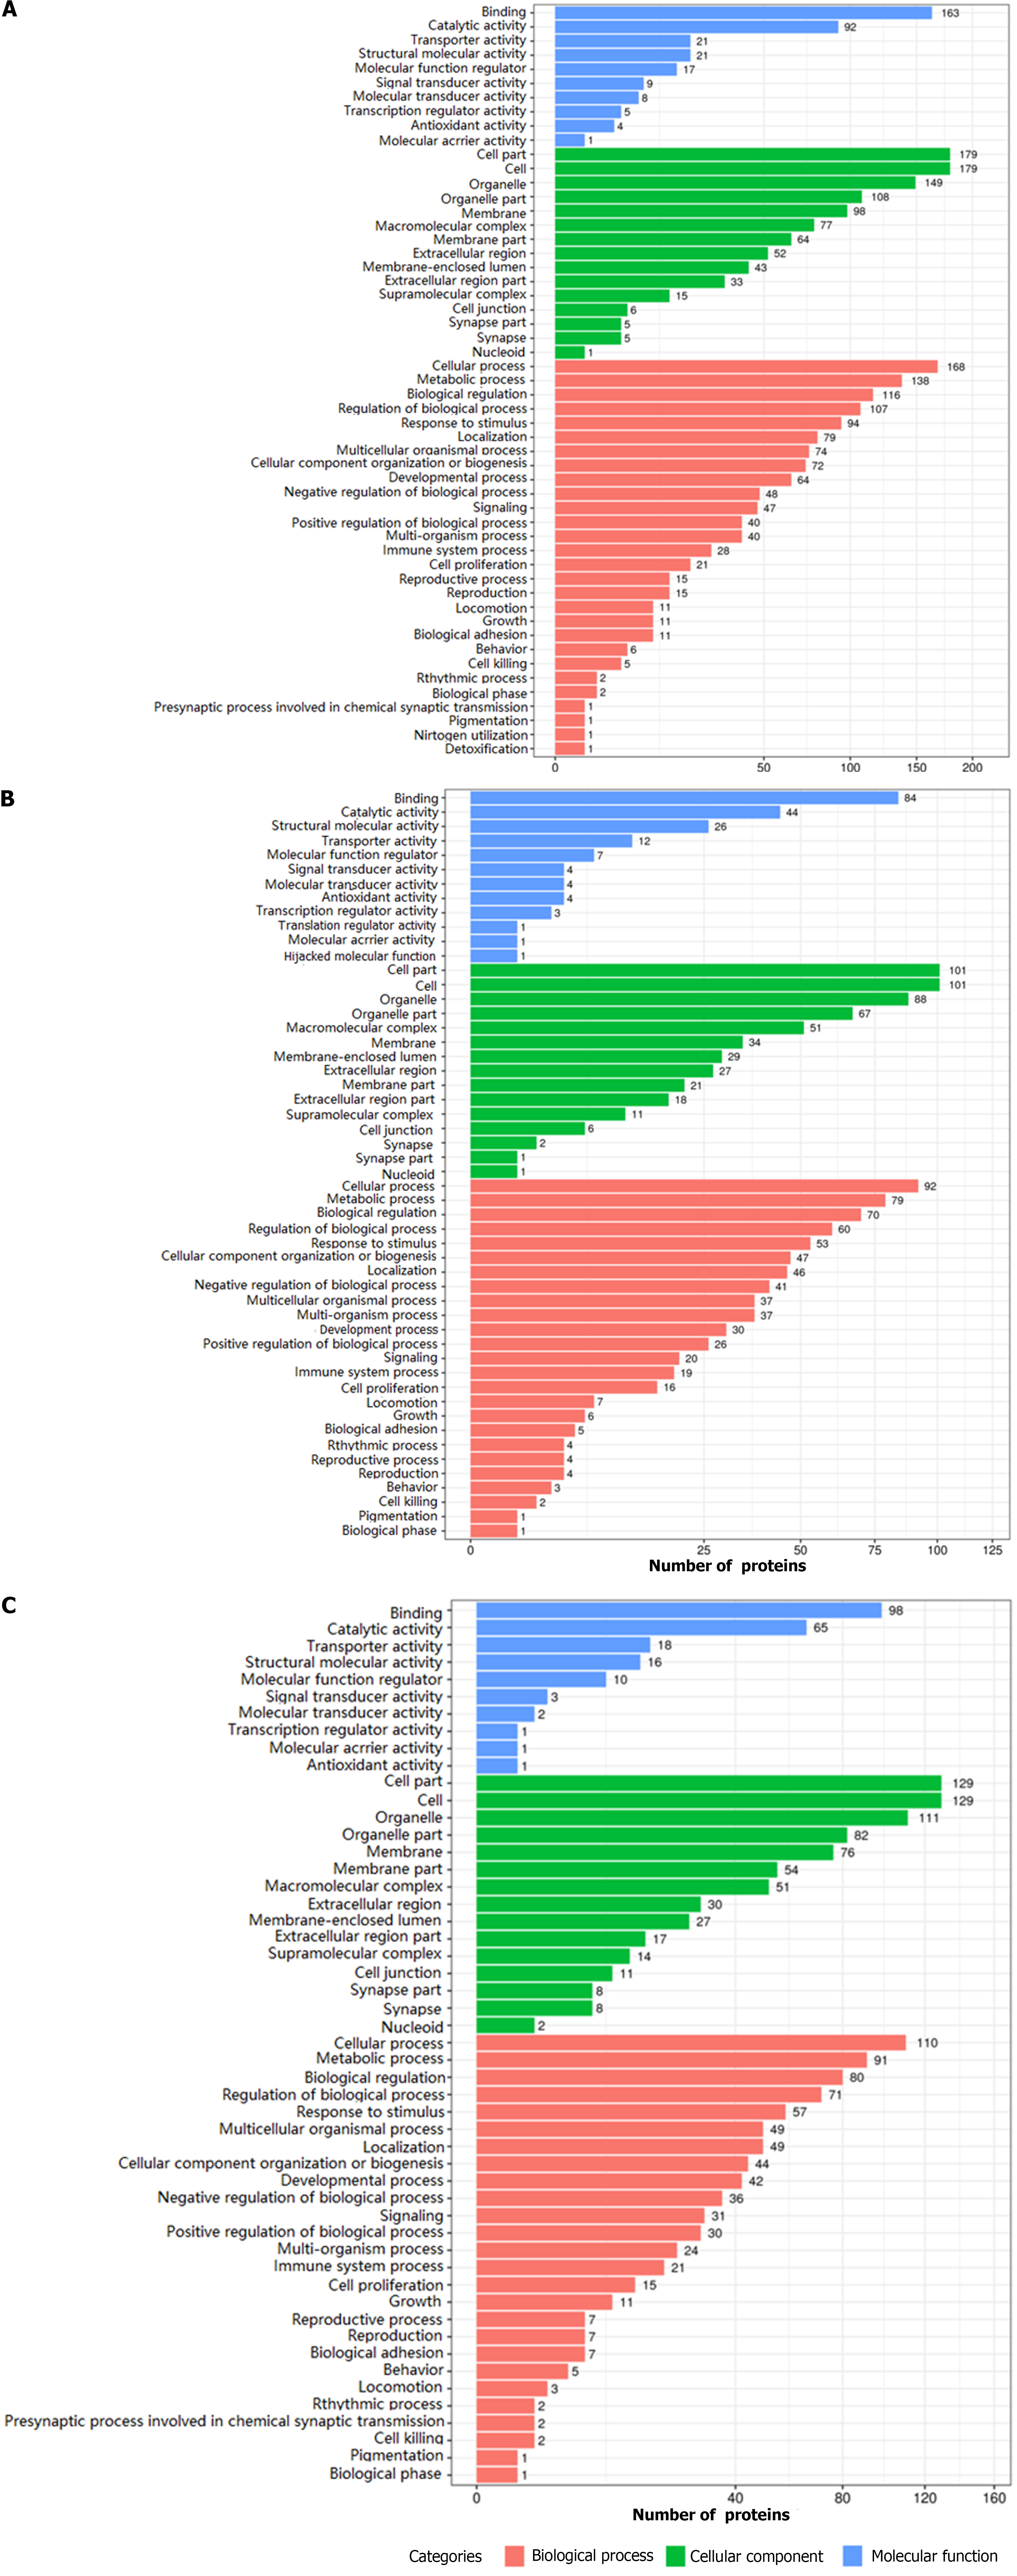
Figure 6 Biological function annotation of differentially expressed proteins between groups.
A: Biological function annotation of differentially expressed proteins (DEPs) between the normal and dextran sulfate sodium-induced ulcerative colitis model group; B: Biological function annotation of DEPs between the dextran sulfate sodium-induced ulcerative colitis model and herb-partitioned moxibustion group; C: biological function annotation of DEPs between the dextran sulfate sodium-induced ulcerative colitis model and electroacupuncture group.
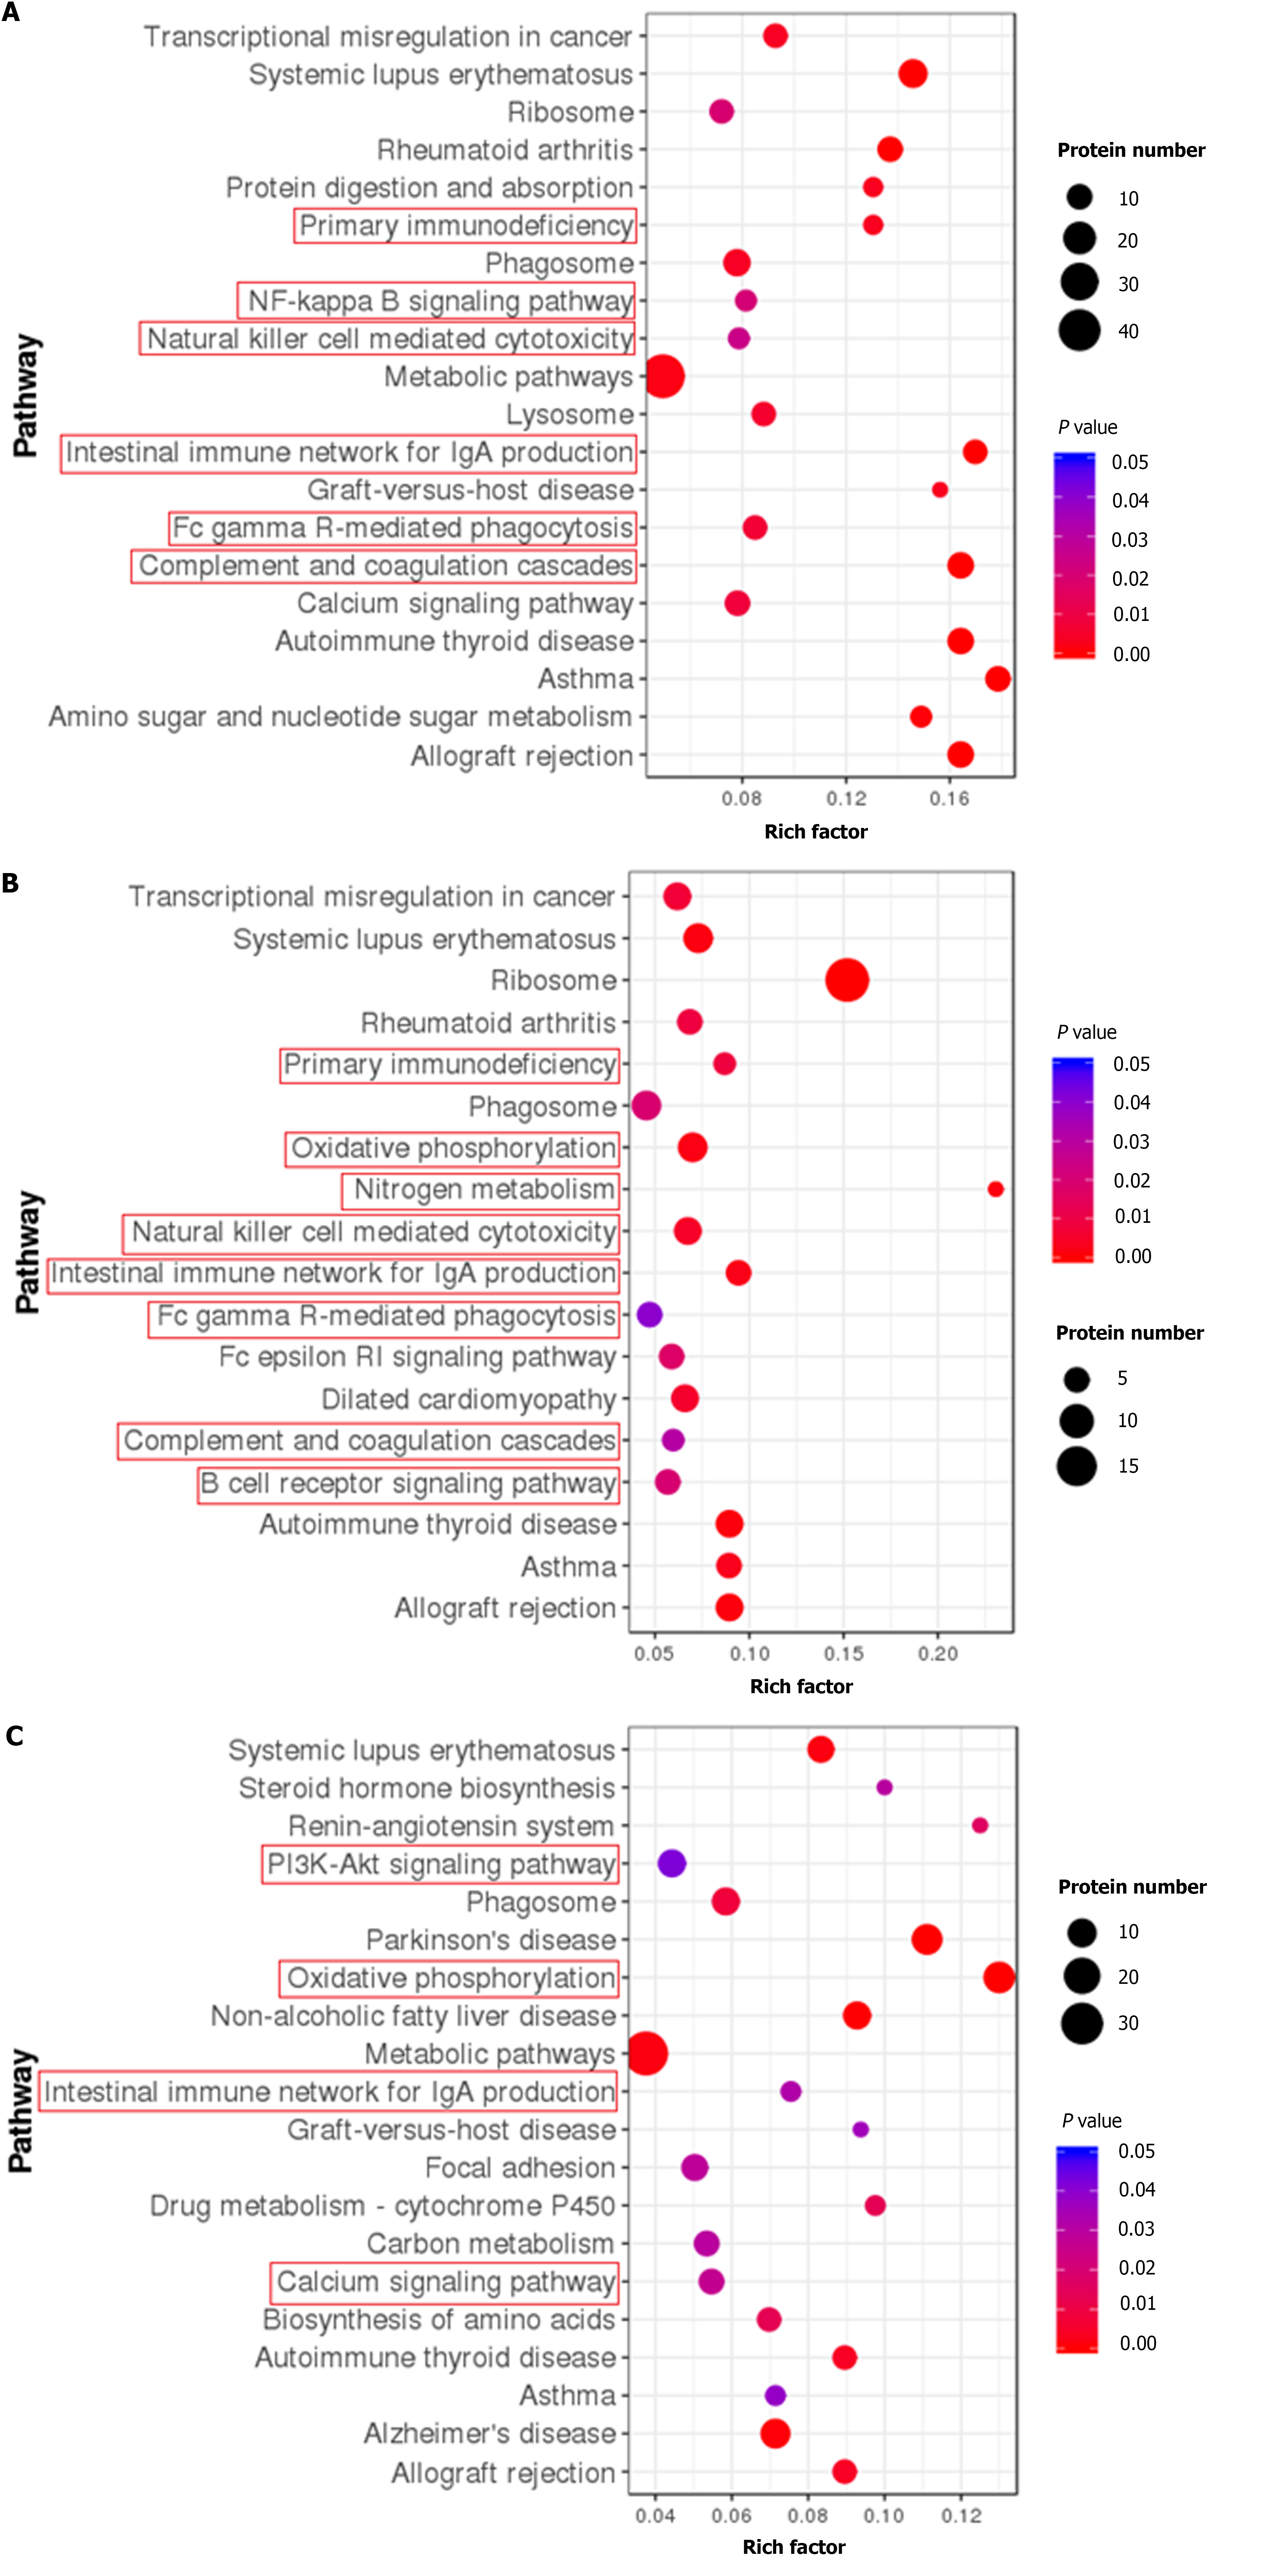
Figure 7 Kyoto Encyclopedia of Genes and Genomes pathway enrichment of differentially expressed proteins between groups.
A: Kyoto Encyclopedia of Genes and Genomes (KEGG) pathway enrichment of differentially expressed proteins (DEPs) between the normal and dextran sulfate sodium-induced ulcerative colitis model group; B: KEGG pathway enrichment of DEPs between the dextran sulfate sodium-induced ulcerative colitis model and herb-partitioned moxibustion group; C: KEGG pathway enrichment of DEPs between the dextran sulfate sodium-induced ulcerative colitis model and electroacupuncture group. Each point in the KEGG pathway enrichment plot represents a KEGG pathway, with the left axis showing the pathway name and the abscissa showing the enrichment factor, which represents the ratio of the number of DEPs annotated to that pathway to the number of proteins annotated to that pathway for that species’ protein. A larger enrichment factor indicates more reliable enrichment of DEPs in the pathway.
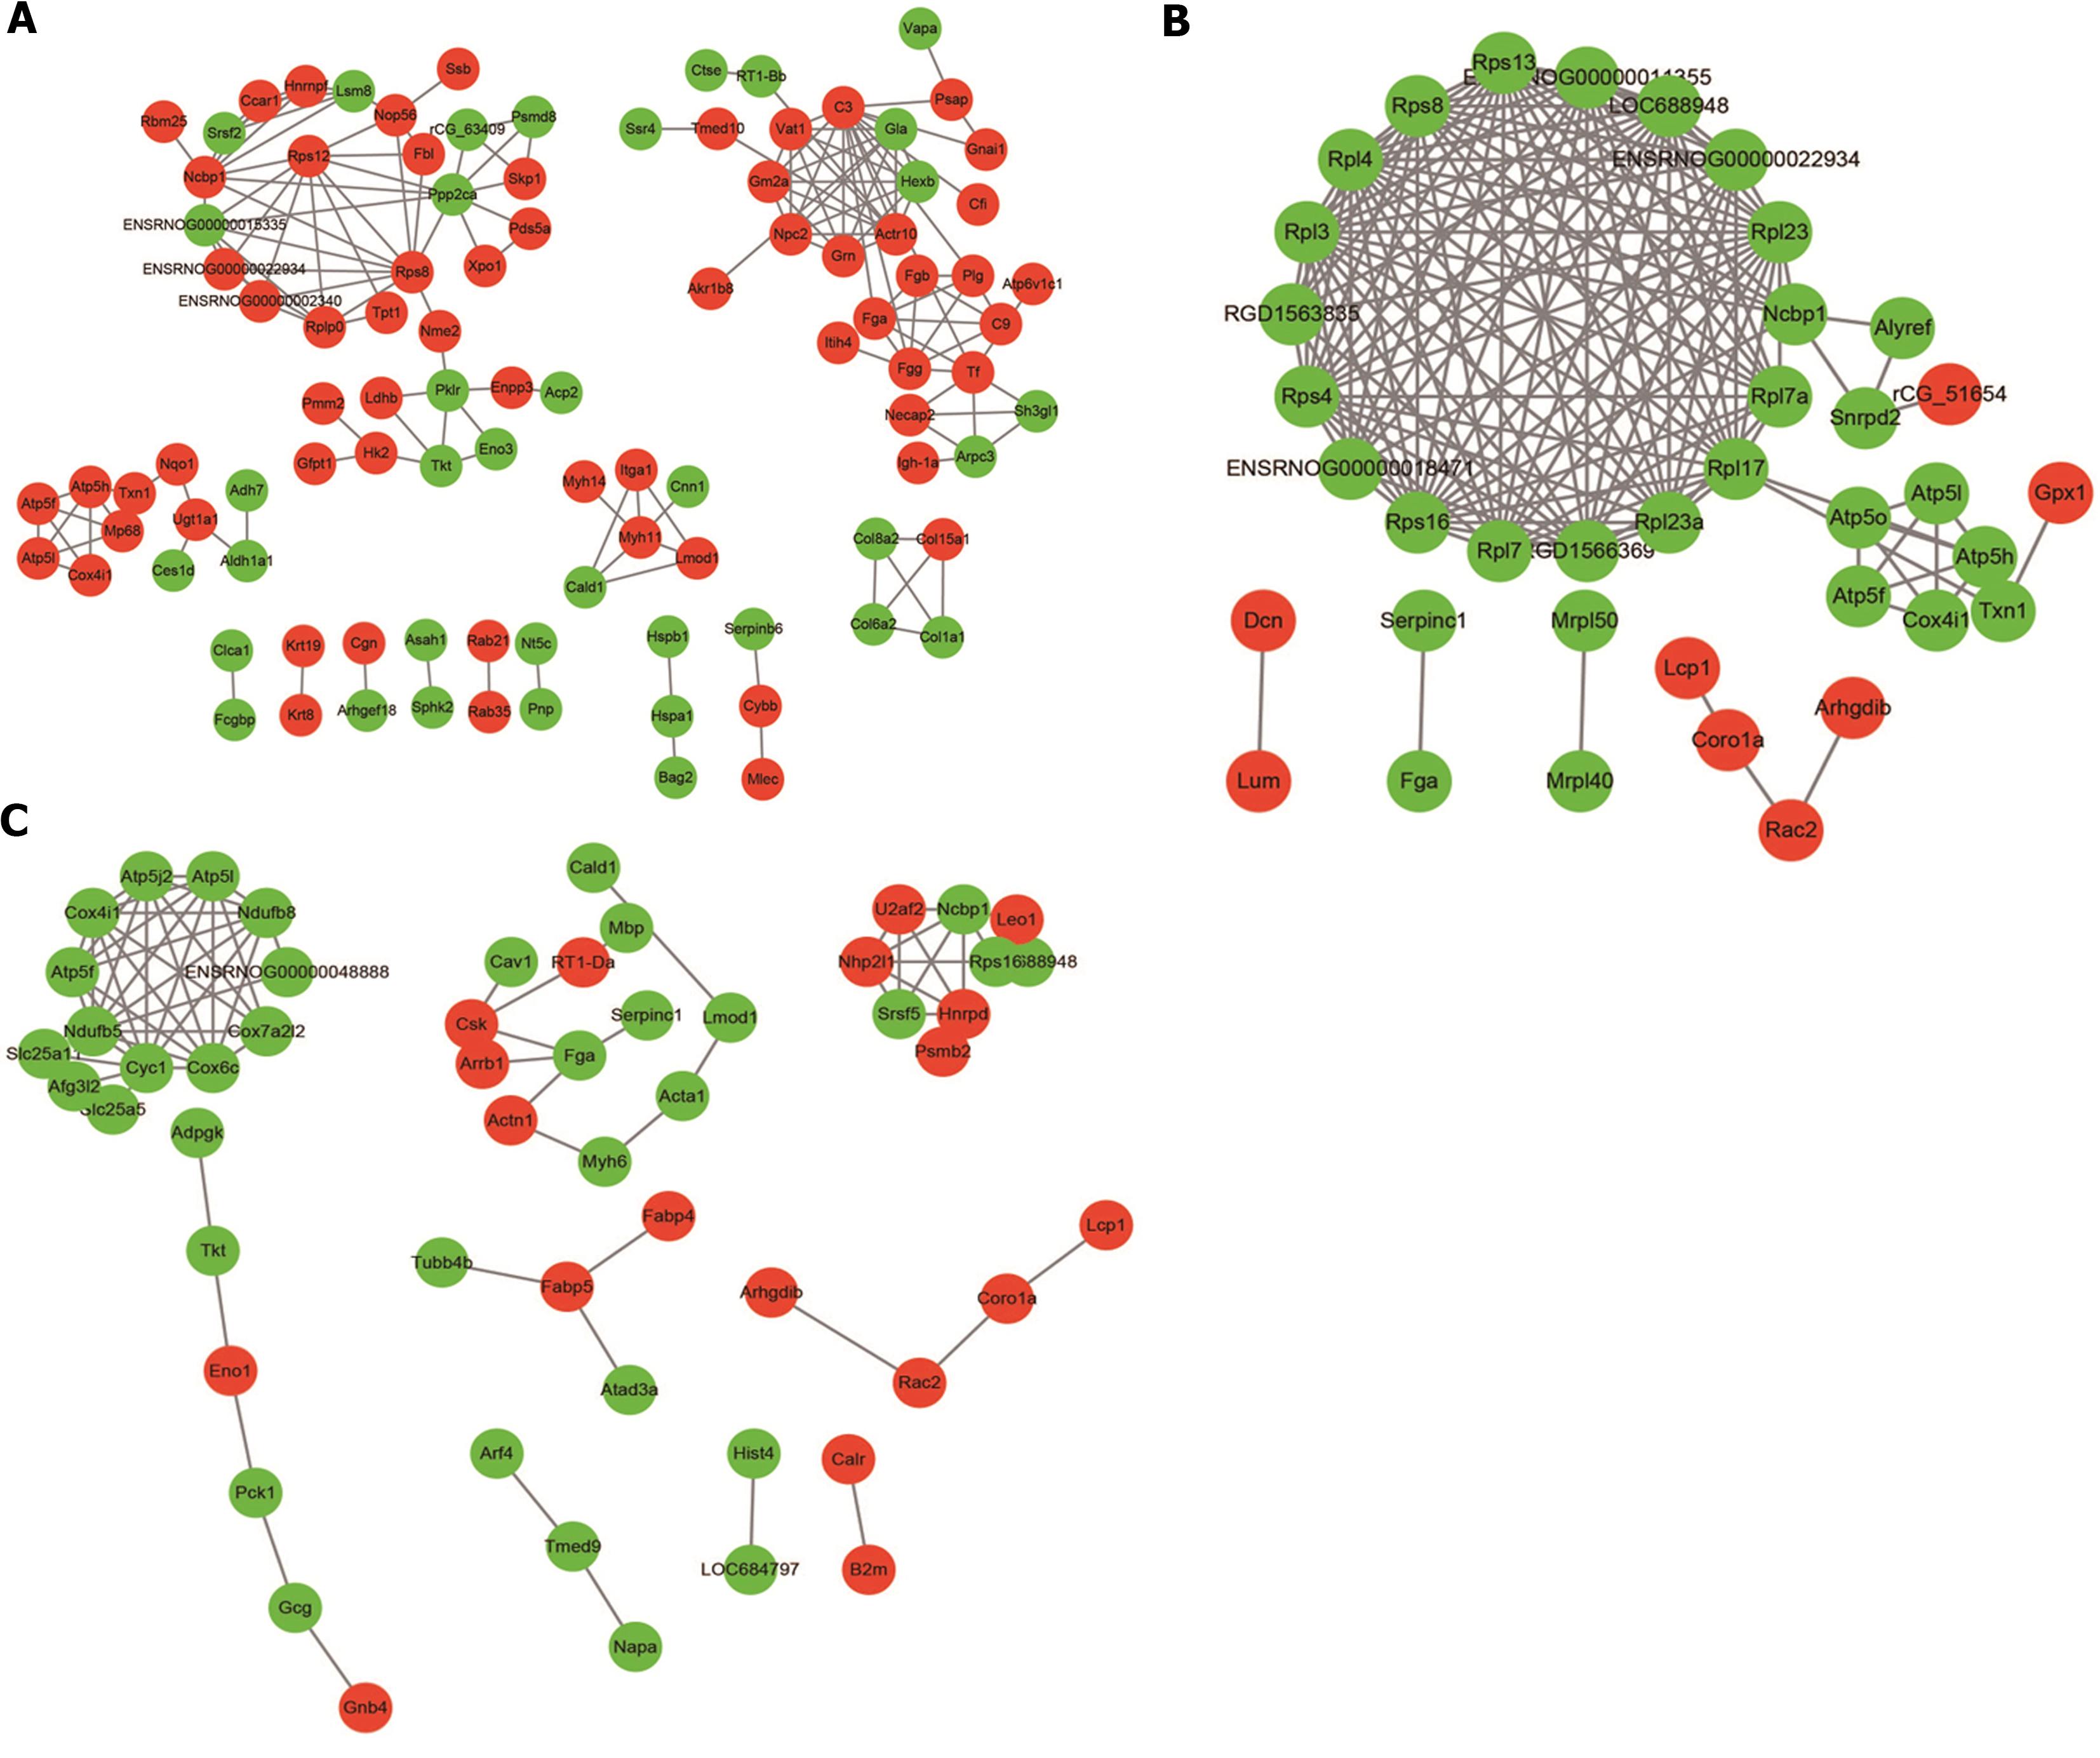
Figure 8 Protein-protein interaction network of differentially expressed proteins between groups.
A: Protein-protein interaction (PPI) network of differentially expressed proteins (DEPs) between the normal and dextran sulfate sodium-induced ulcerative colitis model group; B: PPI network of DEPs between the dextran sulfate sodium-induced ulcerative colitis model and herb-partitioned moxibustion group; C: PPI network of DEPs between the dextran sulfate sodium-induced ulcerative colitis model and electroacupuncture group. Circle colours indicate changes in protein expression, with red indicating up-regulation and green indicating down-regulation, and line thickness indicates interaction intensity.
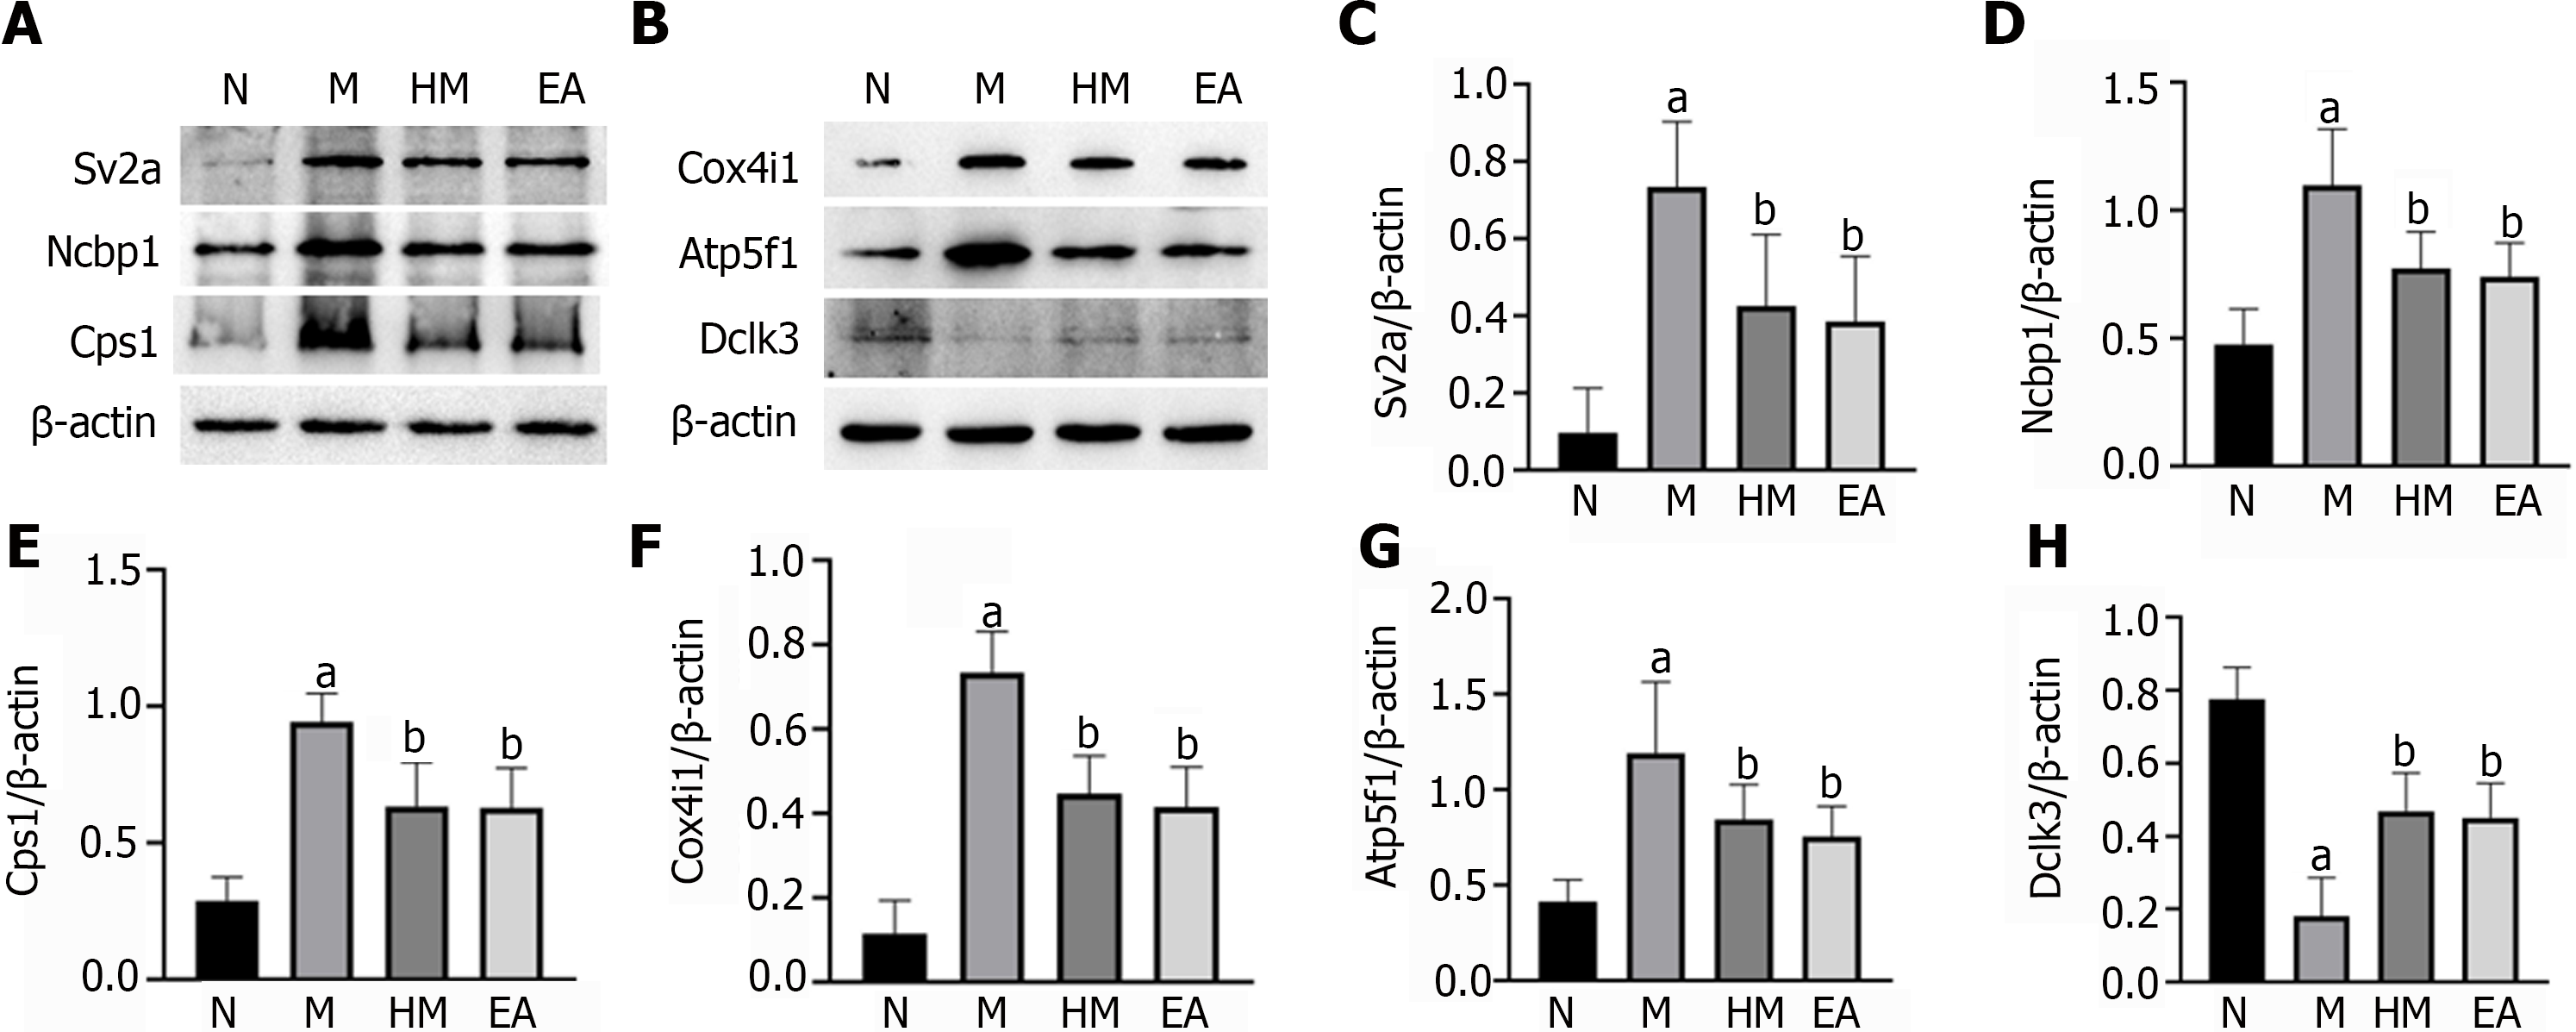
Figure 9 Verification of differentially expressed proteins expressions by western blot.
A and B: Band diagrams of protein expressions. All data are expressed as mean ± SD; C: Synaptic vesicle glycoprotein 2A; D: Nuclear cap binding protein subunit 1; E: Carbamoyl phosphate synthetase 1; F: Cytochrome c oxidase subunit 4 isoform 1; G: ATP synthase beta subunit precursor 1; H: Doublecortin like kinase 3. aP < 0.01 vs normal group; bP < 0.01 vs dextran sulfate sodium-induced ulcerative colitis model group. N: Normal group; M: Dextran sulfate sodium-induced ulcerative colitis model group; HM: Herb-partitioned moxibustion group; EA: Electroacupuncture group; Sv2a: Synaptic vesicle glycoprotein 2A; Ncbp1: Nuclear cap binding protein subunit 1; Cps1: Carbamoyl phosphate synthetase 1; Cox4i1: Cytochrome c oxidase subunit 4 isoform 1; Atp5f1: ATP synthase beta subunit precursor; Dclk3: Doublecortin like kinase 3.
- Citation: Qi Q, Zhong R, Liu YN, Zhao C, Huang Y, Lu Y, Ma Z, Zheng HD, Wu LY. Mechanism of electroacupuncture and herb-partitioned moxibustion on ulcerative colitis animal model: A study based on proteomics. World J Gastroenterol 2022; 28(28): 3644-3665
- URL: https://www.wjgnet.com/1007-9327/full/v28/i28/3644.htm
- DOI: https://dx.doi.org/10.3748/wjg.v28.i28.3644


