Copyright
©The Author(s) 2022.
World J Gastroenterol. Jul 14, 2022; 28(26): 3243-3257
Published online Jul 14, 2022. doi: 10.3748/wjg.v28.i26.3243
Published online Jul 14, 2022. doi: 10.3748/wjg.v28.i26.3243
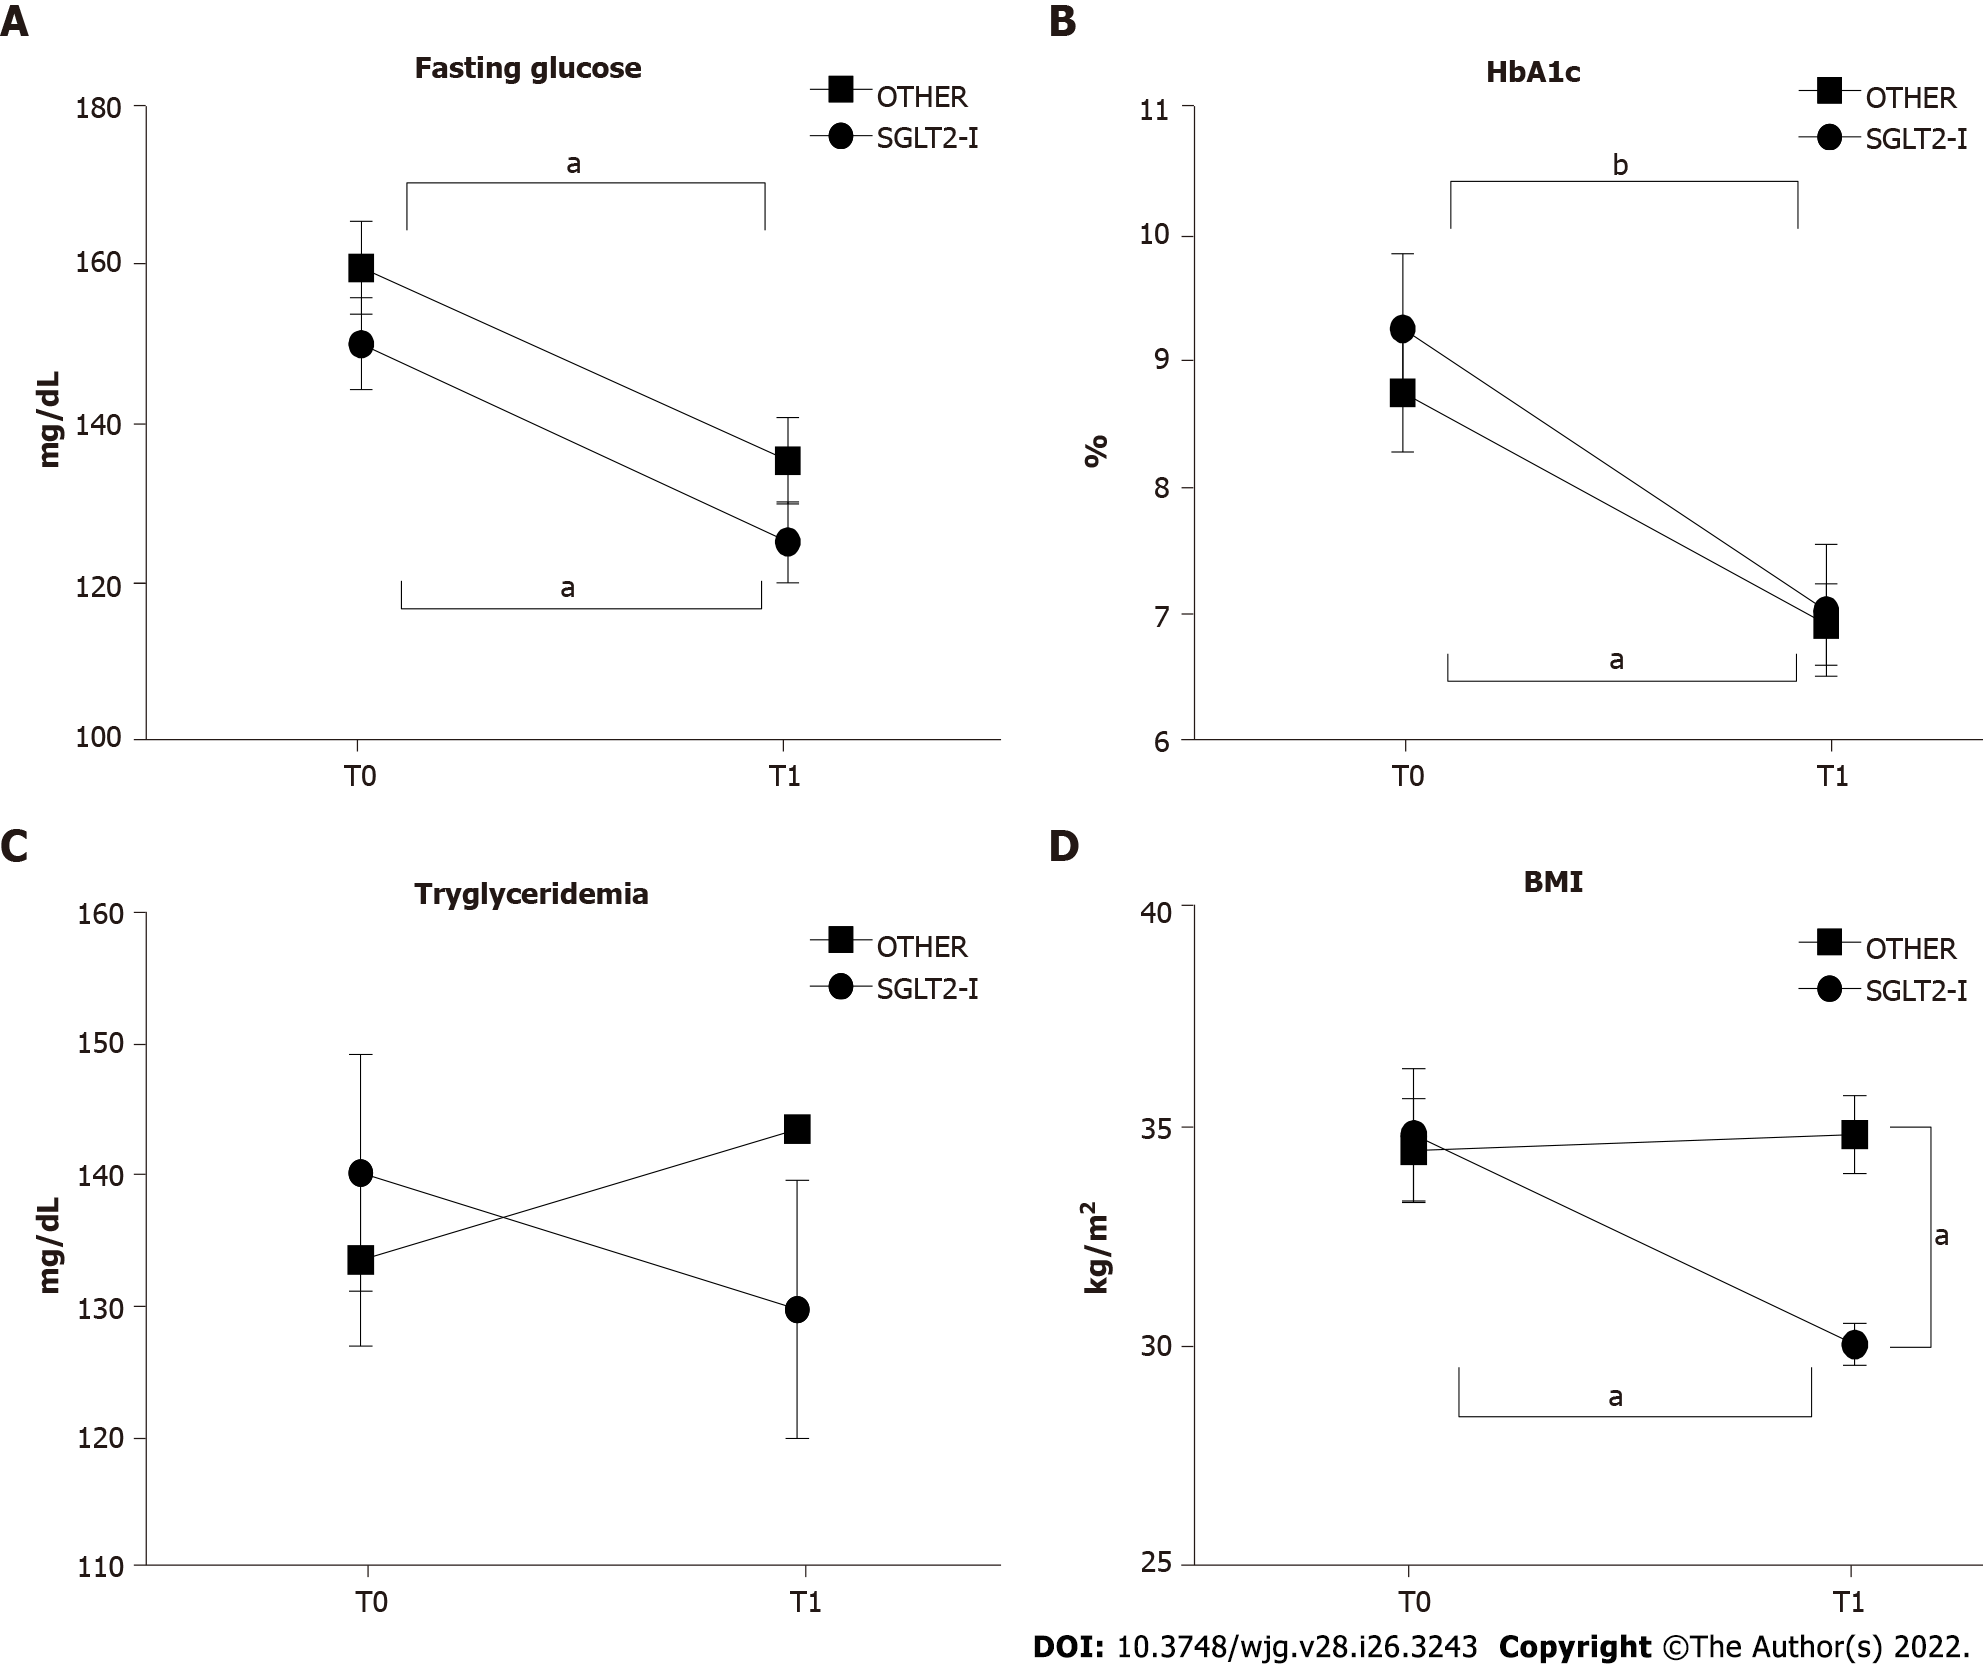
Figure 1 Glycemic control and body weight in patients enrolled in the study and included in groups treated with the sodium-glucose co-transporter-2 inhibitors or other glucose-lowering drugs before (T0) and after 1 wk of treatment (T1).
A: Serum fasting glucose; B: Serum hemoglobin A1c; C: Serum triglycerides; D: Body mass index in patients observed in the study, grouped according to the assigned treatment. Data in the graphs are represented as mean ± SEM. Two-way analysis of variance and Tukey assessed statistical differences as post hoc test. aP < 0.05, bP < 0.001. HbA1c: Hemoglobin A1c; SGLT2-I: Sodium-glucose co-transporter-2 inhibitor; OTHER: Other glucose lowering drug; BMI: Body mass index.
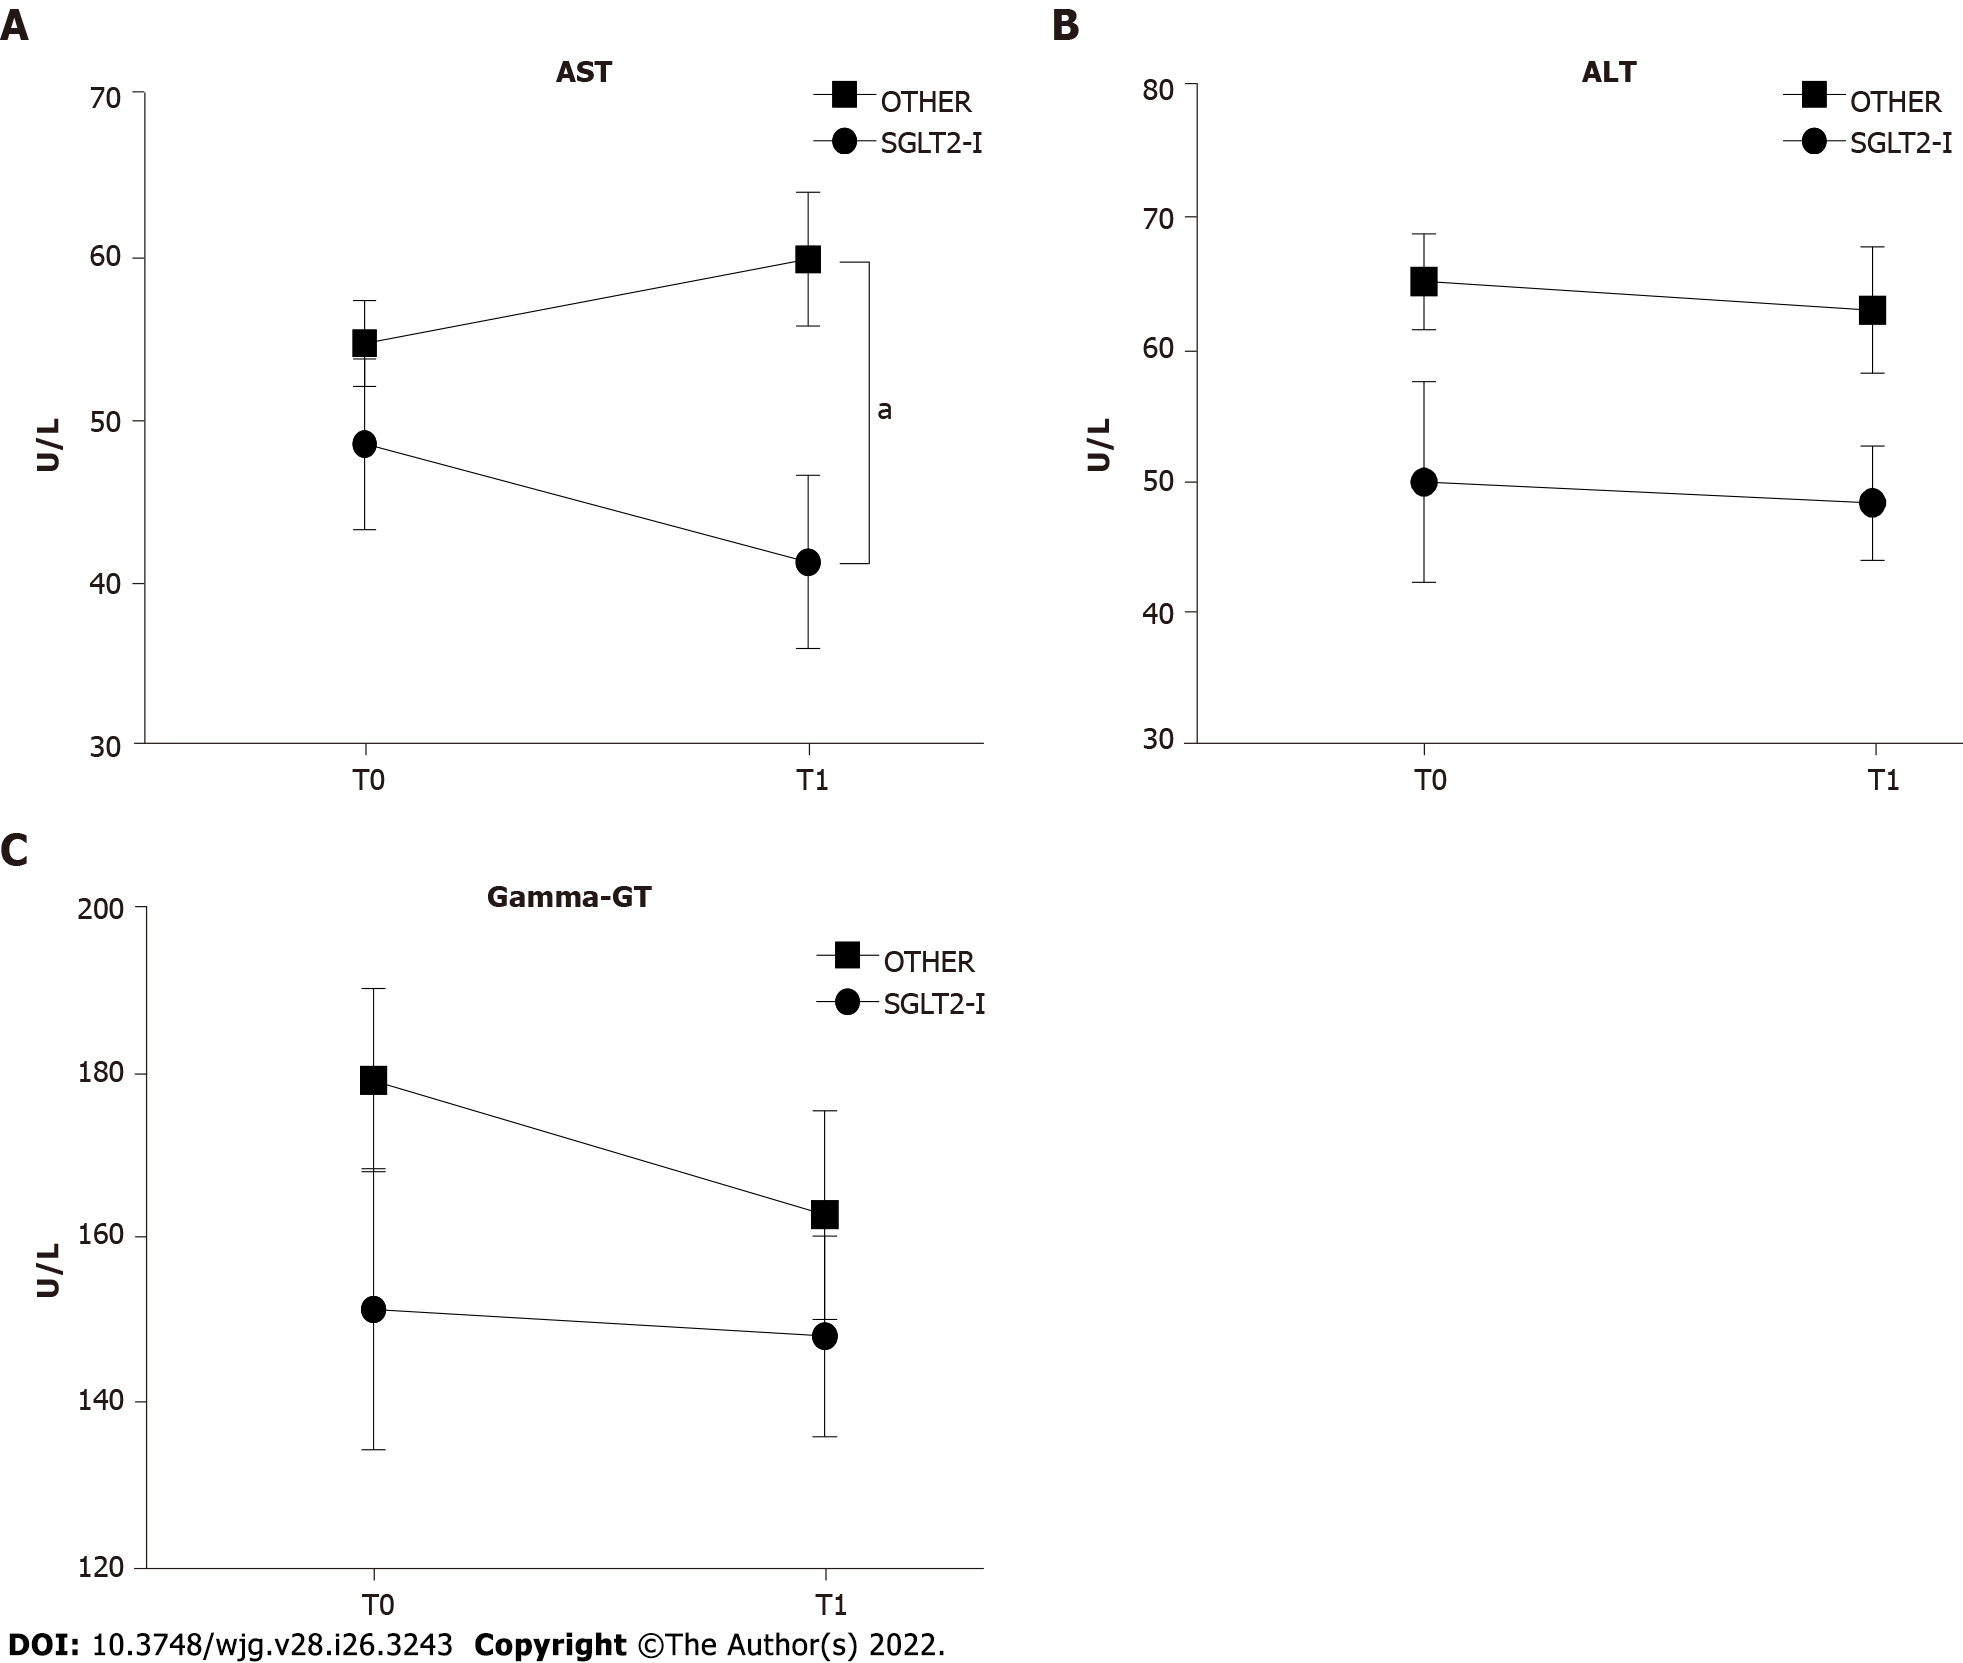
Figure 2 Serum liver enzyme activities in patients enrolled in the study and included in groups treated with the sodium-glucose co-transporter-2 inhibitors or other glucose-lowering drugs before (T0) and after 1 wk of treatment (T1).
A: Serum aspartate aminotransferase; B: Serum alanine aminotransferase; C: Serum gamma-glutamyl transpeptidase activities in patients observed in the study, grouped according to the assigned treatment. Data in the graphs are represented as mean ± SEM. Two-way analysis of variance and Tukey assessed statistical differences as posthoc test. aP < 0.05. AST: Aspartate aminotransferase; ALT: Alanine aminotransferase; Gamma-GT: Gamma-glutamyl transpeptidase; SGLT2-I: Sodium-glucose co-transporter-2 inhibitor; OTHER: Other glucose lowering drug.
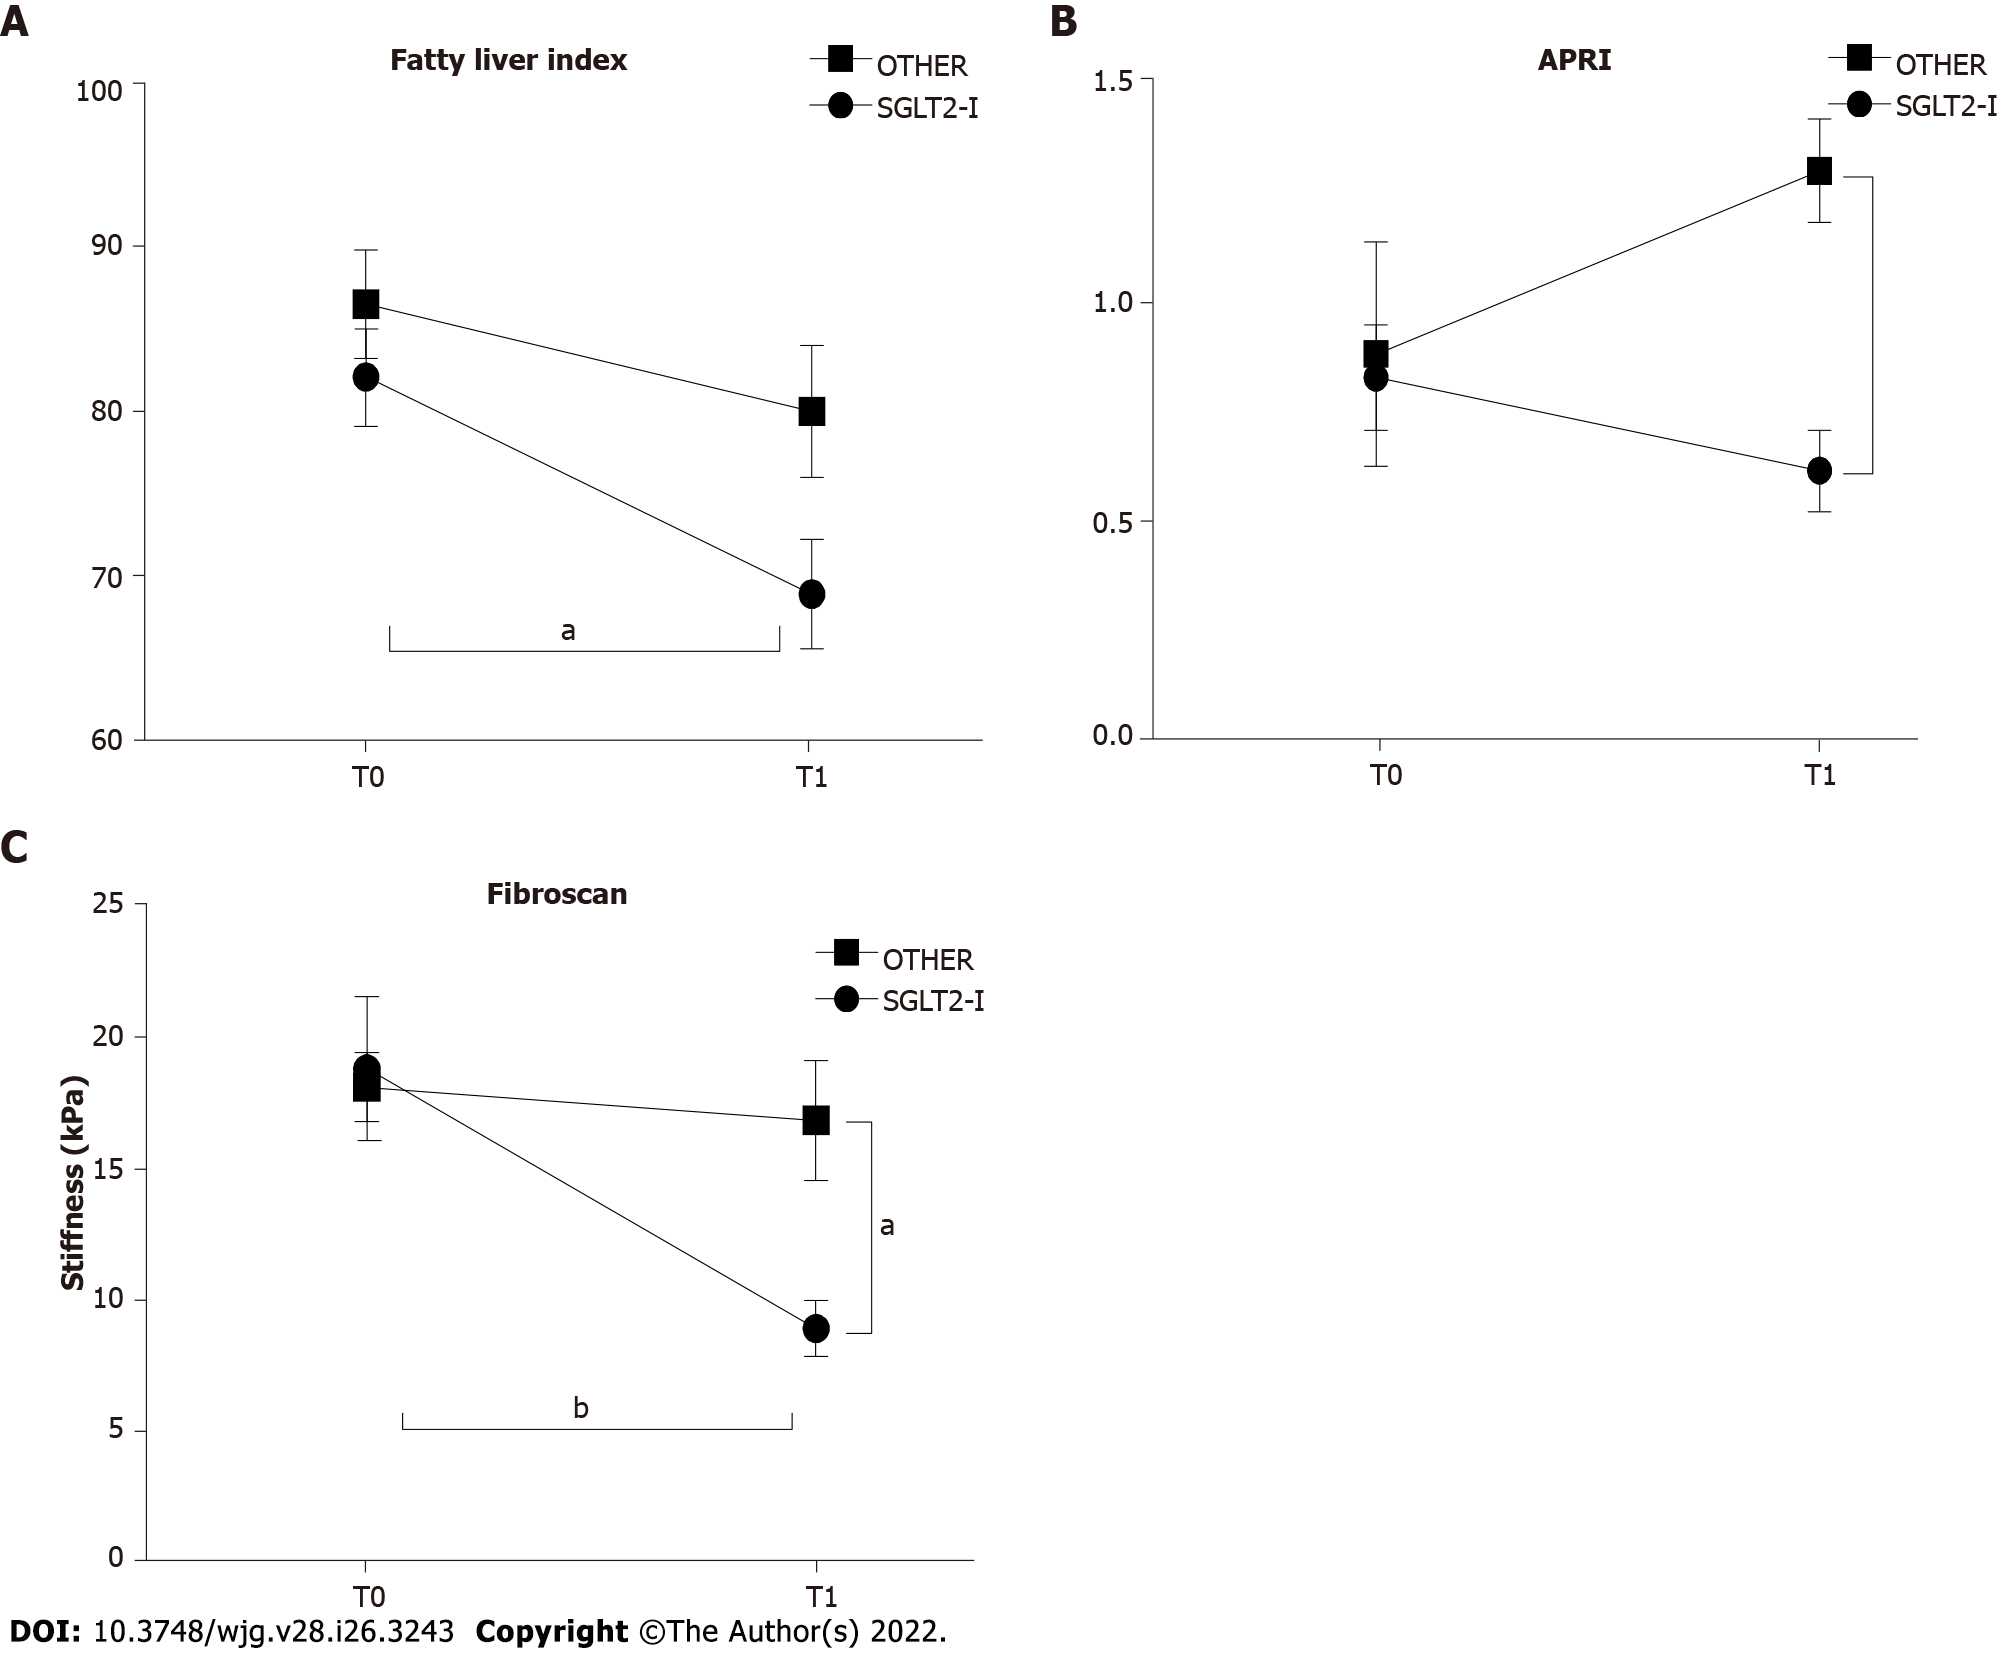
Figure 3 Non-invasive markers of liver steatosis and fibrosis in patients enrolled in the study and included in groups treated with the sodium-glucose co-transporter-2 inhibitors or other glucose glucose-lowering before (T0) and after 1 wk of treatment (T1).
A: Fatty liver index; B: Aspartate aminotransferase-to-platelet ratio index; C: Hepatic elastometry in patients observed in the study grouped according to the assigned treatment. Data in the graphs are represented as mean ± SEM. Two-way analysis of variance and Tukey assessed statistical differences as posthoc test. aP < 0.05, bP < 0.01. SGLT2-I: Sodium-glucose co-transporter-2 inhibitor; OTHER: Other glucose lowering drug; APRI: Aspartate aminotransferase-to-platelet ratio index.
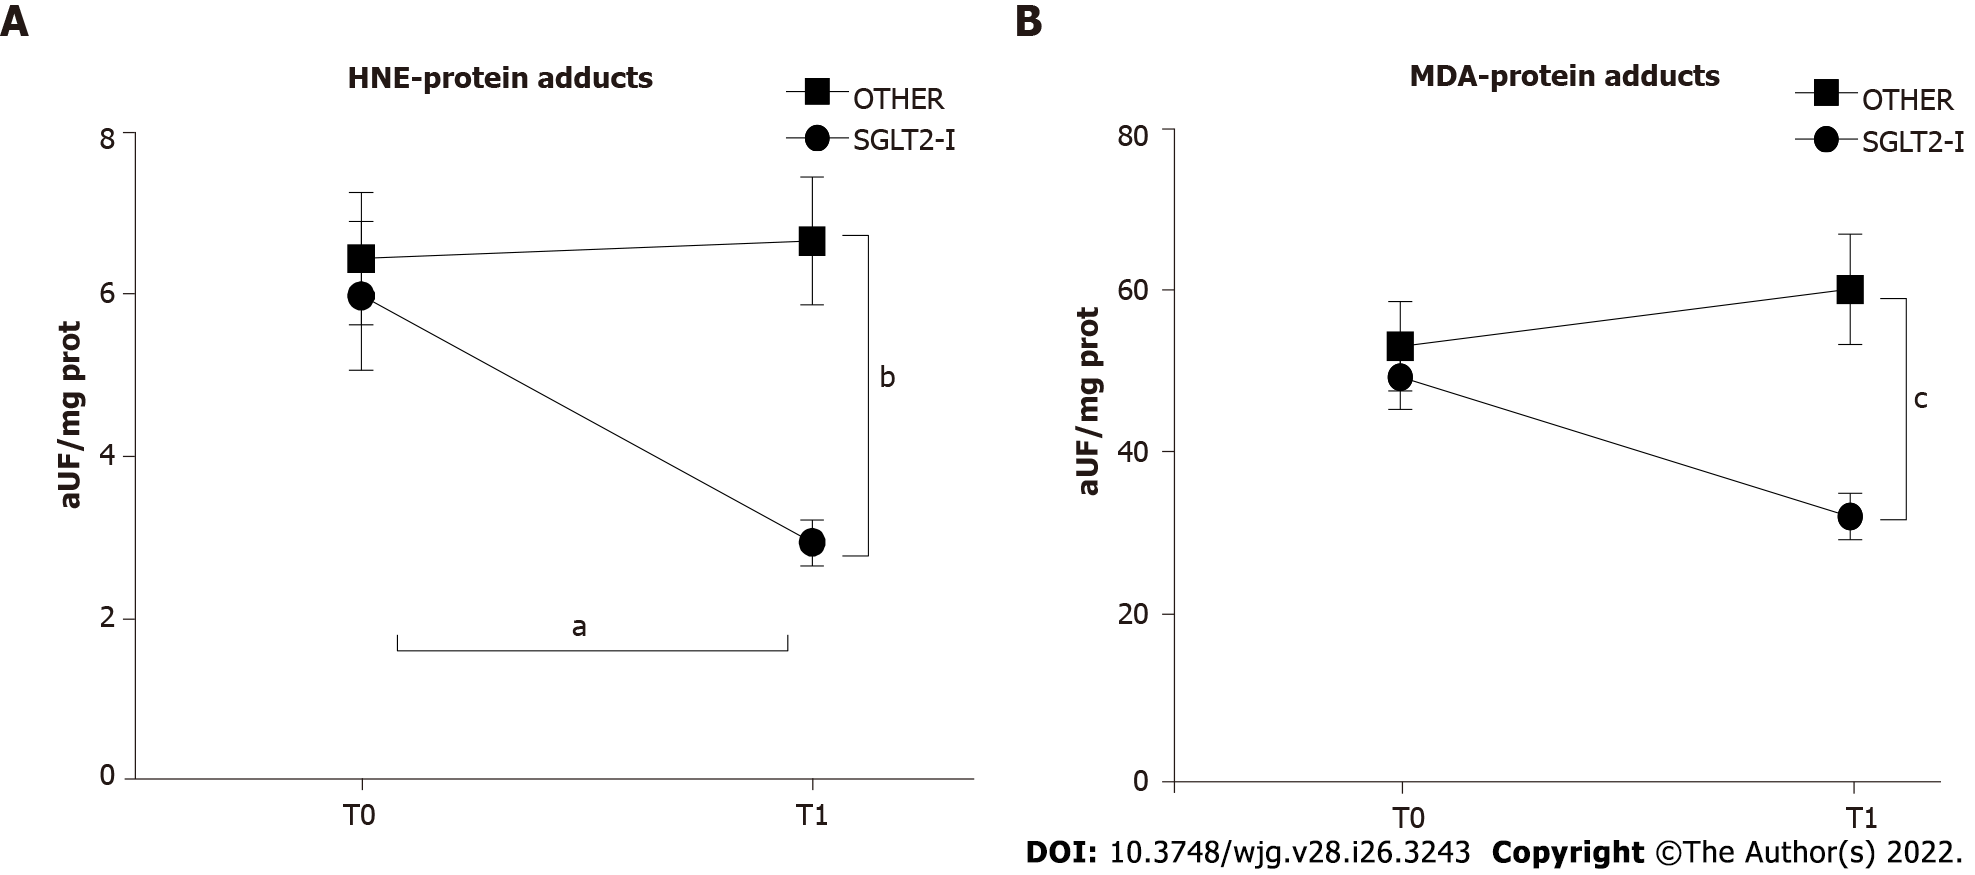
Figure 4 Circulating markers of oxidative stress in patients enrolled in the study and included in groups treated with the sodium-glucose co-transporter-2 inhibitors or other glucose-lowering drugs before (T0) and after 1 wk of treatment (T1).
Data in the graphs are represented as mean ± SEM. Two-way analysis of variance and Tukey assessed statistical differences as a post hoc test. aP < 0.05, bP < 0.01, cP < 0.001. HNE: Hydroxynonenal; MDA: Malondialdehyde; SGLT2-I: Sodium-glucose co-transporter-2 inhibitor; OTHER: Other glucose lowering drug.
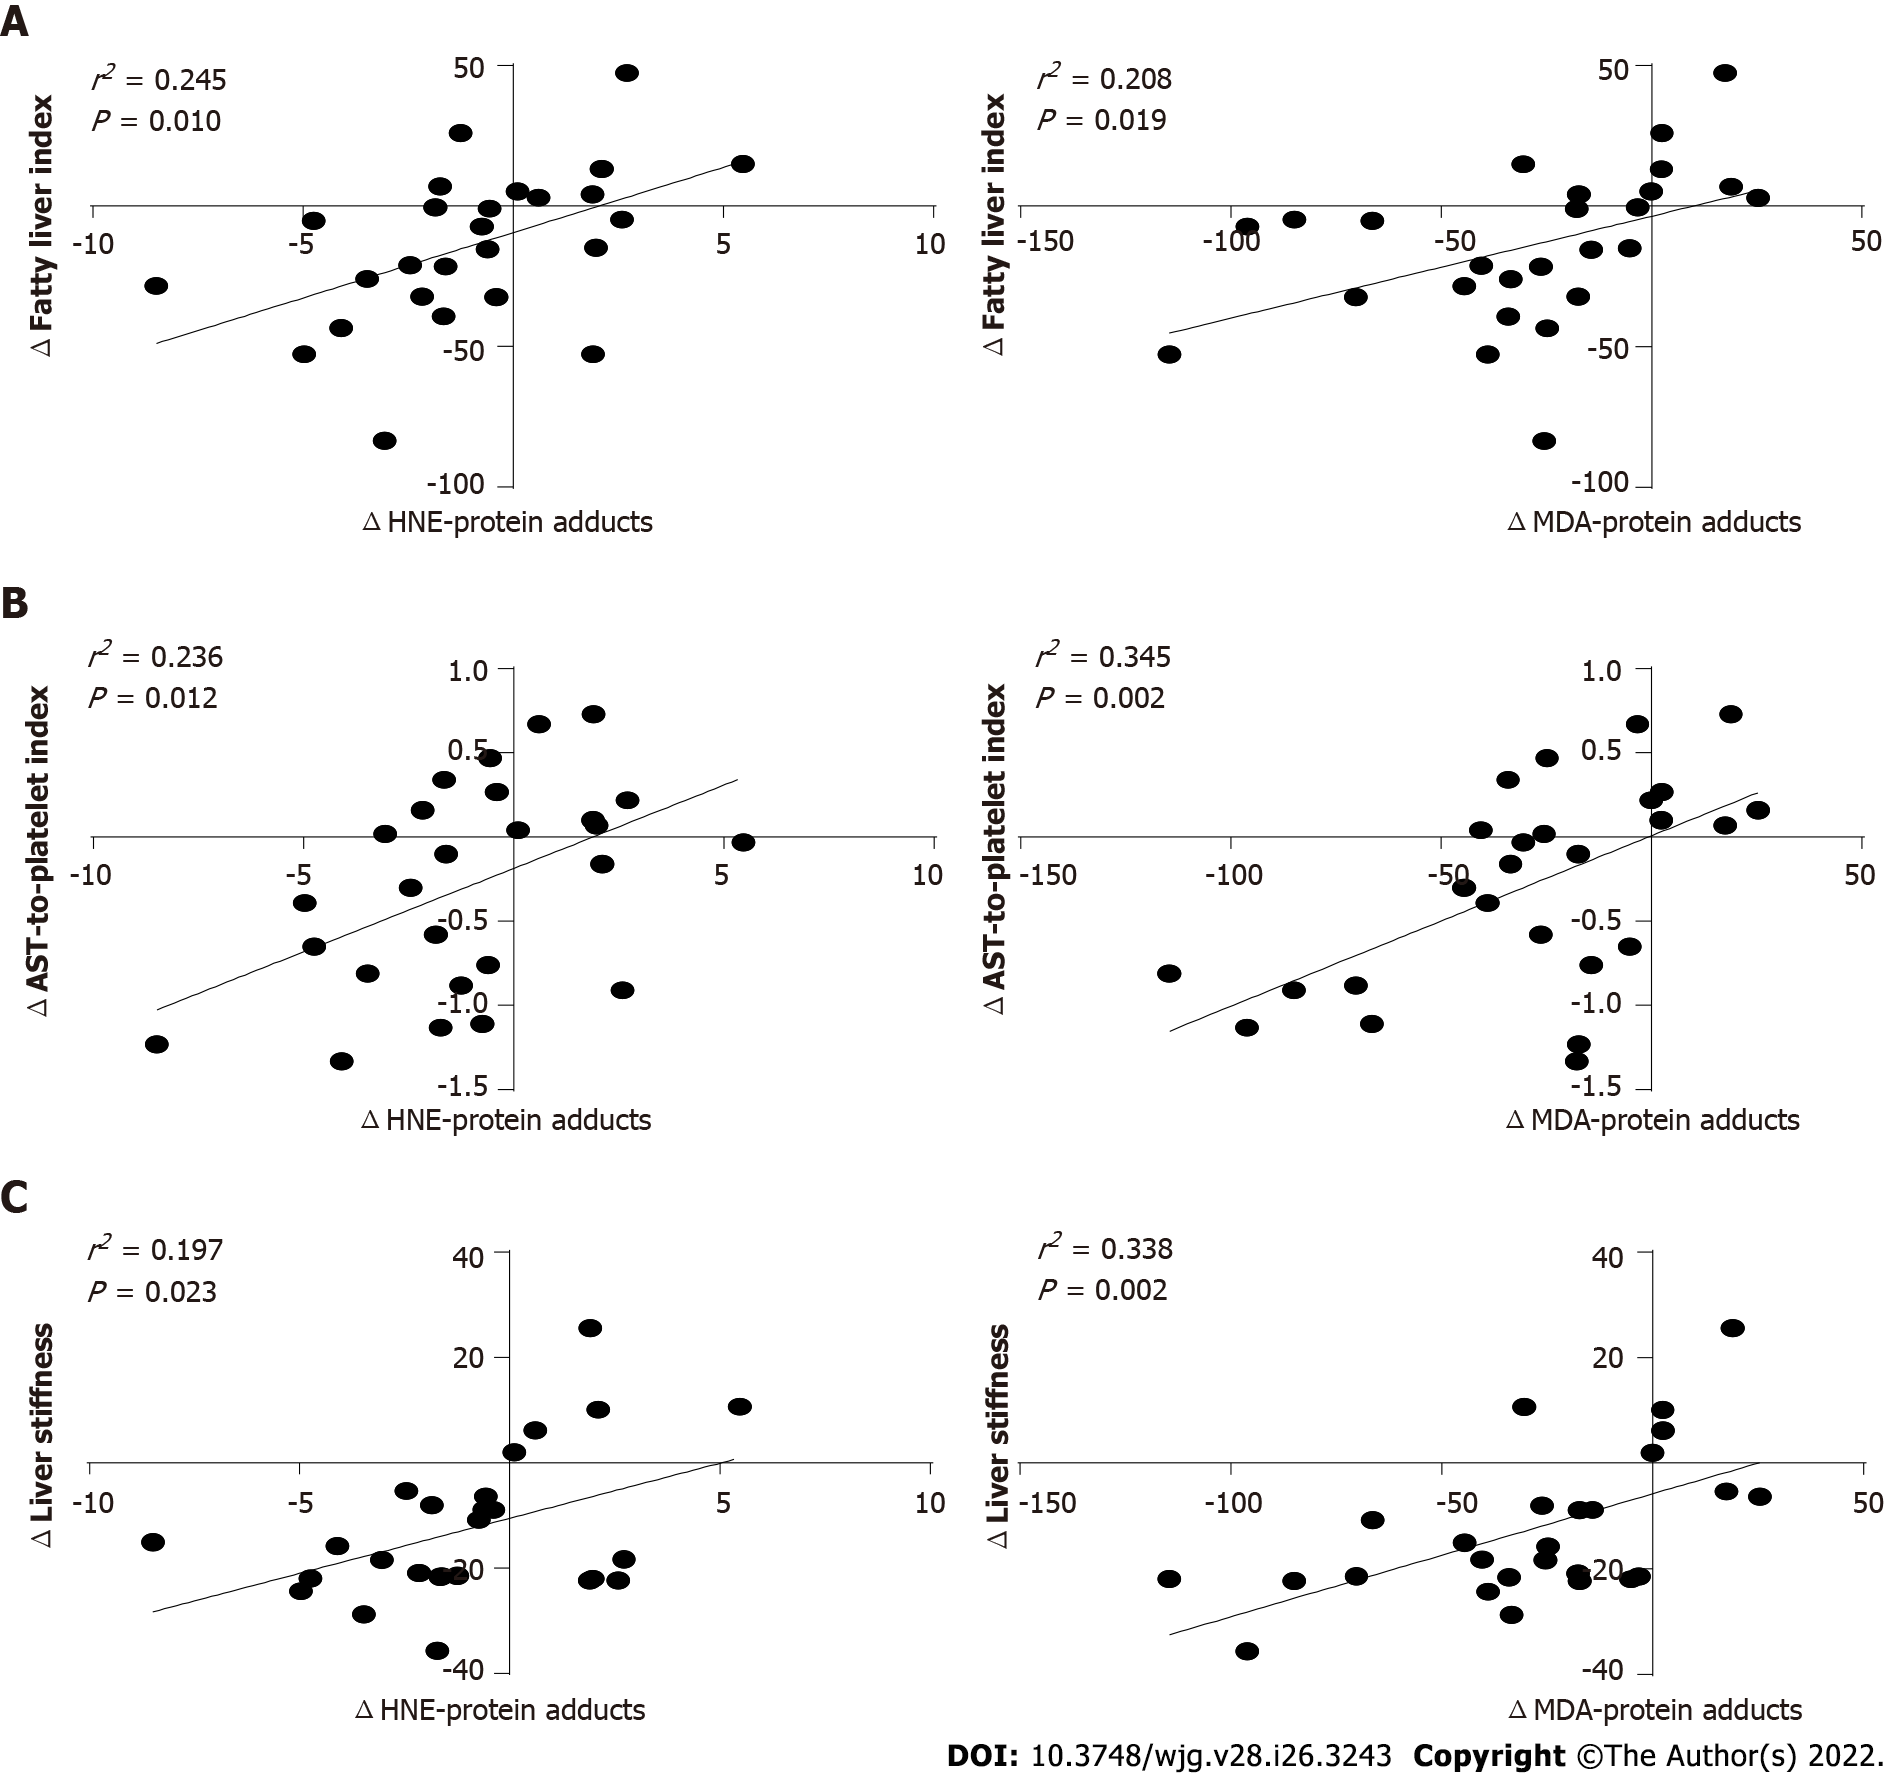
Figure 5 Linear regression analysis between the variation of circulating oxidative stress parameters and non-invasive markers of hepatic steatosis or fibrosis in patients treated with the sodium-glucose co-transporter-2 inhibitors.
Data in the graphs represent scatterplots of hydroxynonenal- or malondialdehyde-protein adducts A: Fatty liver index; B: Aspartate aminotransferase-to-platelet ratio index; C: Liver stiffness. HNE: Hydroxynonenal; AST: Aspartate aminotransferase; MDA: Malondialdehyd.
- Citation: Bellanti F, Lo Buglio A, Dobrakowski M, Kasperczyk A, Kasperczyk S, Aich P, Singh SP, Serviddio G, Vendemiale G. Impact of sodium glucose cotransporter-2 inhibitors on liver steatosis/fibrosis/inflammation and redox balance in non-alcoholic fatty liver disease. World J Gastroenterol 2022; 28(26): 3243-3257
- URL: https://www.wjgnet.com/1007-9327/full/v28/i26/3243.htm
- DOI: https://dx.doi.org/10.3748/wjg.v28.i26.3243


