Copyright
©The Author(s) 2022.
World J Gastroenterol. Jul 14, 2022; 28(26): 3232-3242
Published online Jul 14, 2022. doi: 10.3748/wjg.v28.i26.3232
Published online Jul 14, 2022. doi: 10.3748/wjg.v28.i26.3232
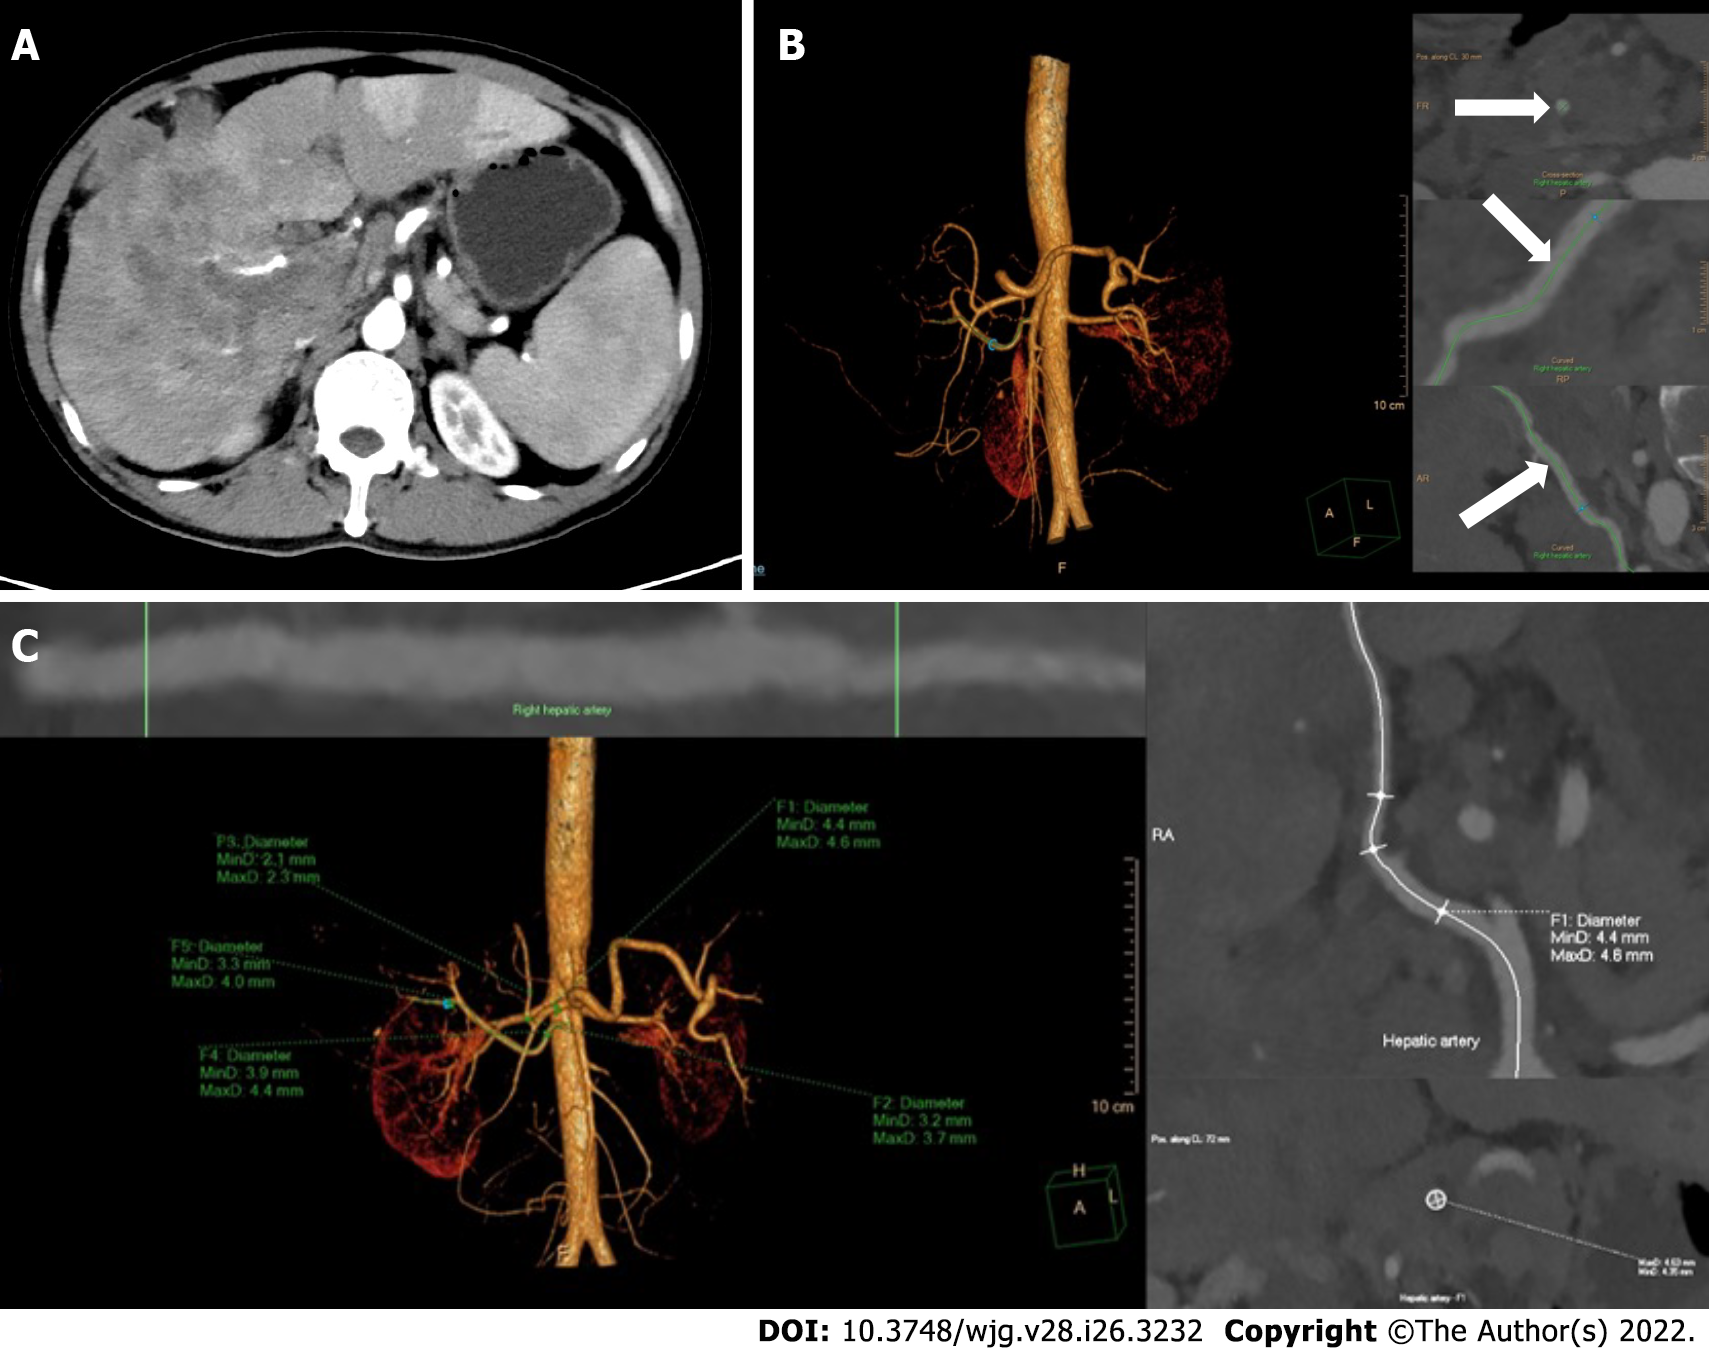
Figure 1 Reconstruction and measurement of the hepatic arteries.
A: The thickest branch of tumor-feeding arteries generated from the right hepatic artery; B: Three-dimensional reconstruction of hepatic arteries in an image post-processing workstation and the adjustment of center line (arrows) on multiple layers; C: The hepatic artery diameters are measured automatically by drawing the region of interest. F1-5, the opening of the common hepatic artery, the proper hepatic artery, the left hepatic artery, the right hepatic artery and the tumor-feeding artery.
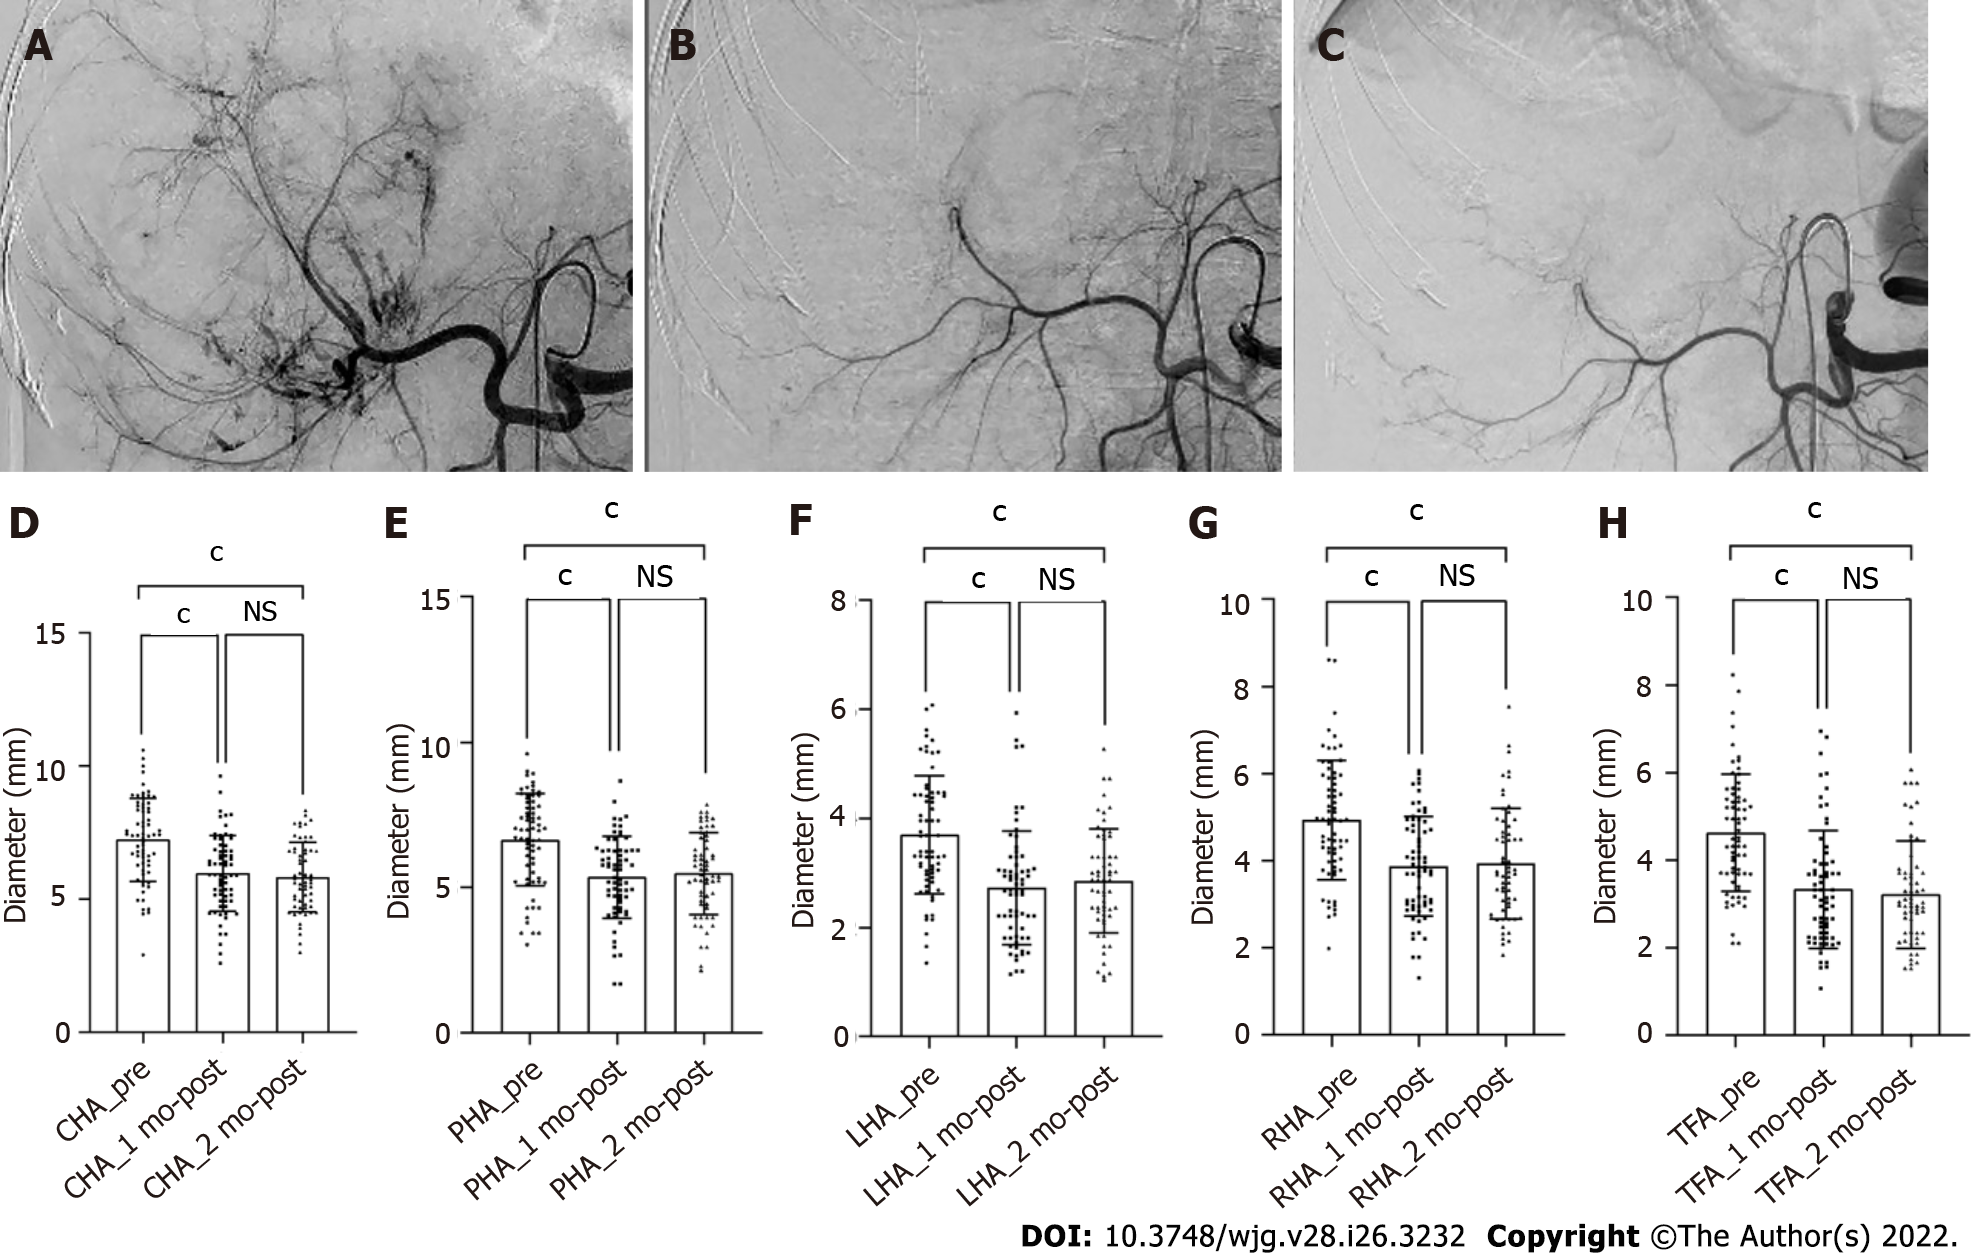
Figure 2 Shrinkage of the hepatic artery diameters in patient with unresectable hepatocellular carcinoma after treatment with hepatic arterial infusion chemotherapy plus lenvatinib.
A-C: Digital subtraction angiography performed before treatment (A), after 1 (B) and 2 (C) mo of treatment; D-H: Bars represent the vessel diameters before treatment, at 1 and 2 mo after treatment. P-values are calculated using the mixed linear model for repeated measured data. cP < 0.001. NS: Not significant (P > 0.05); CHA: Common hepatic artery; PHA: Proper hepatic artery; LHA: Left hepatic artery; RHA: Right hepatic artery; TFA: Tumor-feeding artery.
Figure 3 Anti-angiogenic activities of lenvatinib in tumor lesions.
A and B: The microvessels in the tumor lesion collected before (A) and after 1 mo (B) of treatment with lenvatinib are stained with anti-CD34 antibody (× 100); C: Bars represent the microvessel density that decreased sharply after administration of lenvatinib. Data are presented as means ± SD. cP < 0.001 vs before treatment. MVD: Micro-vessel density.
- Citation: Wu DD, He XF, Tian C, Peng P, Chen CL, Liu XH, Pang HJ. Tumor-feeding artery diameter reduction is associated with improved short-term effect of hepatic arterial infusion chemotherapy plus lenvatinib treatment. World J Gastroenterol 2022; 28(26): 3232-3242
- URL: https://www.wjgnet.com/1007-9327/full/v28/i26/3232.htm
- DOI: https://dx.doi.org/10.3748/wjg.v28.i26.3232


